Table of contents
- Main points
- Business impact of the coronavirus
- Social impacts of the coronavirus on Great Britain
- Company incorporations and voluntary dissolution applications
- Online job adverts
- Online price change in food and drink basket
- Energy Performance Certificates
- Footfall
- Roads and traffic camera data
- Shipping
- Data
- Glossary
- Measuring the data
- Strengths and limitations
- Related links
1. Main points
10% of the workforce remained on furlough leave, and 11% of businesses were at a moderate or severe risk of insolvency, according to the Business Impact of Coronavirus (COVID-19) Survey (BICS). See Section 2.
The proportion of adults travelling to work rose above 60% for the first time according to the latest Opinions and Lifestyle Survey (OPN). See Section 3.
In the week starting Saturday 5 September, there was an average of 1,004 voluntary dissolution applications per working day, which is consistent with the Quarter 3 (July to Sept) 2019 average (1,008) but above levels seen over the last few months. See Section 4.
In the latest week, every region and country of the UK except Yorkshire and The Humber saw an increase in the volume of online job adverts. See Section 5.
Prices of items in the food and drink basket decreased by 0.1% in the latest week, driven by several categories such as bread and cereals and vegetables. See Section 6.
In the week starting Monday 7 September, Energy Performance Certificates (EPCs) across England and Wales were 16% higher for existing dwellings and 3% lower for new dwellings than their levels the same week a year ago. See Section 7.
In the week starting Monday 7 September, overall footfall fell slightly compared with the previous two weeks, driven by reduced footfall in all types of retail location. See Section 8.
Department for Transport (DfT) traffic count data show that on Monday 14 September, all motor vehicle traffic was three percentage points below traffic seen on the equivalent Monday in the first week of February, the highest recorded level since the Prime Minister’s announcement on 16 March. See Section 9.
According to traffic camera data, between 7 and 13 September counts of cars, pedestrians and cyclists in London were around 5% above the average level seen immediately before lockdown (11 to 22 March). See Section 9.
Between 7 and 13 September, the average volume of daily ship visits was 324, compared with an average of 377 in the week immediately before lockdown (16 to 22 March). See Section 10.
The Business Impact of COVID-19 Survey (BICS) is voluntary and currently unweighted, so it may only reflect the characteristics of those that responded. Results presented are experimental.
4. Company incorporations and voluntary dissolution applications
Incorporations
Figure 3: In the week starting Saturday 5 September, there was an average of 3,083 company incorporations per working day, which is above the Quarter 3 average (2,612)
Company incorporations per working day, UK, quarterly and weekly, Quarter 1 2019 to Quarter 2 2020, and week commencing 29 February 2020 to week commencing Saturday 5 September 2020
Source: Companies House and Office for National Statistics
Notes:
- Data presented per working day to allow comparison between quarterly data and weekly data and account for processing differences associated with bank holidays.
- Quarterly data from Companies House official statistics release, divided by number of working days, presented at the mid-point of the calendar quarter.
- Weekly data are for week starting Saturday to Friday, as incorporation requests received on Saturdays and Sundays are typically processed on subsequent weekdays. For more information, see the accompanying Companies House methodology page.
- Please note that Companies House quarterly official statistics include figures for Community Interest Company (CIC) incorporations, which are not included in the weekly series. Typically, these account for less than 1% of incorporations.
Download this chart Figure 3: In the week starting Saturday 5 September, there was an average of 3,083 company incorporations per working day, which is above the Quarter 3 average (2,612)
Image .csv .xlsThe observed fluctuations in weekly incorporations per working day between April to early May 2020 and June to the end of July 2020 coincide with government-instigated lockdown measures and the subsequent easing of them in response to the coronavirus (COVID-19) pandemic. This is in line with official statistics published by Companies House on 30 July 2020.
Voluntary dissolution applications
Figure 4: In the week starting Saturday 5 September, there was an average of 1,004 voluntary dissolution applications per working day, which is consistent with the Quarter 3 2019 average (1,008)
Company voluntary dissolution applications per working day, UK, quarterly and weekly, Quarter 1 (Jan to Mar) 2019 to Quarter 2 (Apr to June) 2020, and week starting 29 February 2020 to week starting Saturday 5 September 2020
Source: Companies House and Office for National Statistics
Notes:
- Data presented per working day to allow comparison between quarterly data and weekly data and to account for processing differences associated with Bank Holidays. Quarterly data are presented at the mid-point of the quarter.
- Weekly data are weeks from Saturday to Friday, as voluntary dissolution requests received on Saturdays and Sundays are typically processed on subsequent weekdays. For more information, see the accompanying Companies House methodology page.
Download this chart Figure 4: In the week starting Saturday 5 September, there was an average of 1,004 voluntary dissolution applications per working day, which is consistent with the Quarter 3 2019 average (1,008)
Image .csv .xlsFor more information on other measures of company closures not presented here, see Weekly indicators of company creations and closures from Companies House methodology: August 2020.
Back to table of contents5. Online job adverts
These figures use job adverts provided by Adzuna, an online job search engine, and include experimental estimates of online job adverts by Adzuna category and by UK country and NUTS1 regions. The number of job adverts over time is an indicator of the demand for labour. The Adzuna categories used do not correspond to Standard Industrial Classification (SIC) categories, so these values are not directly comparable with the Office for National Statistics (ONS) Vacancy Survey.
Figure 5: Between 4 and 11 September, total online job adverts increased from 50% to 53% of their 2019 average
Total weekly job adverts on Adzuna, UK, 4 January 2019 to 11 September 2020, index 2019 average = 100
Embed code
Notes:
The observations were collected on a roughly weekly basis; however, they were not all observed at the same point in each week, leading to slightly irregular gaps between each observation.
These series have a small number of missing weeks, mostly in late 2019, and the latest is in January 2020. These values have been imputed using linear interpolation. The data points that have been imputed are clearly marked in the accompanying dataset.
Further category breakdowns are included in the Online job advert estimates dataset, and more details on the methodology can be found in Using Adzuna data to derive an indicator of weekly vacancies.
Download the data
The three percentage point increase in the volume of online job adverts in the last week was spread evenly across the Adzuna categories, with an increase in 24 of the 28 categories (this count excludes the “unknown” category).
In particular, the volume of online job adverts in the information technology, computing and software category increased seven percentage points to 64% of its 2019 average, its highest level since 17 April. Online job adverts also increased five percentage points in wholesale and retail and four percentage points in health care and social care, partially offsetting the previous week’s decrease.
Figure 6: In the latest week, every region and country of the UK except Yorkshire and The Humber saw an increase in the volume of online job adverts
Total weekly job adverts on Adzuna, UK, 4 January 2019 to 11 September 2020, index 2019 average = 100, percentage points
Embed code
Notes:
- There is a level shift in the Northern Ireland series from 17 October 2019 because of a large source of Northern Ireland job adverts being removed, and there is another level shift from 7 August 2020 because of a new source being included.
Download the data
The largest increase in online job adverts in the latest period was in Northern Ireland, where they increased six percentage points, followed by Wales and the South West which both saw a four percentage point increase. The only decrease was in Yorkshire and The Humber, where online job adverts decreased one percentage point.
Back to table of contents6. Online price change in food and drink basket
We have developed a timely indication of weekly price changes for a selection of food and drink products from several large UK retailers, covering the period 1 June to 13 September 2020. Details of the methodology used for these indicators can be found in Online price changes methodology. This analysis is experimental and should not be compared with our regular consumer price statistics.
Online prices of items in the food and drink basket decreased overall by 0.1% between Weeks 14 and 15. Figure 7 presents the contributions to this weekly change from each of the main categories of items.
Figure 7: Prices of items in the food and drink basket decreased by 0.1% in the latest week, driven by several categories such as bread and cereals and vegetables
Contributions to online price change of a selection of food and drink products, UK, percentage point contributions to the percentage change between Week 14 (31 August to 6 September 2020) and Week 15 (7 September to 13 September 2020)
Source: Office for National Statistics – Faster indicators
Notes:
- Contributions may not always sum to the weekly change, as a result of rounding.
Download this chart Figure 7: Prices of items in the food and drink basket decreased by 0.1% in the latest week, driven by several categories such as bread and cereals and vegetables
Image .csv .xlsThe largest contributions to the decline in prices in the latest week were seen in bread and cereals (with a weekly price decrease of 0.6%) with the largest contribution being from dried potted snacks (minus 0.3 percentage points) and in vegetables (with a weekly price decrease of 0.3%), largely driven by price decreases in potato-based items such as crisps, potatoes and chips (together contributing 0.2 percentage points to the decrease).
These downward contributions were partially offset by an overall price increase for milk, cheese and eggs (that showed a weekly price increase of 0.5%), driven by an increase in the majority of items in this category, with the largest contributions being from mousse and yoghurt (contributing 0.4 percentage points) and cheese (contributing 0.1 percentage points).
The time series, weekly growth rates and contributions to the weekly changes for all individual food and drink items are published in a dataset alongside this release.
Figure 8 shows that the all-item index remains below the starting point of the series (1 June), with the overall index at 1.3% lower. Oils and fats have had the largest reduction in price since the series began, now 4% lower, along with bread and cereal, now 2.3% below, and other food products, now 2.2% below the starting point of the beginning of June. Wine has shown the largest increase since the series began, now 1.5% above the starting point of the beginning of June, although prices have fallen slightly in the latest week.
Figure 8: The all-item index has remained below its Week 1 level (1 June) for the entire time series
Online price change of selected food and drink products, UK, 1 June to 13 September 2020: index Week 1 (1 to 7 June) = 100
Source: Office for National Statistics – Faster indicators
Notes:
- Week 1 refers to the period 1 to 7 June 2020, and Week 15 refers to the period 7 September to 13 September.
- The time series for all individual food and drink items are published in a dataset alongside this release.
Download this chart Figure 8: The all-item index has remained below its Week 1 level (1 June) for the entire time series
Image .csv .xls7. Energy Performance Certificates
Energy Performance Certificates (EPCs) are used as a timely indicator for the number of completed constructions (new EPCs) and number of transactions (existing EPCs). More detailed statistics split by NUTS1 English region are published weekly by the Ministry of Housing, Communities and Local Government (MHCLG).
This release includes weekly EPCs data for new and existing domestic properties in England and Wales from 24 February 2019 up to the week beginning 7 September 2020. This section analyses the percentage change compared with the same week the previous year. For example, the latest week starting 7 September 2020 was compared with the week starting 9 September 2019. This is shown in Figure 9.
Figure 9: In the week starting 7 September, EPCs across England and Wales were 16% higher for existing dwellings and 3% lower for new dwellings than their levels the same week a year ago
Existing and new Energy Performance Certificate (EPC) lodgements for England and Wales combined, non-seasonally adjusted, year-on-year percentage change between EPCs on the same equivalent week in 2019, February to September 2020
Source: Ministry of Housing, Communities and Local Government – Domestic Energy Performance Certificate Register
Notes:
- Further notes and a regional breakdown are available in the weekly Energy Performance Certificates (EPCs) for domestic properties dataset (Excel, 61KB).
- More information on the EPC methods, strengths and limitations is available in the accompanying methodology article.
- In response to the coronavirus (COVID-19) pandemic, the UK government introduced social distancing measures for the property market from 26 March 2020. Restrictions were eased from 13 May 2020, allowing market activity in England to re-commence under restricted conditions. Further guidance is available.
Download this chart Figure 9: In the week starting 7 September, EPCs across England and Wales were 16% higher for existing dwellings and 3% lower for new dwellings than their levels the same week a year ago
Image .csv .xlsCompared with the same week in the previous year, EPC lodgements have returned to levels similar to those seen throughout June and July, with the volume of existing EPCs moderately higher than the same week last year and new EPCs slightly below. However, in absolute terms both existing and new EPCs were at their highest levels since 9 March.
With the exception of the previous week, the volume of existing EPCs was higher than the same week the previous year for every week since 8 June. This can be explained by lower than usual residential property transactions during March to June 2020 and a catch up in property transaction demand thereafter outlined by HM Revenue and Customs (HMRC) UK property transaction statistics (PDF, 336KB).
EPCs for new dwellings have seen a slower recovery relative to existing EPCs since May 2020, and their relative levels were still lower in the latest week. A reduction in construction would contribute to the delay in EPC assessments of new dwellings.
Back to table of contents8. Footfall
These figures are provided by Springboard, a provider of data on customer activity. They measure the volume of footfall compared with the same day the previous year at the overall level and across the categories of high streets, retail parks and shopping centres. For example, Tuesday 14 July 2020 was compared with Tuesday 16 July 2019.
In the week starting 7 September, average overall footfall fell to around 72% of its level the same day a year ago, from around 75% in the previous two weeks. The categories of high streets, shopping centres and retail parks all contributed to this decline, with footfall in each declining between one and three percentage points.
Figure 10: In the week starting 7 September, overall footfall fell slightly compared to the previous two weeks, driven by reduced footfall in all types of retail location
Volume of footfall, year-on-year percentage change between footfall on the same day, UK, 1 March to 13 September 2020

Source: Springboard and the Department for Business, Energy and Industrial Strategy
Notes:
- The spike on Monday 24 August was caused by the comparison with 26 August 2019 last year, which was bank holiday Monday with good weather. The bank holiday this year was a week later on 31 August.
- Many non-essential shops were allowed to open on 15 June 2020 in England, 12 June 2020 in Northern Ireland and 22 June 2020 in Wales. In Scotland, some non-essential shops were allowed to reopen from 29 June 2020 and more from 13 to 15 July 2020.
- “PM announcement” refers to the advisory announcement on 16 March 2020 to avoid non-essential travel, bars, restaurants and other indoor leisure venues, and to work from home if possible.
- Pubs were allowed to reopen on 4 July in both England and Northern Ireland, with beer gardens allowed to reopen on 6 July in Scotland and 13 July in Wales. Pubs were also allowed to reopen indoors in Scotland on 15 July.
Download this image Figure 10: In the week starting 7 September, overall footfall fell slightly compared to the previous two weeks, driven by reduced footfall in all types of retail location
.PNG (58.4 kB)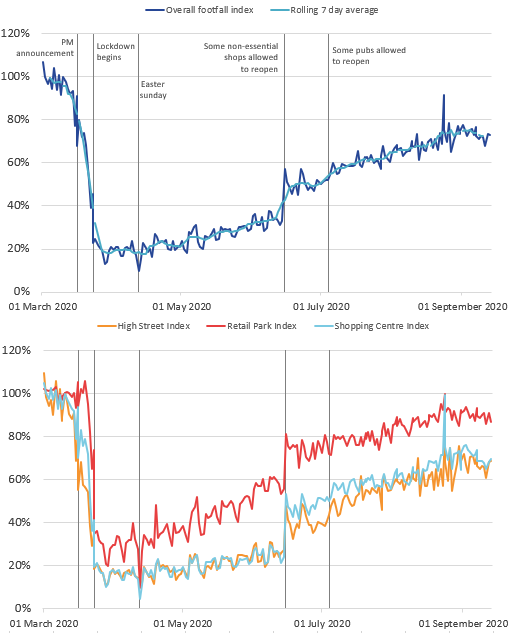
9. Roads and traffic camera data
Road traffic in Great Britain
The Department for Transport (DfT) produces daily road traffic estimates using data from around 275 automatic traffic count sites across Great Britain covering all road types, which are published weekly.
The daily DfT estimates are indexed to the first week of February and the comparison is to the same day of the week. The data provided are useful as an indication of traffic change rather than actual traffic volumes. More information on the methods, quality and economic analysis for these indicators can be found in the methodology article.
Figure 11: On Monday 14 September, all motor vehicle traffic was three percentage points below traffic seen in February, the highest recorded since the Prime Minister's announcement on Monday 16 March
Daily road traffic index: 100 = same traffic as the equivalent day of the week in the first week of February, 1 March to 14 September 2020, non-seasonally adjusted
Source: Department for Transport – Road traffic statistics: management information
Download this chart Figure 11: On Monday 14 September, all motor vehicle traffic was three percentage points below traffic seen in February, the highest recorded since the Prime Minister's announcement on Monday 16 March
Image .csv .xlsFigure 11 shows road traffic across all motor vehicles has continued to gradually return to levels seen in the first week of February 2020 following a lockdown low point around the end of March.
On Monday 14 September, heavy vehicle traffic was five percentage points higher than traffic seen on the equivalent Monday in the first week of February. Car traffic remained below the levels seen in the first week of February, but over the last few months it has increased from around 30 percentage points below February traffic levels to around 7 percentage points below.
Traffic camera activity
Traffic cameras are a valuable source for understanding the level of activity in towns and cities as well as changing patterns of mobility. The UK has thousands of publicly accessible traffic cameras with providers ranging from national agencies to local authorities. Further information on the methodology used to produce these data are available in our methodology article and Data Science Campus blog.
In the accompanying dataset, the following categories are available as non-seasonally adjusted, seasonally adjusted and trend data: cars, motorbikes (only available for London and the North East), buses, trucks, vans, pedestrians and cyclists. The categories are available for the following regions, which give a broad coverage across the UK and represent a range of different-sized settlements in urban and rural settings: Durham, London, Manchester, North East, Northern Ireland, Southend and Reading.
Figure 12: Between 7 and 13 September, counts of cars, pedestrians and cyclists in London were around 5% above the average level seen immediately pre-lockdown (11 to 22 March)
Activity in selected areas, daily counts of cars, buses, pedestrians and cyclists, seasonally adjusted, UK, March to September 2020
Embed code
Notes:
31 August was a bank holiday.
In this release, North East traffic data contains a higher than usual number of missing images and hence imputations, which is likely to lead to revisions in future weeks.
Traffic camera images capture the appearance of buses but they give no indication of the number of passengers using public transport.
Download the data
Average daily counts of cars, pedestrians and cyclists in the North East have remained around 95% above their average pre-lockdown level (an average of 1 to 22 March for the North East).
In Northern Ireland, although data collection did not start until 15 May 2020, the data continue to show a gradual increase in cars and pedestrians and cyclists. This trend is also observed across Manchester, Durham and Southend.
More categories and areas are available in the accompanying dataset. Comparison to DfT road traffic estimates is shown in the accompanying traffic camera methodology article, published on 3 September.
Highways England road traffic
Highways England (HE) data include monthly road traffic counts on English motorways and major “A” roads. The data are available up to July 2020, which is less timely than the DfT road traffic data but includes detailed road traffic for important roads serving 13 selected “major” ports, within a 10-kilometre radius of each port location. Average 15-minute road traffic counts and average speed data for around 10,000 sensors across English ports are published in the experimental dataset.
Figures 13 and 14 show HE road traffic with the selected ports having the highest number of cargo and tanker ships according to the shipping dataset. We expect large vehicles (those over 11.66 metres in length) such as lorries to be more closely related to the movement of goods than small vehicles (those of less than 5.2 metres in length). More information on the methods, quality and economic analysis for these indicators can be found in the article.
Figure 13: In July 2020, large vehicle road traffic across all 13 ports returned to around 95% of its level seen in both February 2020 and in July 2019
Average large vehicle port road traffic count per sensor per 15-minute observation in England, index February 2020 = 100, seasonally adjusted, January 2019 to July 2020
Source: Highways England – Road traffic sensor data
Download this chart Figure 13: In July 2020, large vehicle road traffic across all 13 ports returned to around 95% of its level seen in both February 2020 and in July 2019
Image .csv .xls
Figure 14: In July 2020, small vehicle road traffic across all 13 ports increased to around 80% of its level seen in both February 2020 and in July 2019
Average small vehicle port road traffic count per sensor per 15-minute observation in England, index February 2020 = 100, seasonally adjusted, January 2019 to July 2020
Source: Highways England – Road traffic sensor data
Notes:
- Monthly average road traffic counts and speed data are available by port in the dataset, along with non-seasonally adjusted aggregate series.
Download this chart Figure 14: In July 2020, small vehicle road traffic across all 13 ports increased to around 80% of its level seen in both February 2020 and in July 2019
Image .csv .xlsFigure 13 shows heavy vehicle road traffic in July 2020 was at 95% of its level in February 2020, which is consistent with daily road traffic from the DfT. The increase in heavy goods road traffic throughout April to July 2020 is consistent with more shipping visits across the same time period in the selected ports. Shipping visits in July 2020 were also around 95% of their July 2019 levels.
However, car traffic at major ports remained lower than expected during July 2020 compared with this time last year, though it has continued to increase since April 2020 to around 80% of its February 2020 levels. This pattern is also shown in the DfT road traffic data (Figure 11) and the car traffic camera activity in London (Figure 12).
Back to table of contents10. Shipping
These shipping indicators are based on counts of all vessels and cargo and tanker vessels. As discussed in Faster indicators of UK economic activity: shipping, we expect the shipping indicators to be related to the import and export of goods.
The time series of daily and weekly passenger visits have been temporarily suspended because of quality concerns. We are investigating, and we hope to reinstate these series in future releases.
Figure 15: Between 7 and 13 September, the average volume of daily ship visits was 324, compared with an average of 377 in the week immediately before lockdown (16 to 22 March)
Daily movements in shipping visits, UK, seasonally adjusted, 1 January to 13 September 2020
Source: exactEarth
Download this chart Figure 15: Between 7 and 13 September, the average volume of daily ship visits was 324, compared with an average of 377 in the week immediately before lockdown (16 to 22 March)
Image .csv .xls
Figure 16: Between 7 and 13 September, the average daily volume of visits for cargo ships was 100 ships a day, compared with an average of 126 in the week immediately before lockdown (16 to 22 March)
Daily movements in shipping visits, UK, seasonally adjusted, 1 January to 13 September 2020
Source: exactEarth
Notes:
- The number of visits for Hull are included in these data from 1 June 2020 onwards.
- The seasonally adjusted and trend estimates are estimated using a modified version of the seasonal adjustment method TRAMO-SEATS. More information is available in the Coronavirus and the latest indicators for the UK economy and society methodology.
- The seasonal adjustment method may be limited as this is a short time series.
- Daily and weekly shipping visits and unique visits are available by port in the dataset, along with non-seasonally adjusted aggregate series.
Download this chart Figure 16: Between 7 and 13 September, the average daily volume of visits for cargo ships was 100 ships a day, compared with an average of 126 in the week immediately before lockdown (16 to 22 March)
Image .csv .xls11. Data
Weekly and daily shipping indicators
Dataset | Released 17 September 2020
The weekly and daily shipping indicators dataset associated with the faster indicators of UK economic activity.
Online job advert estimates
Dataset | Released 17 September 2020
Experimental job advert indices covering the UK job market.
Traffic camera activity
Dataset | Released 17 September 2020
Experimental dataset for busyness indices covering the UK.
Economic activity, faster indicators, UK
Dataset | Released 17 September 2020
Data on road traffic and Value Added Tax (VAT) data from HM Revenue and Customs (HMRC).
Online weekly price changes
Dataset | Released 17 September 2020
The online price changes for a selection of food and drink products from several large UK retailers. These data are experimental estimates developed to deliver timely indicators to help understand the impact of the coronavirus (COVID-19) pandemic.
12. Glossary
Company incorporations
Incorporations are when a company is added to the Companies House register of limited companies. This can also include where an existing business applies to become a limited company, where it was not one before.
Faster indicator
A faster indicator provides insights into economic activity using close-to-real-time big data, administrative data sources, rapid response surveys or Experimental Statistics, which represent useful economic and social concepts.
Voluntary dissolution applications
A voluntary dissolution application is when a company applies to begin dissolution proceedings. As such, they effectively chose to be removed from the Companies House register. For a company to be eligible to voluntarily dissolve, it should not have completed any trading activity for a period of three months.
Back to table of contents13. Measuring the data
Detailed information on the data sources, quality and methodology of the different indicators included in this bulletin is available in the Coronavirus and the latest indicators of the UK economy and society methodology.
We will summarise any crucial updates to the quality or methodology in this section in the future.
Back to table of contents14. Strengths and limitations
Detailed information on the strengths and limitations of the different indicators included in this bulletin is available in the Coronavirus and the latest indicators of the UK economy and society methodology.
We will summarise any crucial updates or warnings in this section in the future.
Back to table of contents
3. Social impacts of the coronavirus on Great Britain
This section includes some headline results from Wave 24 of the Opinions and Lifestyle Survey (OPN) covering the period 9 to 13 September 2020. The full results will be published in Coronavirus and the social impacts on Great Britain on 18 September 2020. Note that the OPN was not included in the previous week, so there is a two-week gap between Wave 23 and Wave 24.
Figure 2 shows that the proportion of adults travelling to work rose above 60% for the first time since the survey began, to 62%. The proportion working from home remained at 20% for the second consecutive week, with the proportion of working adults not working from home or travelling to work reducing from 23% to 18%, suggesting more people are returning to work. The proportion of adults shopping for necessities increased to 74%, a level not seen since June. The proportion shopping for other things remained relatively steady at 23%.
The proportion of adults who had used a face covering in the previous week when leaving home remained at or above 95% for the fifth consecutive week. Further breakdowns such as the situations when a face covering was worn (for example, while shopping) and by the constituent countries of Great Britain will be available in Coronavirus and the social impacts on Great Britain published on 18 September 2020.
Figure 2: The proportion of adults travelling to work rose above 60% for the first time, to 62%
Proportion of adults, Great Britain, 14 May to 13 September 2020
Source: Office for National Statistics – Opinions and Lifestyle Survey
Notes:
Download this chart Figure 2: The proportion of adults travelling to work rose above 60% for the first time, to 62%
Image .csv .xls