Table of contents
- Main findings
- Things you need to know
- The most common cancers registered were breast, prostate, lung, and colorectal cancers
- Rare cancers
- Cancer diagnoses increase with age
- Cancer incidence is highest in the north of England and lowest in London
- Cancer incidence increase while cancer-related deaths decrease
- What statistics do we calculate?
- Data quality
- References
- Background notes
- Methodology
1. Main findings
The number of new cancer registrations in England was 296,863 in 2014; an increase of 4,183 registrations from the same point in 20131.
More cancers were registered in males (150,832) than females (146,031). Across the majority of cancer sites more males are diagnosed with cancer than females. This is a persistent feature of the data, reported in previous registration years1.
The age-standardised incidence rates for newly diagnosed cancers were 670.8 per 100,000 males and 546.1 per 100,000 females. The rate takes into account the different age structures between males and females.
Breast (15.6%), prostate (13.4%), lung (12.6%) and colorectal (11.5%) cancer continue to account for over half of the malignant cancer registrations in England for all ages combined.
Cancer is a disease of the elderly, as approximately 12% of the population are aged 70 and above and account for 50.2% of the total cancers registered in 2014.
Generally, the cancer incidence rates increase over time, while mortality rates decrease, reflecting the general increase in cancer survival as reported in the latest cancer survival estimates2.
Back to table of contents2. Things you need to know
Cancer registrations in England can take up to 5 years after the end of a given calendar year to reach 100% completeness, due to the continuing accrual of late registrations. Therefore, published figures for 2014 are likely to increase in future publications when late registrations are included. These refreshed data are shown in our time series (Tables 8 and 9).
Back to table of contents3. The most common cancers registered were breast, prostate, lung, and colorectal cancers
By most common we mean the 4 cancers with the greatest number of cases registered in England in 2014 (Figure 1).
Figure 1: The number of cancer registrations by the 24 major sites, England, 2014
Source: Office for National Statistics
Notes:
- The International Classification of Diseases Tenth Revision (ICD-10) was used to classify cancer sites. Non-melanoma skin cancers (ICD-10 C44) were excluded.
- All ages combined.
Download this chart Figure 1: The number of cancer registrations by the 24 major sites, England, 2014
Image .csv .xlsBreast cancer was the most common cancer diagnosed with 46,417 cases registered in 2014; 46,085 of which were registered to females, accounting for 31.6% of total female cancer registrations. The age-standardised incidence rate for breast cancer has increased from 163.6 per 100,000 in 2005 to 173.4 per 100,000 in 2014.
Prostate cancer was the most common cancer diagnosed in males (all ages combined) in 2014 with 39,741 cases registered, which accounted for 26.3% of total male cancer registrations. The age-standardised cancer incidence rate for prostate cancer was 177.8 cases per 100,000 males. In comparison with 2005 (166.5 cases per 100,000 males), the age-standardised rate for prostate cancer has increased in the last 10 years by 6.8%.
The second most common cancer for both males and females was lung cancer. In 2014, there were 37,453 (20,127 males and 17,326 females) cases of lung cancer registered in England. Lung cancer accounted for 13.3% (males) and 11.9% (females) of the total cancer registrations. The age-standardised lung cancer incidence rate was 40.5% higher in males than in females; 91.6 per 100,000 males were registered in 2014, and 65.2 per 100,000 females. In comparison with 10 years ago (2005) the age-standardised rate for lung cancer has decreased by 9.1% for males and increased by 15.2% for females. During the early 1970s to 1980s, smoking prevalence fell among males and increased among females. Recent figures suggest that 80% of deaths from trachea, lung and bronchus cancer were attributed to smoking3.
In England there were 18,789 and 15,236 cases (total: 34,025) of colorectal cancer registered in 2014 for males and females respectively. Colorectal cancer accounted for 12.5% (males) and 10.4% (females) of the total cancer registrations. In 2014, there were 84.5 cases per 100,000 males diagnosed with colorectal cancer, and 56.4 per 100,000 females. The age-standardised colorectal cancer incidence rate was 49.8% higher for males than females.
Back to table of contents4. Rare cancers
The organisation Rare Cancers Europe4 defines rare cancers as fewer than 6 cases per 100,000 population. A cancer can be rare due to the part of the body that is affected or due to the type of cancer or treatment needed. While grouping cancer sites can affect whether a cancer is common or rare (such as grouping bronchus, trachea and lung), identifying single cancer sites using the 6 per 100,000 definition can be useful to select cancers for analysis; especially since “epidemiologic information on rare cancers is scarce”, as stated by the European Journal for Cancer5.
Excluding sex-specific parts of the body, cancers that are rare for males are generally rare for females. Some of the rarer types, affecting 0.1 per 100,000 males (and the same for females) include cancers of the trachea, peripheral nerves and nervous system, and the meninges.
However, using the 6 per 100,000 definition, there are 3 types of rare cancers that affect males and females differently: cancers of the larynx, mesothelioma and thyroid. These cancers, while they are not sex-specific, affect males and females differently, as shown in Figure 2. The 6 per 100,000 rare cancer definition shows how cancers that are rare for one sex may not be for the other as the number of diagnoses per 100,000 is greater than 6.
Figure 2: Directly age-standardised rates per 100,000 population of selected rare cancers (third digit): site and sex, England, 2014
Source: Office for National Statistics
Notes:
- Rare cancers were identified using the 6 per 100,000 population definition using a crude average of the male and female age standardised rate.
Download this chart Figure 2: Directly age-standardised rates per 100,000 population of selected rare cancers (third digit): site and sex, England, 2014
Image .csv .xlsIn 2014, cancer of the larynx was more common for males with an incidence of 6.7 per 100,000 in comparison with females at 1.2 per 100,000.
Lifestyle factors such as smoking and drinking alcohol can increase the risk of cancers above the vocal chords and contribute to the differences between males and females. According to the Health and Social Care Information Centre (HSCIC)3, the proportion of total hospital admissions attributable to smoking are greater amongst males at 6%, in comparison with females at 3%. In addition, 79% of admissions for cancer of the larynx were attributed to smoking.
Cancer Research UK6 state that heavy drinkers are 3 times more likely to get cancer of the larynx than non-drinkers and smokers increase their risk of getting the disease even if they are not heavy drinkers. They state that around 80% of cancers of the larynx can be prevented with a healthier lifestyle7. Further data from HSCIC8 indicates that men drink more, as 67% of men were more likely to have drunk in the last week in comparison with 53% of women and 18% of men and 10% of women drank on 5 or more days in the week.
For mesothelioma, the male incidence rate at 9 per 100,000 was 6 times higher than females at 1.5 per 100,000. Due to these differences, this cancer fell into the rare category for females, but is more common in males. This is likely to be due to men breathing in hazardous asbestos fibres, whilst working in the construction 9 industry. This exposure put them at a higher risk of developing the disease than women. For this reason, asbestos was banned in the UK in 1999; however, we still find cases diagnosed with mesothelioma in later years as the disease can take around 30 to 40 years before symptoms appear10.
In contrast, malignant neoplasm of the thyroid gland was more commonly diagnosed in females, at an incidence of 7.9 per 100,000 in comparison with 3.4 per 100,000 males. The difference in rates between the sexes makes this cancer rare for males but not for females. There are many factors which put people at a higher risk of the disease, including exposure to radiation and diabetes. It has also been suggested that hormones experienced in women of reproductive age puts them at a higher risk, helping to provide some explanation for the differences seen between males and females11.
Back to table of contents5. Cancer diagnoses increase with age
The majority of cancer cases are registered in the older age groups. Cancer occurring in children, teenagers, and young adults (aged 0 to 24) accounted for 1.1% of the total cancer registrations, whereas registrations for those aged 70 and above accounted for 50.2% of the total registrations. Figure 3 shows the age-specific cancer incidence rate noticeably increasing with age (up until age group 90 and over, where it decreases), demonstrating that cancer is mainly a disease of the elderly.
There are differences between the sexes across the age groups. From the 20 to 24 age group up to the 55 to 59 age group, rates of cancer were higher in females than in males, and in the 40 to 44 age group, the rate for females was more than double that for males. Much of this difference is due to the high incidence of breast cancer among females in these age groups: in 2014 breast cancer accounted for 43.4% cancers among females aged 20 to 59. Rates of cancer were higher in males than females from the 60 to 64 age group onwards: prostate cancer accounted for 35% of all malignant cancers among males aged 65 to 69.
Figure 3: Age specific cancer incidence rates (per 100,000 people) in 2014, England
Source: Office for National Statistics
Notes:
- Excluding non-melanoma skin cancer (ICD-10 C44).
Download this chart Figure 3: Age specific cancer incidence rates (per 100,000 people) in 2014, England
Image .csv .xls6. Cancer incidence is highest in the north of England and lowest in London
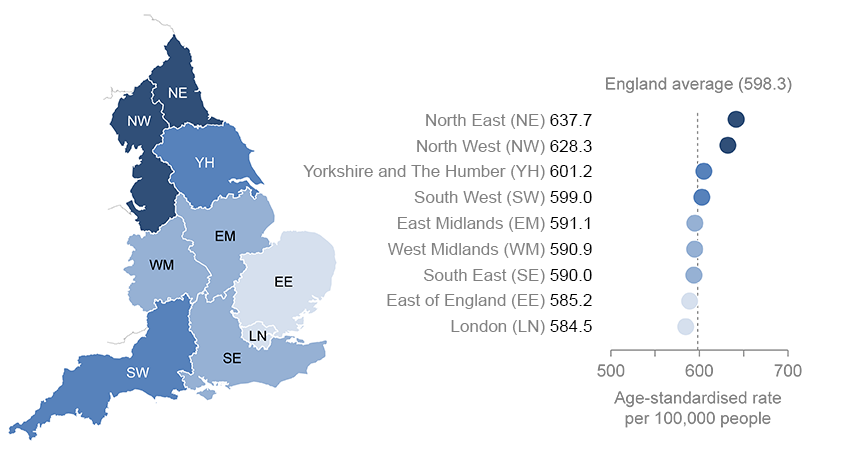
Figure 4: Age-standardised incidence rate (per 100,000 people) by English regions, all cancers, all persons, 2014
Source: Office for National Statistics
Notes:
- Excluding non-melanoma skin cancer (ICD-10 C44).
- All persons combined. Separate age-standardised rates for males and females can be found in the reference table provided.
Download this image Figure 4: Age-standardised incidence rate (per 100,000 people) by English regions, all cancers, all persons, 2014
.png (75.3 kB) .xls (27.6 kB)
The age-standardised cancer incidence rate in 2014 varied across the English regions. For all persons the rate ranged from 584.5 (London) to 637.7 (North East) per 100,000 people, and the average in England was 598.3 per 100,000 (as shown in Figure 4). The age-standardised cancer incidence rate was 9.1% higher in the North East compared with London.
When looking at the age-standardised rate, the regional variations differ by specific cancers, for example:
for prostate cancer, the East of England had the highest rate, at 194.2 per 100,000 males - this was followed by London with 191 per 100,000 males; in contrast, the North East had the lowest rate at 152.4 per 100,000 males
the colorectal incidence rate for males in the North East was 23.8% higher than for males in London, but only 3.6% higher for females; the incidence rate for females was highest in the South West and lowest in Yorkshire and The Humber
lung cancer showed the greatest variation between the North and South regions with 123.6 per 100,000 males and 100.4 per 100,000 females diagnosed in the North East in comparison with 77.8 per 100,000 males and 53.3 per 100,000 females in the South East; the North East is 58.9% and 88.4% higher for males and females respectively
It is important to note that caution should be taken when interpreting regional variations, the differences might be due to a number of influencing factors rather than being a true difference in cancer incidence. One reason might be the variation between regions in deprivation; high levels of deprivation have been associated with higher levels of certain types of cancer12 in addition to differences in lifestyle behaviours between regions, such as the regional variance in smoking prevalence13. Furthermore, factors should be considered like prostate-specific antigen testing which is not a national screening programme. Any regional differences in the availability and uptake of this test may contribute to regional differences in the age-standardised rate.
Back to table of contents7. Cancer incidence increase while cancer-related deaths decrease
Generally, over time, cancer incidence rates have increased, due partly to advances in screening and diagnoses. Advances in medicine have resulted in early detection of cancers, increasing the detection of cancer while reducing the number of people dying from the disease. Therefore, cancer mortality rates have generally decreased over time, despite the increase in cancer incidence. England’s cancer survival estimates2 are increasing over time as a result. The England cancer mortality is a sub set taken from the Deaths Registered in England and Wales: 2014 (DR Series)14.
As shown in Figure 5, the gap between incidence and death from cancer, for all cancers combined, widens in later years.
Figure 5: Directly age-standardised rates per 100,000 population of newly diagnosed cases of cancer and deaths from cancer: by sex, England, 1995 to 2014
Source: Office for National Statistics
Notes:
- The International Classification of Diseases Tenth Revision (ICD-10) was used to classify cancer sites for incidence data for all years.
- Mortality rates for years 1995 to 2000 inclusive have been mapped from The International Classification of Diseases Ninth Revision (ICD-09).
- Excluding non-melanoma skin cancer (ICD-10 C44).
- All ages combined.
Download this chart Figure 5: Directly age-standardised rates per 100,000 population of newly diagnosed cases of cancer and deaths from cancer: by sex, England, 1995 to 2014
Image .csv .xlsIn 1995, the cancer mortality rates were higher for both males and females at 427.8 and 268.4 (per 100,000) respectively, and fell to 332.7 per 100,000 males and 228.4 per 100,000 females in 2014. There is a rising trend in the number of cancer diagnoses and a positive trend in survival for the majority of cancers.
For the most common cancers in males and females (male prostate and female breast), the increase in the number of diagnosed cancers contrasts with the decreasing mortality trend, indicating that the number of patients surviving from these cancers continues to improve (Figure 6). For example, while newly diagnosed prostate and breast cancers are on the rise, partly due to screening, the mortality for these cancers are far lower and decreasing. Early detection and diagnoses of these cancers leads to quicker treatment resulting in improved survival.
Figure 6: Directly age-standardised rates per 100,000 population of newly diagnosed cases of cancer and deaths from cancer: for breast (females) and prostate (males), England, 1995 to 2014
Source: Office for National Statistics
Download this chart Figure 6: Directly age-standardised rates per 100,000 population of newly diagnosed cases of cancer and deaths from cancer: for breast (females) and prostate (males), England, 1995 to 2014
Image .csv .xlsFor lung and colorectal cancers, the incidence is less common than that of breast (female) and prostate (males) (Figure 7).
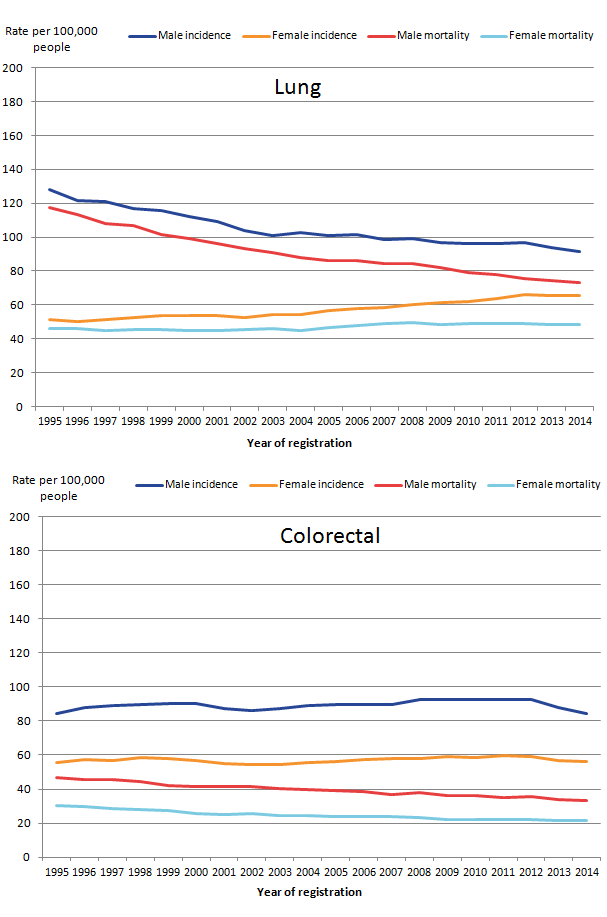
Figure 7: Directly age-standardised rates per 100,000 population of newly diagnosed cases of cancer and deaths from cancer: for lung and colorectal, by sex, England, 1995 to 2014
Source: Office for National Statistics
Notes:
- The International Classification of Diseases Tenth Revision (ICD-10) was used to classify cancer sites for incidence data for all years.
- Mortality rates for years 1995 to 2000 inclusive have been mapped from The International Classification of Diseases Ninth Revision (ICD-09).
- All ages combined.
Download this image Figure 7: Directly age-standardised rates per 100,000 population of newly diagnosed cases of cancer and deaths from cancer: for lung and colorectal, by sex, England, 1995 to 2014
.png (29.3 kB) .xls (65.5 kB)
Lung cancer shows a contrasting trend over the years for males and females. The incidence rate for males decreased from 127.9 diagnoses per 100,000 in 1995 to 91.6 diagnoses per 100,000 in 2014. Mortality rates decrease alongside incidences for males and drop by 37.8% from 117.2 per 100,000 in 1995 to 72.9 per 100,000 in 2014.
In contrast, lung cancer incidence for females has increased by 26.8% over the years from 51.4 diagnoses per 100,000 in 1995 to 65.2 diagnoses per 100,000 in 2014. Mortality rates for females remain fairly consistent since 1995 with only a slight increase of 5.4% to 2014.
Colorectal incidence and mortality rates remain relatively consistent over the years for both males and females. Incidences show little change from 1995, while there is a general decrease in mortality from colorectal over the years.
Back to table of contents8. What statistics do we calculate?
Cancer incidence rate:
the number of new cancer registrations in a specific population during a particular time period per 100,000 people. Or:
Cancer incidence rate = (total number of cancer registrations/total population) x 100,000
A cancer incidence rate can be calculated by specific age groups, this is referred to as an age-specific cancer incidence rate. We calculate cancer incidence rates for ICD-10 codes C00 to C97 and D00 to D48, all of which can be found in the reference table provided.
Age-standardised cancer incidence rate:
a weighted average of the age-specific cancer incidence rates, the weights used are age-specific proportions of a standardised population (2013 European Standard Population (ESP)). By standardising cancer incidence rates with the ESP geographical and time comparisons can be made, as the differing age structure of a particular population has been accounted for.
Also included in our reference tables are the following:
Mortality to incidence ratios:
cancer mortality to incidence ratios, are calculated by dividing the number of cancer related deaths by the number of cancer diagnoses for each given cancer site, sex and region. It is important to note that the number of cancer related deaths might include people who were diagnosed before 2014; therefore caution should be made when interpreting these statistics.
Standardised registration ratio (SRR): a cancer incidence rate (age and sex specific) is taken as a standard rate; we take England as the standard. The standard rate is then applied to another index population of known age structure (for example the South West region of England) to calculate how many registrations would have been expected in this index population had they, at each age group, experienced the standard cancer incidence rate (in this example England). The “expected” incidence is then compared with the observed incidence rate in the index population (in this example the South West), with the ratio being multiplied by 100 to give the standardised registration ratio, in which 100 is the value for the standard rate (in this example England). A SRR of 106 would mean the cancer incidence in the index region (in this example the South West) is 6% higher than the standard rate (England). Conversely, an SRR of 94 would mean the cancer incidence was 6% lower.
Cancer registration data collection in England
Cancer registrations in England are submitted to us by the National Cancer Registration and Analysis Service (NCRAS) in Public Health England. The registration of cancer cases is a dynamic process where the data files, both at NCRAS and at ONS, are always open and changing. Cancer data files are dynamic in a number of ways:
- new cancer cases will be registered; this can include new “late” registrations, where a case is registered after the cancer registry or ONS, or both, have published for a particular year
- cancer records can be amended: for example, the site code of a record would be modified if later more accurate information becomes available
- cancer records can be cancelled, although this is unusual
Data are submitted to the NCRAS from a range of health care providers and other services (for example, pathology laboratories). As the data come from different sources, the quality and accuracy of the data submitted may vary.
The NCRAS carefully collate and validate all the data for each patient, before sending a subset of the data, defined as the cancer registration minimum dataset, to the National Cancer Registry at ONS for further validation and processing. The extensive checks run by us include the compatibility of the cancer site and the associated histology, and are closely based on those promoted by the International Agency for Research on Cancer.
Once all the expected records for any one incidence year have been received and validated we take a snapshot of the dataset, which allows us to publish the numbers and rates of all types of cancer by age and sex, and by region of residence. Cancer incidence tables for this release were created in April 2016. It is important to remember that the snapshot of cancer registration data will be different year on year due to the dynamic nature of the dataset. Therefore, you will find that the incidence count for 2013 (for example) differs in the current publication compared with the previous publication.
Taking a new snapshot of the dynamic National Cancer Registry database usually results in a difference between what was previously published and what is published from this snapshot data-set. The balance between ensuring completeness of the data but publishing cancer incidence figures in a timely manner is necessarily a compromise. The gap between what was first published for a registration year and the most recent cancer incidence figures has varied considerably over time, as shown in Figure 7. Over the 42-year period reported, differences between what has been previously published and the current number (refreshed in 2016) of registrations for each year average less than 5%.
Figure 8: Number of cancer registrations previously published in the annual report (MB1 series) and currently on the ONS National Cancer Registry database, England, 1971 to 2013
Source: Office for National Statistics
Notes:
- Figures for 1971 to 1994 have been extracted from the “frozen” historical data set.
- The published figures for 1971 to 1978 correspond to all malignancies, not all registrations. From 1979 the numbers refer to all malignant and benign cancer registrations including non-melanoma skin cancer (C44).
- Successful work has been completed to code a backlog of cases for non-melanoma skin cancer (C44) since 2013, which will show an increase in the published data in 2014.
- Refreshed figures at April 2016. Previously published figures are taken from the corresponding cancer registration report. For example, figures for 2013 were taken from the report published in July 2015.
Download this chart Figure 8: Number of cancer registrations previously published in the annual report (MB1 series) and currently on the ONS National Cancer Registry database, England, 1971 to 2013
Image .csv .xls9. Data quality
The figures for numbers and rates of “all cancers” in this release refer to all invasive malignant neoplasms (ICD-10 C00 to C97), excluding non-melanoma skin cancer (ICD-10 C44). Although non-melanoma skin cancer (NMSC) is very common the available figures are known to be under-estimates and unreliable for comparison purposes. This is because the policies and practices for the recording of NMSC have varied among the cancer registries. Therefore NMSC registrations have been excluded from the figures for “all cancers” in this publication.
Known data quality matters this year include the following:
- 2014 saw a reversal in the previous rising trend in the overall number of all invasive cancers (excluding NMSC) with a slight fall. This fall is driven mostly by a dip in the number of prostate cancers. Investigations into this suggest that it is not that the 2014 figure is surprisingly low, but that the 2013 figure was surprisingly high. This may be in part due to potential over registration in 2013
- there was a large percentage increase from 2012 to 2013 in the number of registrations of cervix in situ (D06) for a particular age-group (20 to 24). Certain historical factors have influenced past trends, such as the change in age for cervical screening from 20 to 25 after the ACCS recommendation in 2003. A recent initiative to invite women for screening 6 months before their 25th birthday may have encouraged an increase in 24 year olds being screened before they turn 25. The increase in the 20 to 24 agegroup is likely to have been driven by the change in policy surrounding screening
- successful work has been completed to code a backlog of cases for non-melanoma skin cancer (C44). This has improved data quality due to the completeness of records to provide accurate counts of the number of diagnoses for this cancer (see Figure 7)
- any regional differences in benign, uncertain and unknown neoplasms should be interpreted with caution as there is known historic variation in the way cancer registries recorded these tumours across the country, and they do not receive as much analytical attention and scrutiny as the invasive cancers
Further details about the cancer registration data can be found in the Cancer Registration Statistics Quality and Methodology Information report15, and in previous annual publications1.
Users and uses of cancer statistics
Main users of cancer registration statistics include:
- Department of Health
- academics and researchers
- cancer charities
- cancer registries
- other government organisations and our own researchers
- the media
- general public
The main uses of cancer registration statistics include:
- providing an evidence base to inform cancer policy and programmes
- informing cancer research
- feeding into cancer information leaflets, web pages, campaigns to raise cancer awareness
- we use the data to produce National Statistics on cancer incidence and survival
- briefing parliamentary ministers
- providing answers to parliamentary questions
- providing bespoke tables for customers
Policy context
Cancer incidence (number of cancer cases registered) data allow policy makers to measure the extent of cancer within the population in England. Cancer incidence data is used alongside cancer prevalence, mortality and survival to allow policy makers to ascertain the burden of cancer in England.
Cancer incidence data directly helps to form policy on the prevention of cancer. It is also important in calculating cancer survival (in conjunction with mortality data) which is then used to determine a number of policy streams within government and also monitor a number of performance indicators for the English health care system. The indicators set for the NHS Outcomes Framework16 include 1- and 5-year cancer survival indicators for all cancers combined and for colorectal, breast and lung cancers combined. These survival estimates are calculated from the cancer incidence data.
Back to table of contents10. References
Office for National Statistics (2015) Cancer Registration Statistics: England Statistical Bulletins: (Accessed May 2016)
Office for National Statistics (2015) Cancer Survival in England - Adults diagnosed: 2009 to 2013, followed up to 2014: (Accessed May 2016)
Health and Social Care Information (2015) Statistics on Smoking: England 2015: (Accessed May 2016)
Rare Cancers Europe (2016) About Rare Cancers: (Accessed April 2016)
European Journal for Cancer (2011) Rare cancers are not so rare: The rare cancer burden in Europe: (Accessed May 2016)
Cancer research UK (2014) What is a rare cancer?: (Accessed April 2016)
Cancer research UK. (2014) Risks and causes of laryngeal cancer: (Accessed April 2016)
Health and Social Care Information (2015) Statistics on Alcohol: England 2015: (Accessed May 2016)
Office for National Statistics (2013) 170 years of industrial change across England and Wales: (Accessed May 2016)
Health and Safety Executive. (2014) Mesothelioma in Great Britain 2014: (Accessed May 2016)
Cancer research UK. (2014) Thyroid cancer risks and causes: (Accessed April 2016)
National Cancer Intelligence Network (2008). Cancer Incidence by Deprivation, England, 1995-2004: (Accessed June 2015)
Parkin DM, Boyd L, and Walker LC. (2011) 16. The fraction of cancer attributable to lifestyle and environmental factors in the UK in 2010. Summary and conclusions, British Journal of Cancer 105 (S2), S77-S81. (Accessed June 2015)
Office for National Statistics (2016) Deaths Registered in England and Wales: 2014 (DR Series): (Accessed May 2016)
Office for National Statistics. Cancer Registration Statistics Quality and Methodology Information: (Accessed May 2016)
NHS Outcomes Framework 2013 to 2014 – focus on measuring health outcomes (Accessed June 2015).
The impact of using the 2013 European Standard Population to calculate mortality and cancer incidence rates. (Accessed June 2015)