Table of contents
- Main points
- Summary
- All-cancers combined survival index
- Breast, colorectal and lung cancer: 1-year survival
- Interpreting the survival estimates in this bulletin
- How to interpret a funnel plot
- Who uses these statistics and what for?
- Policy context
- Annex A: Funnel plots
- Acknowledgments
- References
- Authors
- Background notes
1. Main points
The 1-year cancer survival index for England increased steadily from 60.1% for patients diagnosed in 1998 to 70.2% in 2013.
The 1-year cancer survival index increased steadily in most Clinical Commissioning Groups (CCGs) throughout that period. In 2013, the survival index ranged from 63.9% to 74.5%, compared with 52.0% to 64.7% in 1998.
The inequality in cancer survival between the highest and lowest CCG in England has shrunk since 1998 .
In 2013, 1-year age-standardised breast cancer survival in England was 96.7%, increasing from 92.0% for patients in 1998. For all the CCGs, in 2013, the difference between the highest survival estimate (98.6%) and the lowest (93.2%) was 5.4 percentage points.
In England, 1-year survival (age-sex-standardised) for patients diagnosed with colorectal cancer has steadily increased from 68.3% in 1998 to 77.7% in 2013. Among the 209 CCGs, the difference between the highest 1-year survival estimate in 2013 (85.3%) and the lowest (68.2%) was 17.1 percentage points.
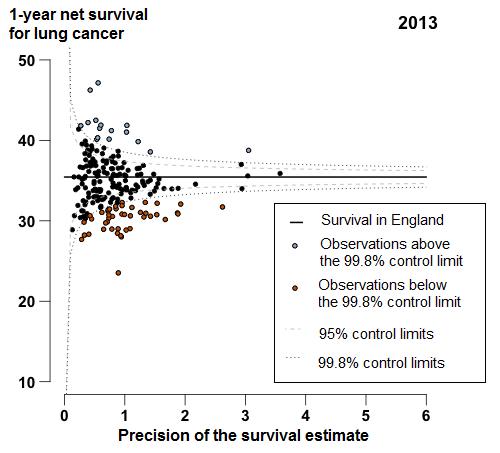
In England, 1-year age-sex-standardised survival for patients diagnosed with lung cancer increased from 23.1% in 1998 to 35.4% in 2013. In 2013, for all the CCGs, the difference between the highest survival estimate (47.1%) and the lowest (23.5%) was 23.6 percentage points.
Back to table of contents2. Summary
This bulletin focuses on trends in the 1-year survival index for all cancers combined for each of the 209 Clinical Commissioning Groups (CCGs) and for England as a whole. Separate 1-year survival estimates for breast (women), colorectal (bowel) and lung cancer are being introduced into this bulletin at CCG level for the first time. These estimates are age-standardised for breast cancer and age-sex-standardised for colorectal and lung cancers. Net survival (Background note 1 ) is estimated for adults (aged 15 to 99 years) who were diagnosed with cancer between 1998 and 2013 and followed up to 31 December 2014.
We provide a guide to interpreting the "all-cancers combined survival index" and "three-cancer combined survival index" and the age-sex-standardised survival estimates for breast, colorectal, and lung cancer in the section “Interpreting the survival estimates in this bulletin”.
Although not commented on in the bulletin, reference tables also contain trends in the 1-year survival index for three-cancers combined (breast (women), colorectal (bowel) and lung: the “three-cancer survival index”) for each CCG and England as a whole. These tables contain estimates for the all-cancers combined survival index and for England at 1 and 5 years after diagnosis and for CCGs at 1 year after diagnosis. We also present values of the all-cancers combined survival index and the three-cancer survival index separately for middle-aged and elderly adults (55 to 64 years and 75 to 99 years).
Confidence intervals (at the 95% level) are provided for each survival estimate in the reference tables . Survival is estimated using flexible parametric models (Background note 8 ). More information about methodology and quality information can be found in the “Background notes” section and in the Quality and Methodology Information paper.
Collaboration
This publication is produced in partnership with the Cancer Research UK Cancer Survival Group at the London School of Hygiene & Tropical Medicine.
London School of Hygiene and Tropical Medicine

Download this image London School of Hygiene and Tropical Medicine
.gif (12.4 kB)3. All-cancers combined survival index
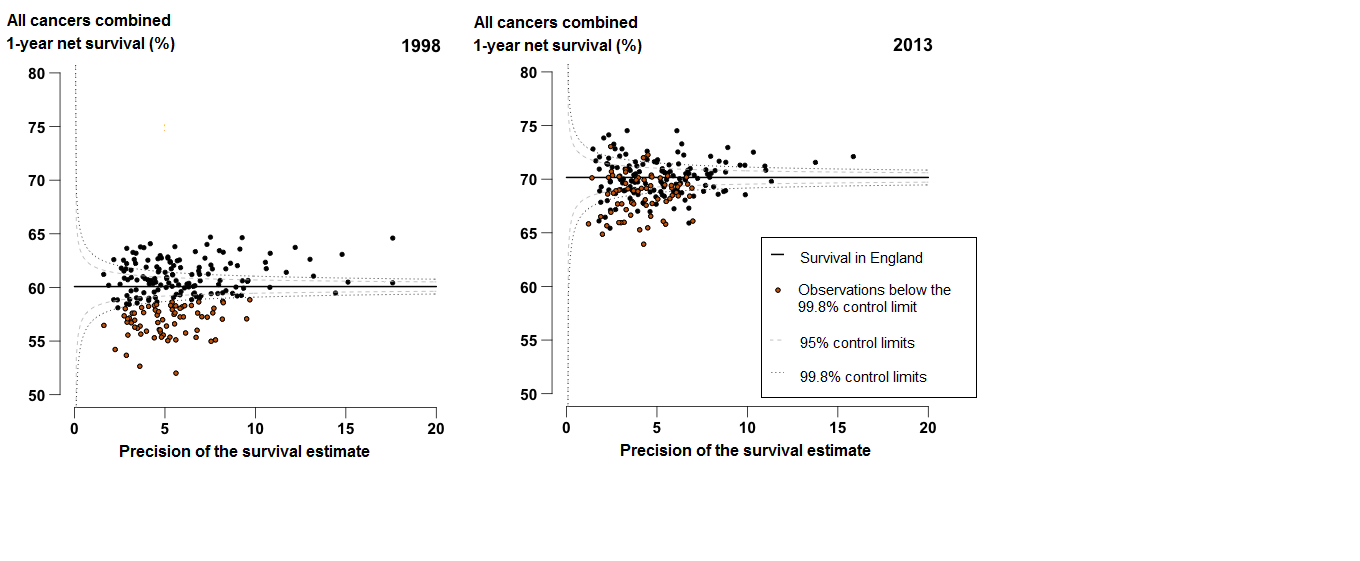
1-year survival for the all-cancers combined survival index in England increased from 60.1% in 1998 to 70.2% in 2013. The index increased steadily for Clinical Commissioning Groups (CCGs) throughout that period. In 2013, the survival index ranged from 63.9% (NHS Newham CCG) to 74.5% (NHS Harrow CCG and NHS Barnet CCG), compared with 52.0% (NHS Newham CCG) to 64.7% (NHS Leeds North CCG) in 1998 (Figure 1).
The difference between the highest and lowest values of the 1-year survival index for CCGs has lessened slightly, from 12.7% in 1998 to 10.6% in 2013. As a result, the values of the survival index for CCGs cluster more closely around the England average in 2013 than in 1998 (Figure 1). The survival index for every CCG in 2013 is now higher than the overall value for England (60.1%) in 1998.
In general, the largest increases between 1998 and 2013 were in areas where survival was lower in 1998. For example, 1-year survival in NHS Newham CCG (lowest estimate in 1998) increased by 11.9 percentage points between 1998 and 2013, and by 7.6 percentage points in NHS Leeds North CCG (highest estimate in 1998).
Figure 1: Funnel plot of the 1-year survival index (per cent) for all cancers combined, for Clinical Commissioning Groups (CCG): England, adults (aged 15 to 99) diagnosed in 1998 and in 2013
Source: Office for National Statistics, London School of Hygiene & Tropical Medicine
Notes:
- Each data point represents a single CCG. The higher the precision, the more reliable the survival estimate. More information on how to interpret these funnel plots can be found in the “How to interpret a funnel plot” section.
- The survival estimates identified as “outliers” fell above or below the 99.8% control limits (the wider of the two “funnels” around the England estimate) at each level of precision.
- Click on the chart to enlarge it.
Download this image Figure 1: Funnel plot of the 1-year survival index (per cent) for all cancers combined, for Clinical Commissioning Groups (CCG): England, adults (aged 15 to 99) diagnosed in 1998 and in 2013
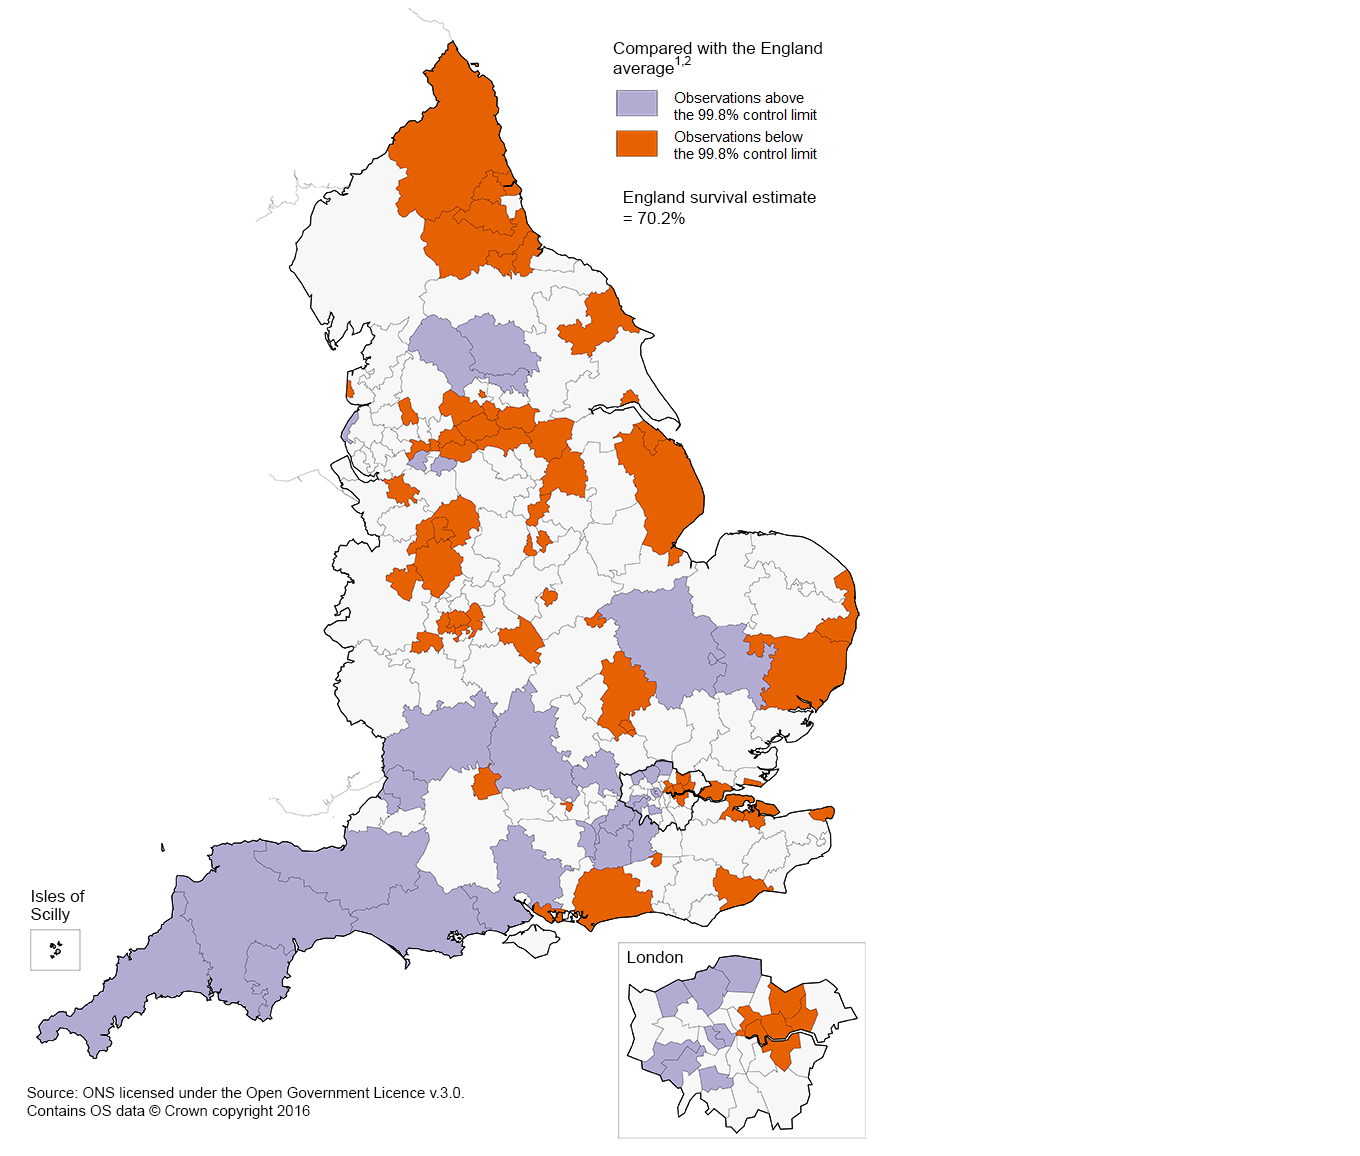
.png (65.3 kB) .xls (221.7 kB)A persistent feature of these data is that the 1-year survival index is generally lower in the north of England than in the south. In 2013, 26 of the 63 CCGs where the 1-year index is significantly below the England average were in North of England, and 16 of the 32 CCGs where the 1-year index is significantly above the England average were in the South of England (Figure 2).
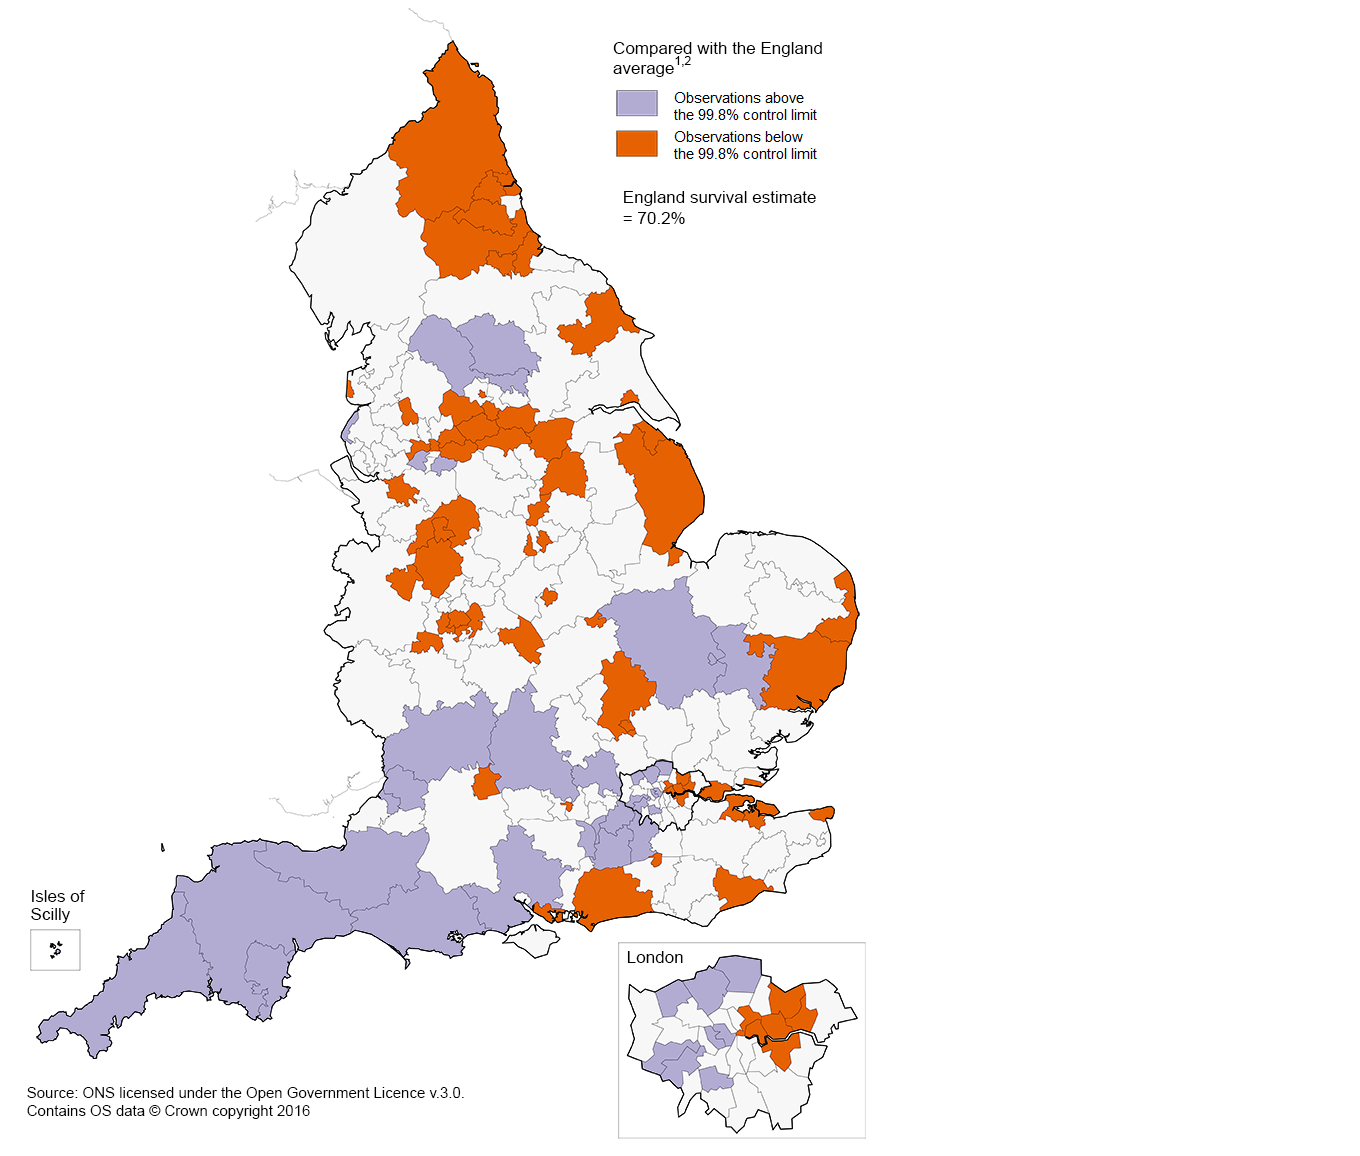
Figure 2: 1-year survival index for all-cancers combined compared with the England average, Clinical Commissioning Groups, 2013
Source: Office for National Statistics, London School of Hygiene & Tropical Medicine
Notes:
- Adults aged 15 to 99, who were diagnosed in 2013.
- The survival estimates identified as “outliers” fell above or below the 99.8% control limits (the wider of the two “funnels” around the England estimate) at each level of precision.
Download this image Figure 2: 1-year survival index for all-cancers combined compared with the England average, Clinical Commissioning Groups, 2013
.png (349.6 kB) .xls (749.1 kB)4. Breast, colorectal and lung cancer: 1-year survival
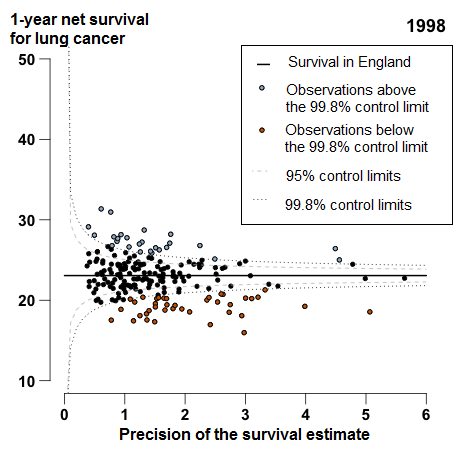
Estimates of 1-year age-standardised survival for breast cancer (women), and age-sex-standardised survival (Background note 11) for colorectal and lung cancer in each CCG have been introduced into this bulletin for the first time. Funnel plots for 2013 are provided in the commentary whilst funnel plots for 1998 can be found in Annex A. We provide a guide to interpreting these survival estimates in the section “Interpreting the survival estimates in this bulletin” .
Geographic patterns in 1-year survival differ for breast, colorectal, and lung cancer. For example, in the two northern-most CCGs, Cumbria and Northumbria, 1-year survival for lung cancer is consistently below the average survival in England, whereas 1-year survival for both breast and colorectal cancers are above the average.
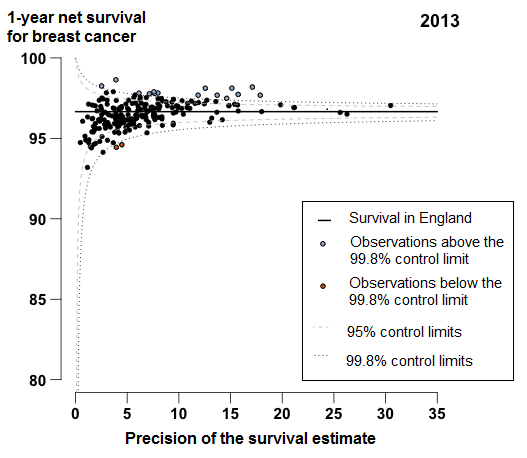
1-year breast cancer survival
In 2013, 1-year breast cancer survival in England was 96.7%, increasing from 92.0% for patients in 1998. Figure 3 shows a very tight clustering in survival in 2013 for CCGs around the England average: the difference between the highest survival estimate (98.6% in NHS Kingston CCG) and the lowest (93.2% in NHS South Tyneside CCG) was 5.4 percentage points.
In 2013, two CCGs were identified as outliers where survival was lower than the England estimate (Figure 3). In NHS Newham CCG 1-year survival has consistently been below the England average since 2000, with a difference of 2.1 percentage points from the England average in 2013. Survival in NHS Waltham Forest CCG has also been consistently below the England average since 2005, with a difference of 2.2 percentage points in 2013.
Figure 3: Funnel plot of the 1-year age-standardised survival (per cent) for breast cancer, for Clinical Commissioning Groups (CCG): England, women (aged 15 to 99) diagnosed in 2013

Source: Office for National Statistics, London School of Hygiene & Tropical Medicine
Notes:
- Each data point represents a single CCG. The higher the precision, the more reliable the survival estimate. More information on how to interpret these funnel plots can be found in the “How to interpret a funnel plot” section.
- The survival estimates identified as “outliers” fell above or below the 99.8% control limits (the wider of the two “funnels” around the England estimate) at each level of precision.
Download this image Figure 3: Funnel plot of the 1-year age-standardised survival (per cent) for breast cancer, for Clinical Commissioning Groups (CCG): England, women (aged 15 to 99) diagnosed in 2013
.png (36.3 kB) .xls (175.6 kB)1-year colorectal survival
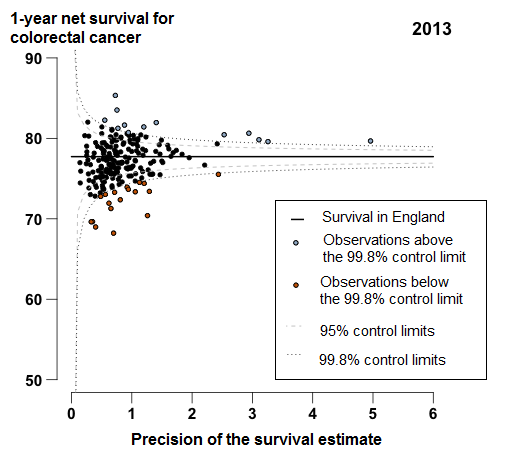
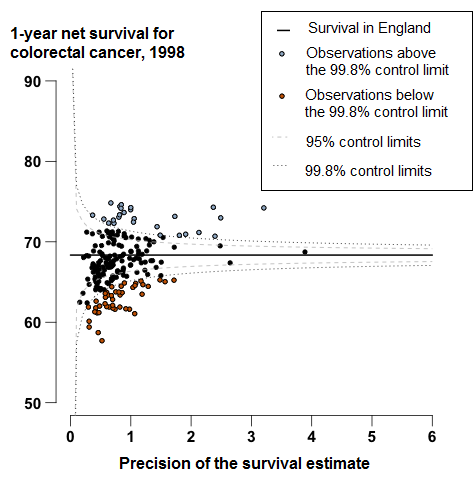
In England, 1-year survival for patients diagnosed with colorectal cancer has increased steadily from 68.3% in 1998 to 77.7% in 2013. In 2013, survival for most CCGs were similar to the England average, or identified as outliers higher than the survival estimate in England (Figure 4). For 18 CCGs, mostly in the Midlands and East of England, the 1-year survival estimates were identified as outliers, which were lower than the England average. The range between the highest and lowest estimate of 1-year survival for CCGs was 17.1 percentage points in 2013.
Figure 4: Funnel plot of the 1-year age-sex-standardised survival (per cent) for colorectal cancer, for Clinical Commissioning Groups (CCG): England, adults (aged 15 to 99) diagnosed in 2013
Source: Office for National Statistics, London School of Hygiene & Tropical Medicine
Notes:
- Each data point represents a single CCG. The higher the precision, the more reliable the survival estimate. More information on how to interpret these funnel plots can be found in the “How to interpret a funnel plot” section.
- The survival estimates identified as “outliers” fell above or below the 99.8% control limits (the wider of the two “funnels” around the England estimate) at each level of precision.
Download this image Figure 4: Funnel plot of the 1-year age-sex-standardised survival (per cent) for colorectal cancer, for Clinical Commissioning Groups (CCG): England, adults (aged 15 to 99) diagnosed in 2013
.png (37.2 kB) .xls (134.1 kB)1-year lung cancer survival
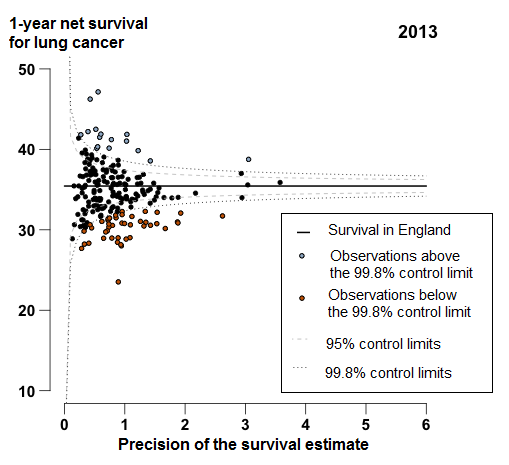
In England, 1-year survival for patients diagnosed with lung cancer increased from 23.1% in 1998 to 35.4% in 2013. For 44 of the 209 CCGs, the 1-year survival estimates were identified as outliers lower than the England average in 2013 (Figure 5); these CCGs were widely scattered around the country, but many (19 out of 44 CCGs) were in the Midlands and East of England.
Figure 5: Funnel plot of the 1-year age-sex-standardised survival (%) for lung cancer by Clinical Commissioning Group: England, 2013, patients aged 15 to 99 years
Source: Office for National Statistics, London School of Hygiene & Tropical Medicine
Notes:
- Each data point represents a single CCG. The higher the precision, the more reliable the survival estimate. More information on how to interpret these funnel plots can be found in the “How to interpret a funnel plot” section.
- The survival estimates identified as “outliers” fell above or below the 99.8% control limits (the wider of the two “funnels” around the England estimate) at each level of precision.
Download this image Figure 5: Funnel plot of the 1-year age-sex-standardised survival (%) for lung cancer by Clinical Commissioning Group: England, 2013, patients aged 15 to 99 years
.png (39.8 kB) .xls (146.9 kB)5. Interpreting the survival estimates in this bulletin
The cancer survival index: what it is
The cancer survival index provides a convenient, single number that summarises the overall pattern of cancer survival in each Clinical Commissioning Group (CCG), for all-cancers combined, for each calendar year. It combines the net survival estimates for each sex, age group and type of cancer (female breast cancer, colorectal cancer and lung cancer separately, and all other cancers combined, prostate cancer being excluded; see Background notes 8 to 10).1
For most cancers, survival is either stable or rising steadily from year to year.2 This trend is reflected in the index. However, the patterns of cancer by age, sex and type of cancer can shift quite quickly over time, especially in small areas. The index provides a summary measure of cancer survival that adjusts for any such shifts – for example, if the population becomes older and/or cancers with low survival come to comprise a higher proportion of all cancers in the CCG.
The cancer survival index is designed to reflect real progress in cancer outcomes. It is intended to change only if cancer survival actually changes, for one or more of the cancers, for men or for women, in one or more age groups. The index is designed for long-term monitoring of progress in overall cancer survival.
Points to consider when interpreting these estimates
For geographic areas with small populations, like most CCGs, some fluctuation in survival estimates between consecutive years can be expected.3,4 Fluctuations in cancer survival by CCG can occur due to the small numbers of cancer diagnoses and deaths each year within the population. Therefore, a low survival figure for a single calendar year should not be over-interpreted. However, if the survival estimates in a given CCG are consistently low "outliers" for several years in a row, possible explanations should be considered.
There are 209 CCGs. Small year-on-year changes in the survival estimates for a given CCG can mean big changes in its ranking. If the highest survival estimate is (say) 65% and the lowest is 50% (a 15 percentage points difference), then where differences in the estimate are very small in the middle of the range, a CCG may jump 30 places up or down the ranking of 209 CCGs if the estimate changes by just 1% between successive years.
Interpretation should focus on trends, rather than the survival estimate for a particular year, but a CCG for which the survival index is consistently lower than average should be considering why survival in its area might be low, even if it is identified as an outlier lower than the England average.
The aim of this publication is to present data that can support long-term improvements in cancer control. These estimates can indicate the potential for improvement in the management of cancer, from early detection through to referral, investigation, treatment and care. Survival estimates should not be used as the only indicator of a CCG's performance in cancer outcomes. To gain a more complete picture of the cancer burden in a particular CCG, these estimates should be used alongside other information available, such as cancer incidence and mortality data.
Furthermore:
Survival estimates are provided for patients diagnosed in each of the years from 1998 to 2013. It is important to note that CCGs in England came into existence on 1 April 2013, replacing NHS Primary Care Trusts. A CCG cannot be held responsible for trends in cancer survival that pre-date its existence. Data are provided for this 16-year period so that each CCG has a baseline against which to assess progress over time.5, 6 Survival is estimated using the most up to date CCG boundaries – in 2015, the number of CCGs fell from 211 to 209.
CCGs are membership bodies in which local General Practitioner (GP) practices are the members. Therefore, the population of a CCG is not entirely based on the geographical population of a defined territory, but on patients who are registered with a GP practice that is a member of that CCG, but who may live in the territory of a different CCG . With this in mind, it is important to note a limitation7 of these analyses: the cancer patients included in the analyses are those who lived in the territory assigned to that CCG when they were diagnosed.
In some cases the survival estimates for NHS Area Teams are greater than survival for the CCGs nested within the NHS Area Team. Survival estimates for Area Teams and for England are not simply a weighted average of the CCG estimates. Survival has been separately estimated for each Area Team, and for England as a whole. The survival estimates for CCGs fluctuate due to the small number of cancer cases and deaths, arising in residents of a CCG territory. Whereas, survival estimates for Area Teams (and England as a whole) have less variability than the survival estimates for any of their constituent CCGs because the number of cancer cases, and deaths, is much greater.
The survival estimates must be interpreted with care. They do not reflect the survival prospects for any individual cancer patient; they represent the survival for all cancer patients in a given geography in a given period of time.
6. How to interpret a funnel plot
Funnel plots offer a rapid visual presentation of variation in 1-year survival estimates between CCGs, showing how they compare with 1-year survival in England and taking account of the inherent variability (precision) of each survival estimate.8 A funnel plot avoids simply assigning a rank from 1 to 209, depending only on whether the estimate is low or high, which should be avoided as explained in the “Interpreting the survival estimates in this bulletin” section.
Funnel plots (see Figure 6) are a useful way to identify outlying observations in cancer survival. The black horizontal line represents the reference level or “target”, for example the level of 1-year survival in England. This is used as the reference level against which “outliers” can be identified. Each data point in the plot represents the survival estimate for a given CCG (vertical scale), plotted against the precision of that estimate (the inverse of the variance; Background note 11 ) on the horizontal scale. Data points that are identified as “outliers” lower (orange (or darker)) or higher (purple (or lighter)) than the England average are below or above the 99.8% control limit.
Figure 6: An example funnel plot, 1-year survival by Clinical Commissioning Group

Source: Office for National Statistics, London School of Hygiene & Tropical Medicine
Notes:
- Each data point represents a single CCG. The higher the precision, the more reliable the survival estimate. More information on how to interpret these funnel plots can be found in the “How to interpret a funnel plot” section.
- The survival estimates identified as “outliers” fell above or below the 99.8% control limits (the wider of the two “funnels” around the England estimate) at each level of precision.
Download this image Figure 6: An example funnel plot, 1-year survival by Clinical Commissioning Group
.png (39.6 kB)The two “control limits”, in the shape of a funnel around the horizontal line in Figure 6, represent the expected variation in survival around the England national figure, at any given level of precision (the horizontal axis). “Precision” is used to indicate the reliability of the estimate on the funnel plot (95% confidence intervals are also provided in the reference tables). The expected variation is shown as the 95% and 99.8% control limits (2 and 3 standard deviations, respectively), above or below the England average, which are equivalent to 95% and 99.8% confidence intervals.
CCGs for which the data points are within the control limits may be considered as those for which the survival estimate is no different than expected compared with the England average. Data points that fall outside the control limits are either higher or lower than expected compared with the England average. These points are “outlier” observations: if the value for a given CCG is consistently lower (or higher) than would be expected by chance, an investigation into the reasons may be worthwhile. In Figure 6, the “outlier” observations are marked in purple (or lighter; higher than expected compared with the England average) and orange (or darker; lower than expected compared with the England average).
It should be noted that these “outlier” values are not just the lowest (or highest) values that would be obtained from a simple ranked list. Some of the lowest values of the index are still within the range of variation that could be expected by chance (that is, inside the control limits). These are generally for the smallest CCGs, in which the index has lower precision. The precision estimate (shown on the horizontal axis in Figure 6) reflects the accuracy with which survival is being measured for each CCG. The higher the precision, the more reliable the estimate. Similarly, the smaller the precision, the wider the control limits, reflecting greater variability due to chance. CCGs with a large population will therefore tend to appear toward the right of each funnel plot, and those with small populations on the left, closer to the vertical axis.
Back to table of contents7. Who uses these statistics and what for?
Main users of cancer survival estimates include:
Clinical Commissioning Groups
NHS England
other government organisations
academics and researchers
cancer charities
the media
the general public.
Cancer survival estimates are used:
to inform national cancer strategy such as the Achieving World-Class Cancer Outcome: a strategy for England 2015-2020
in the NHS Outcomes Framework and the Clinical Commissioning Group Indicator Set
to inform research into inequalities in cancer survival
to answer Parliamentary Questions on cancer survival in England
to inform health awareness campaigns and cancer information leaflets/websites
8. Policy context
Given that a significant gap remains in survival compared with the European average, the Department of Health identified cancer as a specific improvement area for preventing people dying prematurely in the National Strategy (announced in 2011). In 2015 a new 5 year cancer strategy for England was developed by the Independent Cancer Task Force. This sets out recommendations for how the NHS can improve cancer outcomes for patients. The new strategy is being reviewed by Government bodies.
Survival estimates are used to formulate, monitor, and assess health policy and healthcare provision and planning. These estimates feed into the Clinical Commissioning Group (CCG) Indicator Set, which:
“provides clear, comparative information for CCGs, Health and Wellbeing Boards, local authorities, patients and the public about the quality of health services commissioned by CCGs and the associated health outcomes. The indicators are useful for CCGs and Health and Wellbeing Boards in identifying local priorities for quality improvement and to demonstrate progress that local health systems are making on outcomes.”
The CCG indicator set contributes to the National Health Service (NHS) Outcomes Framework, which focuses on measuring health outcomes and includes 1- and 5-year net survival from colorectal, breast and lung cancers. The NHS 5-Year Forward View (2015) set out: “that improvements in outcomes will require action on three fronts: better preventions, swifter access to diagnosis, and better treatment and care for all those diagnosed with cancer”.
Back to table of contents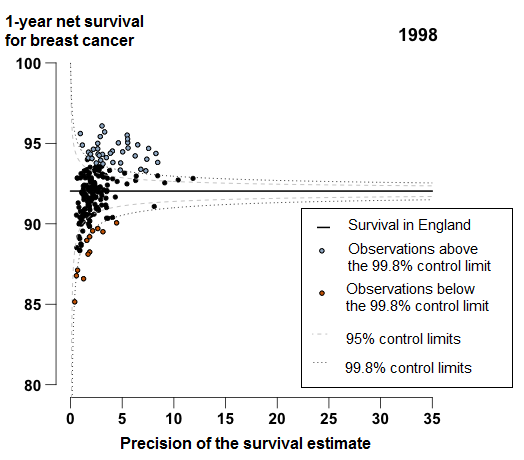

