Table of contents
- Disclaimer
- Main points
- Things you need to know about this release
- Background
- Coverage limitations of the feasibility AEDE
- Establishing highest qualification level from the feasibility AEDE
- Comparing highest level of qualification in 2011 from the feasibility AEDE, 2011 Census and APS at the aggregate level
- Comparing highest level of qualification in 2011 from the feasibility AEDE and 2011 Census for linked records
- Next steps
- Feedback
- Annex 1: Method used to link feasibility AEDE and 2011 Census records
- Annex 2: Quality of linked administrative data on education
- Annex 3: Deriving highest qualification level for each data source on feasibility AEDE
- Annex 4: Aligning the highest level of qualification variables from the feasibility AEDE, 2011 Census and APS
1. Disclaimer
These research outputs are not official statistics on the population nor are they used in the underlying methods or assumptions in the production of official statistics. Rather, they are published as outputs from research into a methodology different to that currently used in the production of population, migration and social statistics. These outputs should not be used for policymaking or decision-making.
Back to table of contents2. Main points
We are exploring the use of administrative data on qualifications as a replacement for collecting such information in censuses and surveys. This report outlines research we have carried out comparing information on educational qualifications, specifically highest level of qualification in 2011, from administrative data, the 2011 Census and the Annual Population Survey (APS).
Administrative data has the potential to provide more accurate information on qualifications achieved by individuals than self-reported data collected by censuses and surveys. Further research is required to provide information on qualifications from administrative data for all persons aged 16 years and over in England and Wales; consequently, surveys including the census remain the best way to collect this information to meet user needs at this point in time.
Administrative data supplied for this feasibility research has provided high-quality information on the highest level of qualification for individuals aged 16 to 25 years who studied in government-funded education in England. This offers an insight into a large proportion of first-time entrants to the labour market and consequently an understanding of whether this group is equipped with the skills to meet market demands.
Highest level of qualification recorded by the census and the APS offers widely used points of reference for comparison with administrative data. However, there are some quality issues with information on qualifications collected from censuses and surveys owing to self-reporting and proxy census responses; these include relying on someone remembering all qualifications achieved over their lifetime and only reporting qualifications that have been fully achieved instead of only partially achieved, or someone trying to match qualifications not listed to equivalent categories.
The distribution of highest level of qualification in 2011 obtained from administrative data was broadly similar to that reported by the 2011 Census and the APS; however, administrative data did record a higher percentage of individuals with “Level 3” (two or more A levels or equivalent) and consequently a lower percentage of individuals with other qualification levels.
When comparing linked administrative and 2011 Census data, highest level of qualification in 2011 was the same on both sources for 57% of people. For 84% of people, highest qualification level from administrative data either agreed with or was within one level of that recorded by the census.
Differences can be explained by the different data collection methods, the different time periods to which the data relate and differences in defining full attainment of qualification levels. The Office for National Statistics (ONS) is working with the Department for Education (DfE) to ensure full attainment can be better defined in the future.
Further work will focus on improving the population coverage using available administrative data on qualifications, in particular, including persons above 25 years of age and incorporating data for Wales. We want to ensure that user needs are met and address any differences that exist between qualifications data obtained from censuses, surveys and administrative sources.
Back to table of contents3. Things you need to know about this release
We are transforming the way we produce population, migration and social statistics to better meet the needs of our users and to produce the best statistics from all the available data. More information about our plans to do this and how we are progressing a programme of work to put administrative data at the core of population, migration and social statistics is available.
We welcome users providing feedback on these research outputs and the methodology used to produce them, including how they might be improved and potential uses of the data. Please email your feedback to admin.based.characteristics@ons.gov.uk. Please include “Education and Qualifications” in the subject line of your response.
This is early research to demonstrate the potential of administrative data to provide information on educational qualifications, which has been collected by the census since 1961. This release focuses on highest level of qualification in 2011 for persons in England aged 16 to 25 years. The Department for Education (DfE) has previously published research on highest level of qualification using administrative data; this focussed on a cohort of individuals who undertook GCSEs in the academic year ending August 2005, and considered their educational attainment up until they reached 25 years of age.
Our research uses a feasibility version of the All Education Dataset for England (AEDE). This dataset was created and supplied by the DfE to enable the Office for National Statistics (ONS) to investigate the potential of administrative data to provide information on educational qualifications currently collected by the census and surveys. All work outlined in this report has been conducted by the ONS in partnership with the DfE.
The feasibility AEDE held by the ONS is a longitudinal dataset created from three sources that cover government-funded education from primary to higher education:
- the national pupil database (NPD) for England, which is compiled by the DfE and is the schools administrative datastore, including the school census and awarding body data
- Individualised Learner Record (ILR) data for England collected by the DfE; these cover students in government-funded further education in England
- Higher Education Statistics Agency (HESA) data for Great Britain, which includes students at government-funded institutes of higher education
More information on these underlying datasets and the structure and content of the feasibility AEDE is contained within our source overview.
The feasibility AEDE provides socio-demographic characteristics and educational qualifications data for individuals who attended government-funded schools, further education and higher education in England. Those who have never interacted with government-funded education will not be included, for example, those who have only ever attended independent schools or institutions or those who have been home-educated outside of local authority provision.
In this report, Section 7 compares aggregate results for highest level of qualification in 2011 from administrative data, the census and the Annual Population Survey (APS). For comparison with the census and APS, it was necessary to estimate usual residents of England in 2011 in the administratve data. Section 8 provides further comparisons, using linked administrative and census data to explore the extent to which a person’s highest level of qualification agrees between the sources.
Back to table of contents4. Background
Census data on qualifications held is used widely across central and local government to inform service delivery and policy development. The 2021 Census Education topic report (PDF, 619KB) provides an assessment of user requirements for qualifications data obtained from a public consultation conducted in 2015. The main user requirements, as set out in the report, are for highest level of qualifications and no qualifications. Data on qualifications are used to:
- inform government policy on education, for example, evidence-based policymaking in relation to disadvantaged population groups
- allocate government resources
- help local authorities target employment and training schemes and skills programmes to specific areas and sub-groups of the population, such as targeting educational interventions to areas with low skill levels
- identify groups that lack the skills necessary to join the workforce
- build profiles of qualification levels for local areas and monitor changes over time including for different ethnic groups
- identify where parents with low skills are located and consequentially children with lower life chances are most likely to live, enabling targeted early intervention service
- analyse the impact of low educational attainment on health outcomes
- improve the quality of occupation coding
- monitor equality in line with the Equality Act 2010
“Quality education” is one of the 17 sustainable development goals (SDGs), while the proportion of youth not in education, employment or training is an indicator in the “Decent work and economic growth” SDG.
This research used the linkage methodology previously set out in the Beyond 2011: Matching Anonymous Data (PDF, 319KB); 84% of 2011 Census records relating to persons resident in England aged 16 to 24 years on 31 March 2011 were linked to the feasibility All Education Dataset for England (AEDE). Further information detailing how data were linked and the quality of the linked data is provided in the annexes (Section 11 to Section 14).
There are known quality issues with information on qualifications collected by the census. In 2011, question non-response was 5.7%¹, suggesting respondents may have found the qualifications question difficult to answer particularly in terms of a proxy response where one individual completed the form for everyone in the household.
The agreement rate² between the 2011 Census and the Census Quality Survey (CQS)³, was relatively low at 68%⁴. This is considered to result from census respondents finding it difficult to remember their qualifications or the qualifications obtained by others in their household (proxy responses accounted for 7% of differences between census and CQS responses (PDF, 1.42MB)). Respondents may also have found it challenging to map unlisted qualifications to provided categories. This includes certificates and diplomas that apply to more than one response category as well as foreign and other qualifications not explicitly listed. In contrast to the census, the CQS is interviewer administered and should provide more accurate responses as the interviewer can support respondents in choosing the most appropriate category.
Notes for: Background
- For context, age, sex and country of birth had non-response rates (XLS, 1.26MB) of 0.6%, 0.4% and 1.5% respectively.
- Agreement rates were calculated by comparing responses given in the CQS to those given in the census; they provided an indication of how accurately the 2011 Census questionnaire had been completed by the public.
- The census is a self-completion survey. The CQS is an interviewer-administered face-to-face survey. Both the CQS and census allow for proxy responses.
- Of the questions asked in the CQS, almost three-quarters achieved agreement rates of over 85%.
5. Coverage limitations of the feasibility AEDE
Administrative data has the potential to make census-type statistics for small populations and geographical areas available on a much more frequent basis and reduce response burden from the reuse of data already collected. However, as administrative data are not collected for statistical purposes, when they are used to produce statistics with strict definitions, we find each source has its own unique coverage patterns and statistical quality considerations. Table 1 outlines coverage limitations of the feasibility All Education Dataset for England (AEDE) compared with 2011 Census.
| Coverage | Feasibility All Education Dataset for England (AEDE) | 2011 Census |
|---|---|---|
| Time period | School census and educational attainment data are included for academic years starting September 2001 and ending August 2015. Further education and higher education interaction and attainment data are included for the reporting years starting August 2002 and ending July 2015. | Census data covers educational attainment achieved at any time, up to 27 March 2011 (Census Day). |
| Who | Individuals (including migrants) who studied in government-funded schools or further education institutions in England or higher education institutions in Great Britain. Those who have never interacted with government-funded education will not be included, for example, those who have only ever attended independent schools or institutions or been home-educated outside of local authority provision. Migrants entering the education system between the ages of 16 and 25 years may not have a complete record of educational attainment. | Individuals in England and Wales on Census Day; this includes usual residents, short-term residents (people here for at least three months but less than a year) and visitors. |
| Age of individual | Qualifications held by individuals aged 16 to 25 years in 2011 have been taken into account. Those aged 25 years in 2011 would have been aged 16 years in 2002, the age at which most individuals undertake their first formal qualifications. For older learners, data for their school activity is not held in a way that enables consistent linkage with the other datasets; older learners are recorded in Higher Education Statistics Agency (HESA) data and Individualised Learner Record (ILR) data, but they cannot be linked back to their school record. For this research, older learners were not included; this restriction will improve over time as data will be held for an increasingly older cohort. Consideration will be given to including older learners in future data supplies. | Information on qualifications held was recorded for all individuals aged 16 years and over. |
| Type of qualification | Includes academic and vocational qualifications and apprenticeships. Professional qualifications, foreign qualifications and qualifications gained abroad are not covered. | Includes recorded academic, vocational, professional¹, and any other qualifications and apprenticeships, including foreign qualifications. |
| Country where qualification was awarded | Provides school and further education qualifications obtained in England only; qualifications in higher education are those obtained in Great Britain. | Recorded qualifications obtained anywhere in the world. |
Download this table Table 1: Coverage limitations when obtaining highest level of qualification from the feasibility AEDE compared with the 2011 Census
.xls .csv6. Establishing highest qualification level from the feasibility AEDE
Table 2 shows how we aligned highest level of qualification categories derived from administrative data to those reported by the 2011 Census; Annex 4 provides a more detailed list that also aligns categories used by the Annual Population Survey (APS).
| Feasibility All Education Dataset for England (AEDE) derived categories | 2011 Census categories |
|---|---|
| Below level 1: equivalent to entry level qualifications or no qualifications | No academic or professional qualifications |
| Level 1: one to four GCSEs (any grade) or equivalent | Level 1: one to four GCSEs (any grade) or equivalent |
| Level 2: five or more GCSEs (grades A* to C) or equivalent | Level 2: five or more GCSEs (grades A* to C) or equivalent |
| Apprenticeship (any level) | Apprenticeship (any level) |
| Level 3: two or more A levels or equivalent | Level 3: two or more A levels or equivalent |
| Level 4 and above: sub-degree higher-level education and above | Level 4 and above: University degrees, Higher National Certificates (HNCs), Higher National Diplomas (HNDs) and professional qualifications like teaching, nursing or accountancy |
| Other: qualifications where level not known, includes qualifications gained outside the UK | Other: Other vocational, foreign or work-related qualifications |
| Not stated or unknown: no attainment identified |
Download this table Table 2: Aligning highest level of qualification derived from administrative data with categories used for the 2011 Census, England
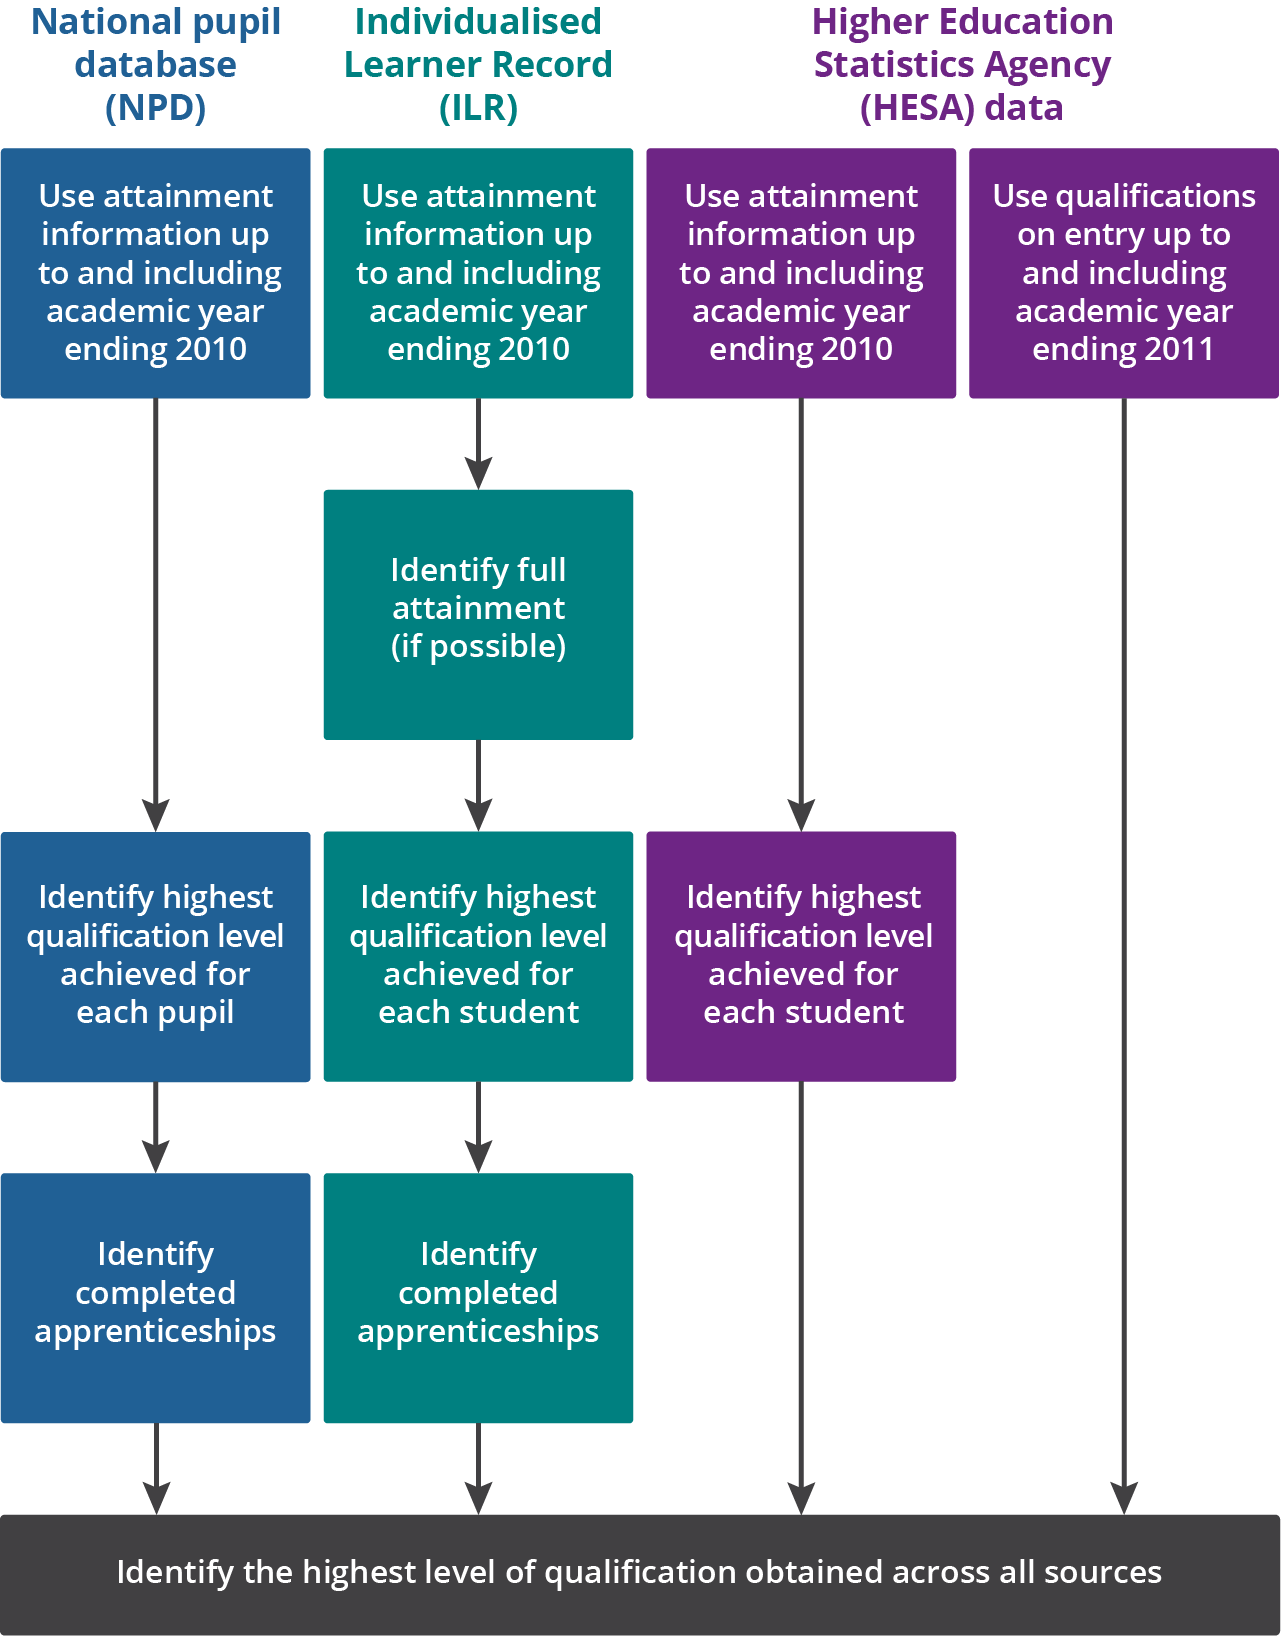
.xls .csvFor each individual, highest qualification level was derived on each of the three sources used to compile the feasibility All Education Dataset for England (AEDE); from this, the highest level of qualification overall was identified for each individual (Figure 1). More detail on how the AEDE highest level of qualification was derived for each source is contained within Annex 3.
Figure 1 Approach used to derive highest qualification level in 2011 using the feasibility AEDE
England
Source: Office for National Statistics – Admin-based qualification statistics
Download this image Figure 1 Approach used to derive highest qualification level in 2011 using the feasibility AEDE
.png (112.0 kB)
7. Comparing highest level of qualification in 2011 from the feasibility AEDE, 2011 Census and APS at the aggregate level
Highest level of qualification recorded by the 2011 Census and the Annual Population Survey (APS) in 2011 offers points of reference for comparison with aggregate-level results from the feasibility All Education Dataset for England (AEDE). When making comparisons, the limitations of census and survey data on qualifications, outlined previously in this report, should be considered. Section 8 provides further comparisons, using linked administrative and census data to explore the extent to which a person’s highest level of qualification agrees between the sources.
The APS is a household survey of people in the UK. It includes those deemed resident at private addresses, so it covers students in halls of residence with parents resident in the UK. However, it excludes people in most other types of communal establishments such as hotels, boarding houses, hostels and mobile home sites. Consequently, estimates from the APS will differ from 2011 Census estimates, which cover all usual residents.
To compare highest level of qualification in 2011 on the AEDE with the 2011 Census and APS (Table 3, Figure 2), it was necessary to estimate usual residents of England in 2011 on the feasibility AEDE; this was achieved by selecting records with an English postcode in the academic year ending 2011, plus any additional records relating to other academic years that were linked to a census record.¹
Annex 4 shows how the highest level of qualification variables from the feasibility AEDE, 2011 Census and APS have been aligned for comparison purposes.
| Highest level of qualification | Number of persons | Percentage | ||||
|---|---|---|---|---|---|---|
| Feasibility AEDE (2011) | 2011 Census | APS (2011) | Feasibility AEDE (2011) | 2011 Census | APS (2011) | |
| All categories | 5,751,139 | 6,284,760 | 6,156,956 | 100.0 | 100.0 | 100.0 |
| Below level 1 | 656,258 | 656,091 | 546,569 | 11.4 | 10.4 | 8.9 |
| Level 1: one to four GCSEs (any grade) or equivalent | 610,458 | 1,093,659 | 918,628 | 10.6 | 17.4 | 14.9 |
| Level 2: five or more GCSEs (grades A* to C) or equivalent | 1,415,257 | 1,667,206 | 1,706,651 | 24.6 | 26.5 | 27.7 |
| Apprenticeship | 233,722 | 163,301 | 86,023 | 4.1 | 2.6 | 1.4 |
| Level 3: two or more A Levels or equivalent | 1,928,278 | 1,629,193 | 1,662,066 | 33.5 | 25.9 | 27.0 |
| Level 4 and above: sub-degree higher-level education and above | 594,160 | 862,675 | 918,969 | 10.3 | 13.7 | 14.9 |
| Other qualifications: qualifications where level not known | 91,373 | 212,635 | 230,674 | 1.6 | 3.4 | 3.7 |
| Not stated or unknown | 221,633 | N/A | 87,376 | 3.9 | N/A | 1.4 |
Download this table Table 3: Highest level of qualification in 2011 for usual residents aged 16 to 24 years from the feasibility AEDE, 2011 Census and APS
.xls .csvNotes
- Annex 4 shows how highest level of qualification categories derived using the feasibility All Education Dataset for England (AEDE) were aligned to categories used for the 2011 Census and Annual Population Survey (APS).
- “Below level 1” will include persons aged 16 years who have not yet completed GCSEs or vocational qualifications.
- “Other” can include foreign qualifications.
- The APS variable used for comparisons was LEVQUL11 (PDF,924KB) (level of highest qualification held), which follows the Regulated Qualifications Framework (RQF) . APS figures have been weighted to reflect the size and composition of the general population.
- In the 2011 Census, where information on an individual’s qualifications was not provided, it was imputed.
Figure 2: Administrative data recorded a lower percentage of individuals with “Level 1” and “Level 4 and above” qualifications but a higher percentage with “Level 3"
Highest level of qualification in 2011 for usual residents aged 16 to 24 years, from the feasibility AEDE, 2011 Census and APS (percent distribution), England
Source: Office for National Statistics – Admin-based qualification statistics
Notes:
- 'Other' represents qualifications where level was not known; this can include foreign qualifications.
- In the 2011 Census, where information on an individuals qualifications was not provided, it was imputed.
Download this chart Figure 2: Administrative data recorded a lower percentage of individuals with “Level 1” and “Level 4 and above” qualifications but a higher percentage with “Level 3"
Image .csv .xlsWhy does the distribution of highest level of qualification in 2011 differ across sources?
In Figure 2, the most notable difference is the feasibility AEDE gives a lower proportion of individuals with “Level 1” and “Level 4 and above” qualifications but a higher proportion with “Level 3” qualifications compared with the 2011 Census and APS.
These differences can be explained through differences in the mode of data collection. The feasibility AEDE is linked administrative data from multiple data sources, recorded for funding and monitoring purposes and evidence-based policy making. As such, it could actually provide more accurate information on highest level of qualification achieved by individuals than self-reported data. This is because it does not rely on someone remembering all qualifications achieved over their lifetime and will not be affected by proxy responses.
The 2011 Census was a self-completion form while the APS is interviewer administered, either face-to-face or over the telephone. An interviewer can explain the question or help respondents remember their qualifications and report qualifications not on the listed options. Previous research found that differences in qualification estimates from the 2011 Census and the APS were largely because of differences in the mode of data collection (PDF, 227KB).
Differences in population coverage (outlined in Table 1) and the period to which the data refer will also account for a small proportion of the difference between the feasibility AEDE, 2011 Census and APS. In this analysis, the feasibility AEDE provides the highest level of qualification attained by the end of the academic year ending August 2010; in contrast, census figures represent the level attained by 27 March 2011 while APS figures provide the level attained when the individual was surveyed in 2011.
The percentage of individuals with “Level 3” as their highest level of qualification is over six percentage points higher when using the feasibility AEDE compared with the 2011 Census and APS. The feasibility AEDE is likely to have slightly overestimated “Level 3” qualifications because we were unable to accurately derive full attainment in further education data. Consequently, some students who only partially achieved a “Level 3” qualification in Individualised Learner Record (ILR) data will have been incorrectly classed as achieving a full “Level 3” qualification level; 14% of all persons assigned a highest qualification of “Level 3”’ were allocated this from ILR data. We are working with the Department for Education (DfE) to ensure full attainment can be more accurately derived in the future.
Using the feasibility AEDE, the percentage of individuals whose highest level of qualification in 2011 was “Other” is just under two percentage points lower than the 2011 Census. This could be because of qualification levels being assigned from the feasibility AEDE for some foreign students using Higher Education Statistics Agency (HESA) qualifications on entry, whereas the 2011 Census reported that they had qualifications but the level was unknown or not stated. Using the feasibility AEDE, data sourced from HESA providing qualifications on entry to higher education allocated Levels 2 to 4 for 2.5% of all persons in 2011.
Our findings show that the percentage of individuals with a qualification at “Level 4 and above” from the feasibility AEDE is three percentage points lower than the 2011 Census and almost five percentage points lower than the APS. The 2011 Census placed professional qualifications such as nursing, banking, accountancy, financial services and engineering in the “Level 4 and above” group; professional qualifications are also considered “Level 4 and above” by the APS, unless the qualification is considered below level 4 by the official qualifications framework, for example, Level 3 Diploma in Accounting. The feasibility AEDE does not capture professional qualifications so we would expect a lower percentage of individuals with a “Level 4 and above” qualification compared with the 2011 Census.
The 2011 Census shows that of all persons aged 16 years and over with a “Level 4 and above” qualification, almost one-quarter (24%) had a professional qualification but no academic or vocational qualification at Level 4 or above. This provides a guide for the difference that might be expected when using administrative data for all persons aged 16 years and over. However, the difference is expected to be substantially lower for those aged 16 to 25 years because professional qualifications will often be obtained at older ages.
Using the feasibility AEDE, data sourced from the national pupil database (NPD) provided the highest qualification level for 86% of persons assigned “Level 1” and “Level 2” and 83% of those assigned “Level 3”. The achievement of qualification Levels 1, 2 and 3 is well-recorded in the matched administrative data, which is a data source within the NPD and is used by the DfE to report Level 2 and 3 attainment by young people aged 19. The 2011 Census and APS rely on self-reporting; some persons, even with the help of an interviewer, are likely to incur difficulties recalling the number and associated grades of qualifications, for example, GCSEs, which are required to correctly assign “Level 1” or “Level 2”. Administrative data could therefore provide more accurate information. However, the percentage of persons assigned “Level 1” and “Level 2” are likely to be underestimated using the feasibility AEDE, owing to difficulties in accurately deriving full attainment in further education data.
Notes for: Comparing highest level of qualification in 2011 from the feasibility AEDE, 2011 Census and APS at the aggregate level
- This approximation for usual residency on the AEDE will underestimate the true number of usual residents.
8. Comparing highest level of qualification in 2011 from the feasibility AEDE and 2011 Census for linked records
Agreement rates have been used to compare highest qualification in 2011 from the feasibility All Education Dataset for England (AEDE) with that recorded by the 2011 Census. They represent the number of records where the highest level of qualification from the feasibility AEDE and 2011 Census agree as a percentage of all linked records. Table 4 shows there was 57% agreement for the highest level of qualification between the feasibility AEDE and 2011 Census. When including adjacent levels in the calculation, the agreement rate increases to 84%. This means that highest level of qualification in 2011 on the feasibility AEDE either agrees with the 2011 Census or is within one level for 84% of linked records.
| Feasibility AEDE (2011) | 2011 Census | ||||||||
|---|---|---|---|---|---|---|---|---|---|
| No professional or academic qualifications | Level 1 | Level 2 | Apprenticeship | Level 3 | Level 4 and above | No Code Required | Other | Total | |
| Below level 1 | 5.6¹ | 3.0² | 1.2 | 0.1 | 0.3 | 0.1 | 0.3 | 0.3 | 11.0 |
| Level 1 | 2.0² | 5.7¹ | 2.2² | 0.3 | 0.3 | 0.2 | 0.0 | 0.3 | 11.0 |
| Level 2 | 1.1 | 6.0² | 15.2¹ | 0.7 | 2.2² | 0.5 | 0.1 | 0.3 | 26.1 |
| Apprenticeship | 0.2 | 0.7 | 1.6² | 1.1¹ | 0.6² | 0.2 | 0.0 | 0.1 | 4.4 |
| Level 3 | 0.2 | 1.8 | 7.0² | 0.5 | 19.2¹ | 2.3² | 0.0 | 0.2 | 31.3 |
| Level 4 and above | 0.0 | 0.1 | 0.3 | 0.0 | 0.8² | 9.3¹ | 0.0 | 0.1 | 10.7 |
| Not stated or unknown | 0.6 | 0.5 | 0.5 | 0.0 | 0.5 | 0.4 | 0.0¹ | 0.8 | 3.3 |
| Other | 0.0 | 0.1 | 0.1 | 0.0 | 0.5 | 0.9 | 0.0 | 0.5¹ | 2.2 |
| Total | 9.9 | 17.9 | 28.1 | 2.8 | 24.4 | 13.9 | 0.4 | 2.5 | 100.0 |
Download this table Table 4: Agreement rates for highest level of qualification in 2011 between the feasibility AEDE and 2011 Census for linked individuals aged 16 to 25 years, England
.xls .csvSome of the disagreements will result from differences in the mode of data collection; this is discussed in more detail, along with many of the other explanations for disagreements noted in the following, in Section 7.
When making comparisons, it is important to remember that census responses are affected by self-reporting, proxy responses, recall bias and uncertainty about how to report qualifications not listed. The Census Quality Survey (CQS) (PDF, 1.42MB) showed that respondents found it difficult to distinguish between “Level 1” and “Level 2” and also between “Level 2” and “Level 3” for highest level of qualification. Consequently, the feasibility AEDE could provide more accurate information on highest level of qualification since attainment data are from awarding bodies, but the feasibility AEDE does have population coverage limitations.
Some disagreements where the level assigned using the feasibility AEDE is lower than that reported by the 2011 Census will be explained by the different time period to which the data sources refer.
Highest level of qualification was assigned using Individualised Learner Record (ILR) attainment for 12% of linked administrative records. Of these, only 30% were assigned the same level as reported by the 2011 Census (Table 5). Difficulties in deriving full attainment of qualification levels in the feasibility AEDE for further education data will explain some of these disagreements where the highest level of qualification from the feasibility AEDE is higher than that reported by the 2011 Census.
More specifically, disagreements where the 2011 Census reported “Level 4 and above” but the feasibility AEDE assigned a lower level can be explained by professional qualifications not being included in the feasibility AEDE; the 2011 Census recorded professional qualifications as “Level 4 and above”.
The “Below level 1” group was derived using the feasibility AEDE. Most individuals assigned to this group were aged 16 years with no attainment found (16 year olds who had not yet completed their GCSEs, for example) and consequently considered too young to have attained formal qualifications; those older than 16 years with no attainment found were considered to have highest level of qualification “not stated or unknown”. Just under half (46%) of persons on the feasibility AEDE for whom no qualification level could be derived reported a non-UK country of birth in the 2011 Census; these persons are likely to be foreign students who studied in England but had not gained an English qualification by 2011.
Table 5 shows that when the highest level of qualification from the feasibility AEDE is assigned using Higher Education Statistics Agency (HESA) data, the level assigned agreed with that recorded by the 2011 Census for 89% of persons. Qualifications on entry to higher education as reported on HESA data, are only used when no attainment is found from the other sources or the qualifications on entry to higher education suggest a higher level than reported by the other sources. Further work is required to gain a greater understanding of these data and the lower level of agreement.
| Data source used to obtain highest level of qualification from feasiblity AEDE | Number of persons | Percentage of persons for which feasibility AEDE and 2011 Census assigned the same highest level of qualification | |
|---|---|---|---|
| Highest level of qualification on feasibility AEDE is same as the 2011 Census | Highest level of qualification on feasibility AEDE is different from the 2011 Census | ||
| National pupil database (NPD) | 2,149,330 | 1,431,105 | 60 |
| Individualised Learner Record (ILR) | 177,769 | 412,823 | 30 |
| Higher Education Statistics Agency (HESA) | 437,554 | 54,869 | 89 |
| HESA: qualifications on entry to higher education | 52,636 | 129,999 | 29 |
| Total | 2,817,289 | 2,163,933 | 57 |
Download this table Table 5: Data source used to obtain AEDE highest level of qualification in 2011 and whether the feasibility AEDE and 2011 Census reported the same level
.xls .csv9. Next steps
This research demonstrates that administrative data can provide high-quality information on highest level of qualification achieved by individuals as it is not affected by issues resulting from self-reporting or proxy responses. The data available currently provides high-quality information on qualifications obtained by recent school leavers and graduates, representing a very large proportion of first-time entrants to the labour market. However, further work is required to increase the population coverage of the administrative data, by including persons above 25 years of age, and data for Wales. Working with the Department for Education (DfE), we hope to be able to derive full attainment of qualification levels in further education data more accurately in the future.
We also need to consider how we estimate a person’s qualifications if they are not present in the administrative data; this will need to depend upon identifying possible reasons why they are not present in the administrative data, such as:
- someone who has migrated into the country recently and is either studying but has not yet attained a qualification in the country or not studying
- someone who has only gained qualifications while attending independent educational institutions
- someone who gained their highest level of qualification prior to the academic year ending 2003, since data prior to this cannot be consistently linked
The 2021 Census could be used to provide a base for information on qualifications, and any future attainment recorded by administrative data could be used to update qualifications achieved over time. We will also consider how the AEDE could be extended to include more historical HESA data to improve coverage.
This research has focussed on comparing highest level of qualification in 2011 derived from administrative data with figures from the 2011 Census and Annual Population Survey (APS) for England as a whole. Future work will look at expanding the population coverage of the administrative data to enable more detailed statistics for sub-national areas and sub-groups of the population such as age–sex groups; we also hope to provide more detail for different qualifications, like the levels of apprenticeships. We also plan to compare highest level of qualification obtained from administrative data against the APS for more recent years.
Back to table of contents10. Feedback
We are keen to get feedback on these research outputs and the methodology used to produce them, including how they might be improved and potential uses of the data. Please email your feedback to admin.based.characteristics@ons.gov.uk. Please include “Education and Qualifications” in the subject line of your response.
We are very interested in understanding what qualifications data are likely to be required in the future to inform policies, target schemes and monitor changes over time, to ensure we meet user needs where possible. Please let us know:
- what qualifications data you require; is highest level of qualification of most interest?
- what are the qualifications data used for?
Please provide as much detail as you can and email your response to admin.based.characteristics@ons.gov.uk; information provided will be considered in future research.
Back to table of contents11. Annex 1: Method used to link feasibility AEDE and 2011 Census records
This research used the anonymous linkage methodology previously set out in the Beyond 2011: Matching Anonymous Data (PDF, 319KB). Here, we summarise methodological considerations that are specific to this piece of research that should be read in conjunction with the previous linked report.
To enable the feasibility All Education Dataset for England (AEDE) to be matched with the 2011 Census, the Office for National Statistics (ONS) created a 2011 AEDE; this removed multiple entries for the same student present in the feasibility AEDE, leaving only the closest student record to 2011. If a student had two entries that were equidistant from 2011, then the entry with the least amount of “missingness” was selected to maximise the chance of linking the record. Just under half (47%) of all 2011 AEDE records were from the academic year ending 2011¹, while 11% and 8% were from the academic years ending 2010 and 2012 respectively.
Deterministic matching (Figure 3), also known as rule-based matching, involved comparing match-keys for the 2011 AEDE and 2011 Census records to determine where matches occurred. The census dataset used for matching with the feasibility AEDE represented fairly raw collected census data before imputation of any missing data.
Missing values or dynamic characteristics on either the 2011 AEDE or the 2011 Census record, such as postcode, date of birth, sex, forename and surname, will reduce the number of match-keys available for matching and decrease the likelihood of finding a one-to-one match between the datasets for the record. The greatest impact results from a missing or incorrect postcode; eight of the nine match-keys used required either full or partial postcode information.
Different combinations of postcodes available from the 2011 Census² and feasibility AEDE³ were taken into account by the matching algorithm. For Higher Education Statistics Agency (HESA) records, matches on the census term-time postcode took precedent over matches on the other census postcodes since most students were enumerated by the census at their term-time address.
Beyond this, we used probabilistic matching, also known as score-based matching, to try to match records not linked by deterministic matching (Figure 3). Similarity tables were used to calculate agreement scores on names, date of birth, sex and postcode. A measure of agreement was also calculated for the geographical distance between locations. All matches with an overall agreement score above the assigned threshold value were regarded as a match and the records were linked.
Figure 3 shows the three possible outcomes when linking the 2011 Census and 2011 AEDE:
- AEDE and 2011 Census records that were linked; this will inevitably include a very small proportion of false-positive matches, or linked records that do not relate to the same individual
- AEDE records that were not linked to a 2011 Census record (AEDE residuals)
- 2011 Census records that were not linked to an AEDE record (2011 Census residuals)
Figure 3 Approach used to link individuals on 2011 AEDE and 2011 Census
England

Source: Office for National Statistics - Admin-based qualification statistics
Download this image Figure 3 Approach used to link individuals on 2011 AEDE and 2011 Census
.png (91.9 kB)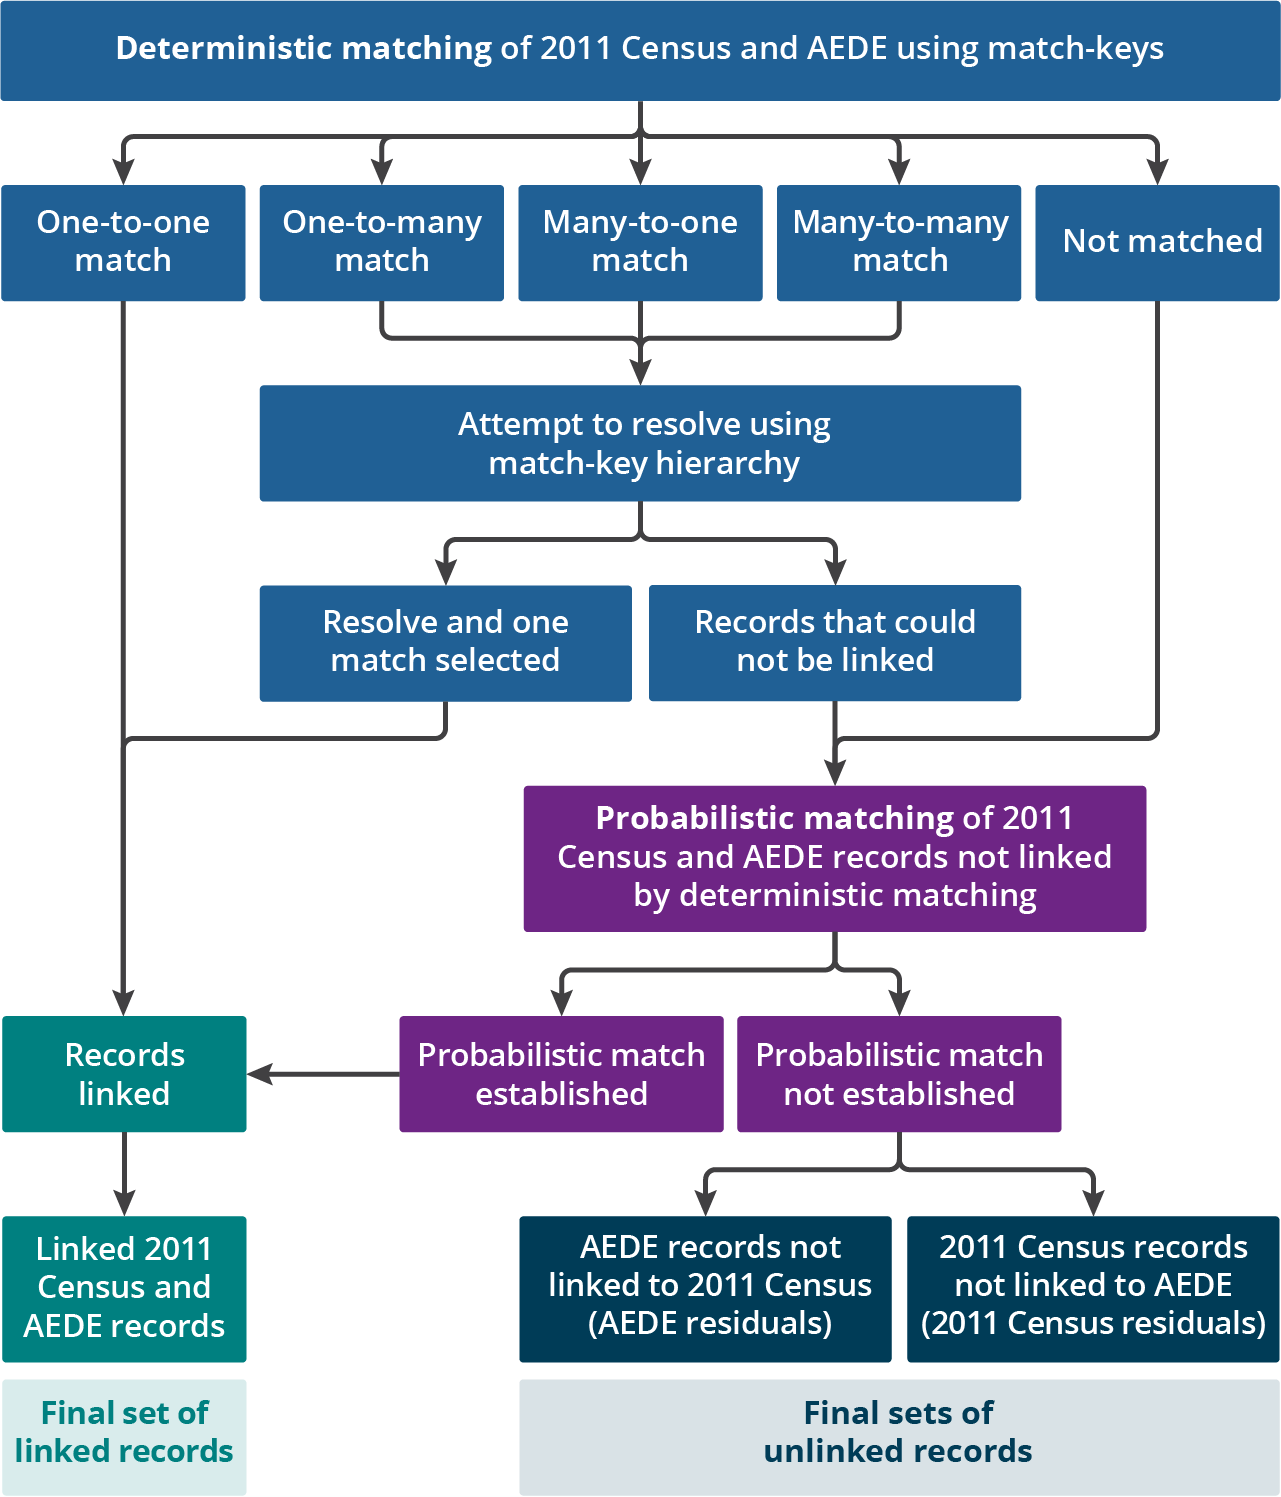
Notes for: Annex 1: Method used to link feasibility AEDE and 2011 Census records
- The national pupil database (NPD) academic year is from September to August, while it is from August to July for Individualised Learner Record (ILR) and Higher Education Statistics Agency (HESA) data.
- Main address; term-time address; second address; and address one year ago.
- Term-time postcode (NPD, ILR, HESA); home postcode (HESA); and postcode prior to enrolment (ILR).
12. Annex 2: Quality of linked administrative data on education
What proportion of 2011 Census records were linked to the 2011 AEDE?
Using deterministic and probabilistic matching, 84% of 2011 Census records relating to persons resident in England aged 16 to 24 years on 31 March 2011 were linked to the 2011 All Education Dataset for England (AEDE)¹. Deterministic matching resulted in 82% of 2011 Census records being linked while probabilistic matching resulted in a further 2% of 2011 Census records being linked.
What proportion of the 2011 AEDE was deterministically linked?
Overall, 66% of 2011 AEDE records were deterministically linked to a 2011 Census record; this will include some false-positive matches, or records that have been linked but that do not relate to the same individual. We would not expect to link 100% of records since the AEDE will include individuals who were not recorded by the 2011 Census; the reasons for this are explained later.
As expected, the highest deterministic linkage rate was achieved for 2011 AEDE records from the academic year ending 2011², the academic year when the census was conducted; 93% of records from the national pupil database (NPD), 82% of Individualised Learner Record (ILR) data and 76% of Higher Education Statistics Agency (HESA) data were linked to census data. Most individuals studying in England during the academic year ending 2011 should have been recorded by the 2011 Census. The slightly lower linkage rate for HESA compared with NPD and ILR is likely a consequence of the higher level of “missingness” of postcode in HESA data. Home postcode is thought to be missing from HESA data owing to students simply leaving it blank, while term-time postcode could have been left blank if they did not know their postcode when first entering their details. These results are consistent with results obtained from previous work to link 2011 Census with HESA and English school census data for 2011.
For all sources, the linkage rate declines as the academic year moves further away from 2011. This is likely to result from address information changing over time or individuals in the 2011 AEDE not being resident in England in 2011. Only a relatively small number of records are affected by these lower linkage rates since the majority (47%) of records used in the matching process were from the academic year ending 2011 (Annex 1).
Overall, 79% of NPD, 65% of ILR and 61% of HESA records were deterministically linked to 2011 Census data, regardless of academic year.
What proportion of the 2011 AEDE was probabilistically linked?
Probabilistic linkage was only applied to records that could not be linked deterministically; only 1.5% of 2011 AEDE records were probabilistically linked to a 2011 Census record. Probabilistic linkage was highest for earlier academic years. The higher linkage rates among earlier years is likely a consequence of records not being linked deterministically owing to personal information changing over time, such as postcode.
Overall, 67% of 2011 AEDE records were linked to a 2011 Census record using either deterministic or probabilistic matching.
Quality of linkage varies by individual’s age
The percentage of 2011 Census records linked to a AEDE record varied by age. Individuals aged 16 and 17 years had the highest linkage rate (94%), likely a consequence of lower residential mobility among students at these younger ages compared with those a few years older. Linkage rates for individuals aged 19 to 24 years ranged between 77% and 82%.
Reasons why some records cannot be linked
Individuals not in the 2011 Census
The 2011 Census had a person non-response rate of 6% for the total estimated population in England and Wales. For persons aged 15 to 19 years and 20 to 24 years, person non-response was 8% and 11% respectively. We publish census response rates by age-group.
Additionally, the fluid nature of migration means that if students were not in England and Wales on Census Day, then although they may be studying in the country, they will not be present in 2011 Census data.
The feasibility AEDE represents a cumulative stock estimate of all persons in the age cohort. Once recorded, the person remains in the AEDE even if they emigrate or die. Therefore, some persons in the 2011 AEDE will not have been recorded by the 2011 Census.
Individuals not in the feasibility AEDE
Individuals who only ever attend independent educational institutions or who are home-educated and receive no funding from the government are recorded by the census but are not in the feasibility AEDE. The Department for Education (DfE) estimated that there were around 86,000 individuals aged 16 to 18 years attending independent schools in England in 2011, representing around 4% of all individuals at that age. Data on the number of home-educated children who receive no funding from the government are not collected centrally; however, figures based on Freedom of Information responses received from 86 out of 152 councils suggest that in 2011, around 15,000 children were home-educated, representing around 0.2% of all individuals aged 5 to 16 years.
Migrants in the country on 27 March 2011 are captured by the 2011 Census but if they do not study in England, then they will not be in the feasibility AEDE.
Therefore, some persons recorded by the 2011 Census will not be in the AEDE.
Notes for Annex 2: Quality of linked administrative data on education
1 The percentage of 2011 Census records linked to the 2011 AEDE was calculated by restricting linked AEDE–census records (the numerator) to those where:
- the census age on 31 March 2011 was 16 to 24 years or not stated
- the census country was England
and restricting census records (the denominator) to records where:
- the census age on 31 March 2011 was 16 to 24 years
- the census country was England
Although the 2011 AEDE included some persons aged 25 years on 31 March 2011, these were excluded when calculating linkage rates. This is because the numerator (AEDE–census linked records) would have contained only one-quarter of the cohort turning 25 years of age in 2011 while the denominator (2011 Census) would have contained a full cohort, impacting on the linkage rate.
2 The NPD academic year is from September to August while for ILR and HESA it is from August to July.
Back to table of contents13. Annex 3: Deriving highest qualification level for each data source on feasibility AEDE
Figure 1 in Section 6 shows the approach used to derive highest level of qualification in 2011 using the feasibility All Education Dataset for England (AEDE). This annex provides further detail on the derivation process.
Deriving highest qualification level using the national pupil database
Attainment recorded on the national pupil database (NPD) is cumulative and includes academic and vocational qualifications, work-based learning, and apprenticeships. The latest NPD attainment record up to and including the academic year ending August 2010 was selected for each student. A highest-level qualification field was then derived by looking at whether the student had achieved Level 1, 2 or 3 overall or successfully completed an apprenticeship (apprenticeships were considered to sit between Levels 2 and 3). The levels recorded on the NPD correspond to the Regulated Qualifications Framework (RQF); the NPD does not currently record attainment beyond level 3. A student’s highest level of attainment on the NPD was then linked to the 2011 AEDE.
Deriving highest qualification level using ILR data
Only Individualised Learner Record (ILR) attainment records relating to completed academic or vocational qualifications, work-based learning or apprenticeships were retained for reporting years up to and including the year ending July 2010.
These ILR attainment records were then linked to learning aims reference datasets to obtain the qualification level; these levels correspond to the Regulated Qualifications Framework (RQF). To take account of students who had completed multiple aims, the attainment data was ordered and the highest level of qualification was retained for each student and linked to the 2011 AEDE.
Deriving highest qualification level using attainment from HESA data
Higher Education Statistics Agency (HESA) student records include a “qualifications obtained” population identifier that distinguishes students who have obtained a qualification. Using this, we retained only students who had obtained a qualification for reporting years up to and including the year ending July 2010. We then identified attainment of “Level 4 and above”. We then linked the highest level of qualification recorded for each individual to the 2011 AEDE.
We also used highest level of qualification on entry to higher education from HESA data. Where available, this field enabled us to obtain highest level of qualification for students not recorded by the NPD or Individualised Learner Record (ILR) data and who were only part-way through completing their studies at higher education, for example, international students.
Back to table of contents14. Annex 4: Aligning the highest level of qualification variables from the feasibility AEDE, 2011 Census and APS
| Highest level of qualification used for comparison | Annual Population Survey (APS) | 2011 Census | Feasibility All Education Dataset for England (AEDE) |
|---|---|---|---|
| LEVQUL11 | |||
| Below level 1 | No qualifications | No academic or professional qualifications | Below level 1: Entry-level qualification and no qualifications |
| Level 1 | Below NQF Level 2: education below GCSE level | Level 1: one to four O Levels, CSEs or GCSEs (any grades); Entry level foundation diploma; NVQ Level 1; foundation GNVQ; or Basic or Essential Skills | Level 1: one to four GCSEs (any grade) or equivalent |
| Level 2 | NQF Level 2: equivalent to GCSEs | Level 2: five or more O Level (Passes), CSEs (Grade 1) or GCSEs (Grades A* to C); School Certificate; one A Level, two to three AS levels or VCEs; Intermediate or Higher Diploma; Welsh Baccalaureate Intermediate Diploma; NVQ Level 2; Intermediate GNVQ; City and Guilds Craft; BTEC First or General Diploma; or RSA Diploma | Level 2: five or more GCSEs (grades A* to C) or equivalent |
| Apprenticeship | Trade Apprenticeships | Apprenticeship | Apprenticeship at any level |
| Level 3 | NQF Level 3: equivalent to A levels | Level 3: two or more A Levels or VCEs; four or more AS levels; Higher School Certificate; Progression or Advanced Diploma; Welsh Baccalaureate Advanced Diploma; NVQ Level 3; Advanced GNVQ; City and Guilds Advanced Craft; ONC; OND; BTEC National; or RSA Advanced Diploma | Level 3: two or more A levels or equivalent |
| Level 4 and above | NQF Level 4 and above: sub-degree higher-level education and above (includes professional qualifications considered to be NQF Level 4 or above) | Level 4 and above: degree (for example, BA or BSc); Higher Degree (for example, MA, PhD or PGCE); NVQ Levels four to five; HNC; HND; RSA Higher Diploma; BTEC Higher level; Foundation degree (NI); Professional qualifications (for example, teaching, nursing or accountancy) | Level 4 and above: sub-degree higher-level education and above |
| Other qualifications | Other qualifications | Other qualifications: Vocational or work-related qualifications; foreign qualifications or qualifications gained outside the UK (NI) (not stated or level unknown) | Other qualifications: those where level not known, includes qualifications gained outside the UK |
| Not stated or unknown | No answer or does not apply | - | Not stated or unknown |