Table of contents
- Main points
- Things you need to know about this release
- The composition of property crime
- Falling long-term trends in property crime
- Continued falls in metal theft
- Recent trends within police recorded property crime
- What is happening to trends in fraud
- Levels of victimisation
- Characteristics associated with being a victim of property crime
- Mobile phone theft
- Nature of CSEW property crime
- Property crime against businesses
- Quality and methodology
- Background notes
1. Main points
The majority of crime results from the illegal acquisition of property; making up around 2 in 3 of all crime (66%) in the Police Recorded Crime (PRC) series and 80% of all incidents estimated by the Crime Survey for England and Wales (CSEW).
The reduction in property crime has been the main driver in falling crime numbers since the mid-1990s. The CSEW indicates that while there have been long-term declines across most types of property crime, the falls have been most pronounced in vehicle-related thefts (which include attempted thefts as well as actual thefts from and of vehicles), domestic burglary and criminal damage.
Some commentators have suggested that crime has not actually fallen; but rather changed its nature and moved into offence categories not well covered by the official statistics, such as fraud and computer misuse. However, new Experimental Statistics from the CSEW on fraud and computer misuse offences show a substantial volume of crimes (5.8 million) were experienced by the population resident in households in the last 12 months but should be seen in the context of a fall of 10.2 million incidents of property crime since its peak in 1995.
Initial findings from these Experimental Statistics showed an estimated 6.5% of adults in England and Wales had been victims of fraud in the previous 12 months (representing a higher prevalence rate than any other crime type) while 3.6% had been victims of computer misuse. A further update to these Experimental Statistics, for the year ending June 2016 has also now been published and had similar estimates of incident numbers and prevalence rates.
In the survey year ending March 2016, estimates of CSEW property crime (excluding fraud) continued to fall and there was a reduction of 7% (from 5.4 million to 5.1 million incidents) compared with the previous year. Police recorded property crime rose by 2% compared with the previous year. This should be seen in the context of a long-term downward trend.
The main drivers in Police Recorded Crime of the increase were the offence categories of criminal damage and arson (an increase of 7%, or 35,898 offences) and fraud (an increase of 4%, or 26,563 offences). However, some of the increases in criminal damage are thought to relate to improvements in police recording practices. Other offence categories also increased slightly compared with the previous year, though being lower volume increases, they contributed less to overall police recorded property crime. These offence categories include: shoplifting, theft from the person and vehicle offences.
CSEW offences relating to theft of personal items; either unattended (other personal theft) or attended (theft from the person) have not fallen at the same pronounced rate as other property crime types. Therefore such thefts now make up a higher proportion of CSEW property crime than in previous years (22%, combined). Most commonly, these thefts are targeted at purses, wallets, bank cards, money and mobile phones. Specifically, wallets or purses continue to be stolen in a high proportion (41%) of theft from the person offences along with cash or foreign currency and mobile phones (40% and 37% respectively).
Similar to previous years, general patterns of victimisation were similar across most types of CSEW property crime. Victims of property crimes were more likely to be living in urban areas and areas that had low employment levels, or high levels of incivility. However, analysis of CSEW Experimental Statistics (relating to fraud and computer misuse) found less variation than other types of property crime, in the rate of victimisation across different groups in society.
Back to table of contents
2. Things you need to know about this release
This bulletin provides an overview of statistics on property crime measured by the Crime Survey for England and Wales (CSEW) and recorded by the police1. The main trends and the more detailed CSEW data contained within the “Nature of Crime” tables, published alongside this release, are also discussed within this bulletin. We also present some statistics on property crimes against businesses based on the Commercial Victimisation Survey (CVS)2. There is further information on each of these sources in the “Quality and Methodology“ section of this release.
Property crime is defined as incidents where individuals, households or corporate bodies are deprived of their property by illegal means (including attempts) or where their property is damaged. For the purposes of this report, robbery3 is included as a property crime. Fraud4 is included in total police recorded property crime. CSEW Experimental Statistics on fraud and computer offences are also referenced, although owing to their experimental nature, they are not included in the total CSEW property crime estimates at this time.
Property crime covered by the survey includes: criminal damage, vehicle-related theft, domestic burglary, other household theft, theft from the person, other theft of personal property, bicycle theft and robbery.
Crime recorded by the police includes the following offence categories: fraud, criminal damage, burglary, vehicle offences, shoplifting, bicycle theft, theft from the person, “other” theft offences and robbery5.
CSEW data are presented for the latest financial year (ending March 2016) although data for the survey year ending June 2016 have already been published as part of our regular quarterly release.
Time periods covered
Analysis here is based on financial year data for the year ending March 2016, since this is the latest time period for which we have available all analysis discussed in this release. Additionally, financial year data are more commonly used to measure long-term trends. Year to June 2016 data are only referenced throughout this bulletin in instances where these updated figures help interpret recent findings.
Latest CSEW and police recorded crime data can be found in Crime in England and Wales, year ending June 2016.
The CSEW figures presented in this release are based on interviews conducted between April 2015 and March 2016, measuring people’s experiences of crime in the 12 months before the interview.
The latest recorded crime figures relate to crimes recorded by the police for the year ending March 2016. Police recorded crime data presented in this release are those notified to the Home Office and were recorded in the Home Office database as at 15 September 2016.
In this release:
- “latest year” (or “latest survey year”) refers to the year (or survey year) ending March 2016
- “previous year” (or “previous survey year”) refers to the year (or survey year) ending March 2015
- any other time period is referred to explicitly
Crime Survey for England and Wales
The CSEW is a face-to-face victimisation survey in which people resident in households in England and Wales are asked about their experiences of a selected range of offences in the 12 months prior to the interview. For the population and offence types it covers, the CSEW provides the better measure of trends on a consistent basis over time.
The CSEW is able to capture a broad range of victim-based crimes experienced by those interviewed, not just those that have been reported to, and recorded by, the police.
New questions on fraud and computer misuse were added to the CSEW in October 2015. While these questions had only been included within the CSEW for half of the survey year by the end of March 2016, sufficient data were gathered to produce estimates of fraud and computer misuse, and these are referenced in this release as Experimental Statistics. These do not yet form part of the headline CSEW estimates. Until such data are available for 2 complete survey years, comparisons with previous years and analysis of trends will be based on CSEW crime excluding fraud and computer misuse offences.
In addition to these new data covering a wide spectrum of fraud, for the last decade, the survey has included a supplementary module of questions specifically on plastic card (bank and credit card) fraud. References to CSEW “plastic card fraud” within this bulletin refer to these separate data. Data from these questions provide an indication of whether an individual has been a victim of plastic card fraud, but do not provide any information on the number of times this occurred or the scale of any loss that may have been experienced.
Police recorded crime
Police recorded crime figures are restricted to a subset of notifiable offences that have been reported to and recorded by the police. Therefore, while the police recorded crime series covers a wider population and a broader set of offences than the CSEW, it does not include crimes that do not come to the attention of the police or are not recorded by them.
Owing to a change in recording practices brought about by the introduction of the National Crime Recording Standard6 (NCRS) in April 2002, it is not possible to make direct long-term comparisons of police recorded crime prior to the year ending March 2003. Thus, this release restricts discussion of trends in police recorded property crime to the periods between the year ending March 2003 and March 2016.
Notwithstanding the above, the police recorded crime series is currently not considered a reliable measure of trends in crime. Following an assessment of crime statistics by the UK Statistics Authority, published in January 2014, the statistics based on police recorded crime data were found not to meet the required standard for designation as National Statistics. Apparent increases in police recorded crime seen over the last 2 years may reflect a number of factors, including tightening of recording practice, process improvements, increases in reporting by victims and also genuine increases in the levels of crime. While improvements in recording practices are thought to have centred more on violent crime, the impact of these improvements is likely to have also affected police recording processes more broadly. Further information is available in Section 13 (Quality and methodology).
Police recorded crime is the principal source of subnational crime statistics and for relatively serious, but low volume, crimes that are not well-measured by a sample survey. Police recorded crime also covers victims and sectors excluded from the CSEW sample (for example, residents of institutions, tourists and crimes against commercial bodies), but only, of course, to the extent that such victims report crimes to the police, which varies substantially by crime type (CSEW data inform us that whilst burglaries are relatively well reported to police, attempted thefts from the person are reported at a much lower rate).
Chapter 3 of the User Guide provides more detailed information about police recorded crime.
Commercial Victimisation Survey
The Commercial Victimisation Survey (CVS) is a telephone survey in which respondents from a representative sample of business premises in certain sectors in England and Wales are asked about crimes experienced at their premises in the 12 months prior to interview. Surveys took place in 2012, 2013, 2014 and 2015 having previously run in 1994 and 2002. Further information relating to coverage, quality and methodology can be found in Crime against businesses: findings from the 2015 CVS: methodology.
Notes for things you need to know about this release:
- Police recorded crime data presented in this release are those notified to the Home Office and were recorded in the Home Office database on 15 September 2016.
- Data from the CVS are classified as Official Statistics as they have not yet been assessed for National Statistics status.
- Robbery is an offence in which violence or the threat of violence is used during a theft (or attempted theft) and, within the quarterly statistical release, is reported as a separate, standalone category in both the police recorded crime and CSEW data series. As robbery involves an element of theft, it is included within this “Focus on: Property crime” publication.
- The classification of fraud incidents for use in the published statistics consists of 4 major fraud categories: bank and credit account fraud, advanced fee fraud, non-investment fraud and other fraud, an outline of each can be found in Overview of fraud statistics: year ending March 2016.
- More detailed definitions of CSEW offences and police recorded crime offences can be found in Chapter 5 of the User Guide.
- The NCRS, introduced in April 2002, was designed to ensure greater consistency between forces in recording crime and to take a more victim-oriented approach to crime recording, with the police being required to record any allegation of crime unless there was credible evidence to the contrary.
3. The composition of property crime
Crime Survey for England and Wales
Property crime accounted for 80% (an estimated 5,066,000 incidents) of all crime covered by the Crime Survey for England and Wales (CSEW) in the latest survey year. Criminal damage (24%), vehicle-related theft (17%), other theft of personal property (15%), domestic burglary (14%) and other household theft (13%) were the largest components of CSEW property crime in the latest survey year. Theft from the person, bicycle theft and robbery collectively accounted for a small proportion of CSEW property crime (7%, 6% and 3%, respectively).
Comparing the composition of property crime in 1995 (when peak levels of crime were measured) with the latest survey year, the most noticeable difference is in vehicle-related theft (Figure 1). Estimated incidences of this offence have dropped from 4.3 million offences in 1995 (when it made up 28% of property crime) to just under 0.9 million offences in the latest survey year (making up 17% of property crime). The sub-categories of theft from a vehicle, theft of a vehicle and attempted thefts of, and, from vehicles fell 74%, 84% and 88% respectively over this timescale.
Domestic burglary also fell by a slightly higher rate than other property crimes (by around 1.7 million offences over this time period) and now contributes slightly less (14%) to overall property crime than in 1995 (16%). This has meant other elements of property crime, now contribute slightly more to overall CSEW property crime. Improvements in car and home security as well as increased desirability and value of items commonly carried on the person (such as smartphones) have undoubtedly played a role in this changing composition of property crime.
Figure 1: Composition of Crime Survey for England and Wales property crime, year ending December 1995 and year ending March 2016
Source: Crime Survey for England and Wales, Office for National Statistics
Notes:
- Experimental statistics on fraud are not included.
Download this chart Figure 1: Composition of Crime Survey for England and Wales property crime, year ending December 1995 and year ending March 2016
Image .csv .xlsPolice recorded crime
Property crime made up 66% (2,970,843 offences) of all police recorded crime in the year ending March 2016. Fraud (21%), criminal damage and arson (18%) and “other” theft offences, such as theft of unattended items (16%), were the largest components of property offences recorded by the police in the latest year. Theft from the person (3%), bicycle theft (3%) and robbery (2%) collectively accounted for a small proportion of all police recorded property crime; Figure 2 provides a full breakdown.
Figure 2: Composition of police recorded property crime in England and Wales, year ending March 2003 and year ending March 20161
Source: Police recorded crime, Home Office
Notes:
- Police recorded crime data are not designated as National Statistics.
- Fraud offences were recorded by Action Fraud and the National Fraud Intelligence Bureau (through Cifas and Financial Fraud Action UK) from the year ending March 2012 onwards. Comparisons between earlier years are not directly comparable due to fraud offences coming from new data collections and the implementation of improved recording practices since the year ending March 2012.
Download this chart Figure 2: Composition of police recorded property crime in England and Wales, year ending March 2003 and year ending March 2016^1^
Image .csv .xlsComparing the composition of police recorded property crime in the year ending March 2016 with the year ending March 2003, noticeable changes include the following:
The volume of shoplifting offences has remained fairly steady relative to other offence categories, which have fallen over time. As a result, this now makes up a larger share of crimes recorded by the police (11% of property crime in the latest year compared with 6% in the year ending March 2003).
Fraud made up 21% of property crime (619,674 offences) in the latest year compared with 4% (183,683 offences) in the year ending March 2003. However, it should be noted that increases in fraud offences can at least in part be attributed to the extended coverage of police recorded fraud and improvements in recording following the roll-out of a national reporting centre (Action Fraud). Such changes from the year ending March 2012, mean it is not possible to make valid comparisons between current fraud data and data available prior to 20121.
The contribution of vehicle crime to total police recorded property crime reduced by 10 percentage points between the years ending March 2003 and March 2016 (from 22% to 12%). The proportion of property crime accounted for by burglary reduced by 5 percentage points to 13%. Criminal damage also now contributes 5 percentage points less than in the year ending March 2003 (18%). Some of the above are a by-product of changes to the reporting and recording of fraud data. When fraud is excluded from the police recorded data, the contributions of criminal damage and burglary to police recorded property crime is almost unchanged compared with the year end 2003. However, the contribution of vehicle crime still drops by 7 percentage points, demonstrating that these offences have fallen at a faster pace than other property crimes.
Property crime against children aged 10 to 15
Based on the latest survey year, there were an estimated 274,000 incidents of personal theft and 111,000 incidents of criminal damage to personal property experienced by children aged 10 to 152. Around 65% of the thefts were classified as “Other theft of personal property” (179,000 incidents), which includes thefts of unattended property. Given the small sample size for the 10-to-15-year old element of the CSEW, estimates can fluctuate over time and as a result trends can be difficult to interpret. The planned future development and analysis of a rolling 3-year dataset in 2017 for the age 10 to 15 element of the CSEW will hopefully go some way to addressing these issues by providing estimates based on a much larger sample size. Currently detailed data for the year ending March 2016 are available in the corresponding quarterly release, Tables F21, F22 and F23.
Commercial Victimisation Survey
Of the crimes against business covered by the Commercial Victimisation Survey (CVS) in 2015, 91% were property-related (an estimated 4.9 million offences). Section 12 provides further details.
Notes for the composition of property crime:
- It is not possible to make direct comparisons with police recorded fraud figures between the years ending March 2003 and March 2016. Further information is available Overview of fraud statistics: year ending March 2016.
- Based on the preferred measure of crime, more information about the preferred and broad measures of crime against children aged 10 to 15 can be found in Section 2.5 of the User Guide.
4. Falling long-term trends in property crime
CSEW property crime
Steady increases in Crime Survey for England and Wales (CSEW) property crime were seen from 1981 when the survey started, peaking in 1995. Since then, levels of property crime have declined and estimates from the latest survey year were 67% lower than in 19951 (Figure 3). This trend is consistent with that seen in many other countries (Tseloni et al., 2010).
Figure 3: Long-term trends in Crime Survey for England and Wales, total crime and property crime, year ending December 1981 to year ending March 2016
Source: Crime Survey for England and Wales, Office for National Statistics
Notes:
- Prior to year ending March 2002, CSEW respondents were asked about their experience of crime in the previous calendar year, so year-labels identify the year in which the crime took place. Following the change to continuous interviewing, respondents' experience of crime relates to the full 12 months prior to interview (that is. a moving reference period), so year-labels from the year ending 2002 onwards identify the CSEW year of interview.
Download this chart Figure 3: Long-term trends in Crime Survey for England and Wales, total crime and property crime, year ending December 1981 to year ending March 2016
Image .csv .xlsFigure 4 shows the trend for a number of the high volume property crime types. Most of these show a similar trend to overall CSEW property crime, with levels peaking in the mid-1990s, followed by a general decline.
The rate of reduction in vehicle offences has been striking. Over the longer-term, the CSEW indicates a consistent downward trend in levels of vehicle-related theft (the highest volume offence in the theft categories) with the latest estimates being 79% lower than in 1995. There were an estimated 878,000 vehicle-related thefts in the latest survey year, the lowest estimate since the survey began in 1981. Vehicle-owning households were around 5 times less likely to become a victim of vehicle-related theft in the latest survey year than in 1995.
Improvements to vehicle security are likely to have contributed, in-part, to the reduction seen in vehicle offences as suggested by Farrell et al 2008. This is discussed further in the Home Office research report, Reducing criminal opportunity: vehicle security and vehicle crime. Evidence from the Home Office research report, on the drug epidemic of the 1980s and 1990s published in July 2014 suggests the rise and fall in vehicle-related theft could also be partly attributed to the changing levels of illegal drug use.
Domestic burglary and other theft of personal property offences peaked in the early to mid-1990s and steadily declined until the survey year ending March 2008. Between the survey years ending March 2008 and March 2012, the downward trend in these offences appeared to flatten out, but further annual reductions have been seen in both offence categories since this time.
Criminal damage peaked in the 1993 survey with 3.4 million incidents, followed by a series of modest falls (when compared with other CSEW offence types) until the survey year ending March 2004 (2.4 million offences). There was then a short upward trend until the survey year ending March 2007 CSEW (2.9 million offences), after which there were falls to its current level, the lowest since the survey began. So now, in a reversal from the earlier years of the property crime decline, criminal damage has been the biggest driving factor in the fall, rather than burglary or vehicle crime.
Figure 4: Long-term trends in Crime Survey for England and Wales criminal damage, other theft of personal property, vehicle-related theft and domestic burglary, year ending December 1981 to year ending March 2016
Source: Crime Survey for England and Wales, Office for National Statistics
Notes:
- Prior to the year ending March 2002, CSEW respondents were asked about their experience of crime in the previous calendar year, so year-labels identify the year in which the crime took place. Following the change to continuous interviewing, respondents' experience of crime relates to the full 12 months prior to interview (i.e. a moving reference period), so year-labels from the year ending March 2002 onwards identify the CSEW year of interview.
Download this chart Figure 4: Long-term trends in Crime Survey for England and Wales criminal damage, other theft of personal property, vehicle-related theft and domestic burglary, year ending December 1981 to year ending March 2016
Image .csv .xlsFigure 5 shows the long-term trends in CSEW “other household theft” 2, theft from the person3, bicycle theft and robbery from 1981 to the survey year ending March 2016. These crime types have shown somewhat different trends compared with those seen for overall CSEW property crime (Figure 3).
“Other household theft” mostly includes theft from outside a dwelling but also includes theft from inside the home where the offender had the right to be there; for example, workmen or an acquaintance of the victim. These offences peaked in 1993 and then declined until the survey year ending March 2008 (778,000 offences). This was then followed by a brief upward trend, until the survey year ending March 2012, when a further general decline in “other household theft” began. The survey year ending March 2016 estimate (672,000 offences) is the lowest recorded since the introduction of the survey.
Estimates of the volume of theft from the person offences have shown only a slight downward trend over the period from the late 1990s. However, over the last 2 financial years the rate of change has been more pronounced. In the latest survey year, a non-significant fall of around 19% was seen compared with the previous survey year. In contrast, in the latest year theft from the person offences recorded by the police have increased by 6% compared with the previous year.
Since these are relatively low volume offences, CSEW estimates may be more volatile than for other offence types. Additionally, much of this fall (77%) resulted from a statistically significant reduction in attempted thefts within this offence category. Attempted thefts are less likely to be reported to the police in the first instance and be visible within trends based on police recorded crime. In the current survey year, it was estimated only 9% of attempted snatch or stealth thefts were reported to the police, compared with an average of 46% of actual snatch or stealth thefts.
Bicycle theft peaked in 1995 and then declined until around the early 2000s. Since the survey year ending March 2003, while the overall trend has remained relatively flat, there has been some year-on-year fluctuation.
Robbery has remained a low volume offence across the history of the survey, typically accounting for around 2% to 3% of CSEW property crime. Levels have fluctuated from year to year and showed a small upward trend during the 1990s, peaking in the 1999 survey, before falling to levels similar to those seen in the 1980s. However, it should be noted that owing to the small number of robbery victims interviewed, CSEW estimates have large confidence intervals and are prone to fluctuation from year to year (User Guide Tables UG2 to UG9).
There is no clear trend within the estimates for property crime experienced by children aged 10 to 15 and data are only available from the survey year ending March 2010 onwards. The relatively small number of children aged 10 to 15 interviewed by the CSEW means that the estimates for crime experienced by children aged 10 to 15 are prone to substantial year-on-year fluctuation.
Figure 5: Long-term trends in Crime Survey for England and Wales other household theft, theft from the person, bicycle theft and robbery, year ending December 1981 to year ending March 2016
Source: Crime Survey for England and Wales, Office for National Statistics
Notes:
- Prior to the year ending March 2002, CSEW respondents were asked about their experience of crime in the previous calendar year, so year-labels identify the year in which the crime took place. Following the change to continuous interviewing respondents' experience of crime relates to the full 12 months prior to interview (i.e. a moving reference period), so year-labels from the year ending March 2002 onwards identify the CSEW year of interview.
Download this chart Figure 5: Long-term trends in Crime Survey for England and Wales other household theft, theft from the person, bicycle theft and robbery, year ending December 1981 to year ending March 2016
Image .csv .xlsPolice recorded property crime
For the last 3 years, while property crimes recorded by the police have remained relatively flat, overall police recorded crime has seen some consecutive rises. Much of the rise in overall police recorded crime is thought to be down to improved recording practices and processes resulting from changes implemented following the recent HMIC inspections.
These improvements are likely to have had a broader impact on recording, which has also impacted on some property crimes. For example, the HMIC inspection noted that across all police forces, only an estimated 67% of offences that should have been recorded as violent offences, were recorded as such, whilst 86% of criminal damage offences were recorded correctly. While recording improvements are likely to have been more pronounced for violent offences, they may also have had some impact on the more accurate recording of other offences, such as criminal damage.
Over the longer-term, property crime has shown year-on-year falls and, while in the latest year an increase of 2% was recorded, the volume of police recorded property crime (2,970,843 offences) is still 38% lower than in the year ending March 2003 (4,821,745 offences). This represents a faster rate of reduction than overall police recorded crime, which fell by 25% over the same period. Thus, the proportion of total police recorded crime accounted for by property crime has decreased by 15 percentage points; from 81% in the year ending March 2003 to 66% in the year ending March 2016.
Figure 6: Trends in total police recorded crime and police recorded property crime in England and Wales, year ending December 1981 to year ending March 2016
Source: Police recorded crime, Home Office
Notes:
- Police recorded crime data are not designated as National Statistics.
- Following changes to the Home Office Counting Rules (HOCR) in 1998 and the introduction of the National Crime Recording Standard (NCRS) in 2002, data from the year ending March 2003 onwards are not directly comparable with earlier years; nor are data between the year ending March 1999 and the year ending March 2002 directly comparable with data prior to the year ending March 1999
- Data from March 2012 onwards is not directly comparable with previous years. Fraud offences recorded by Action Fraud and the National Fraud Intelligence Bureau (through Cifas and Financial Fraud Action UK) have been included from the year ending March 2012 onwards.
Download this chart Figure 6: Trends in total police recorded crime and police recorded property crime in England and Wales, year ending December 1981 to year ending March 2016
Image .csv .xlsSimilar to the CSEW, police recorded vehicle offences and burglary have shown the largest decreases in volume between the years ending March 2003 and March 2016 (vehicle offences were down by 66%, to 366,647 offences and burglary was down by 55%, to 401,026 offences) (Figure 7). While the most recent year-on-year comparisons show increases in vehicle offences (section 6 provides further information), these long-term decreases, alongside decreases in burglary, have been the main drivers of the overall downward trend in property crime recorded by the police.
The longer-term reduction in vehicle offences should also be seen in the context of increases in the total number of vehicles licensed, which has risen by 20% in Great Britain compared with 2003 (Vehicle Licensing Statistics Quarter 2 2016). The long-term declines in vehicle-related offences seen in the CSEW and police recorded crime are substantial given the rise in the number of motor vehicles.
The long-term trend for “all other theft offences” has been generally downward, other than a short period of increases between the years ending March 2010 and March 2012 (Figure 7). “Other theft offences” – the largest subcategory of “all other theft offences” – includes theft of both personal property such as wallets or phones and property from outside people’s homes, such as garden furniture, as well as metal theft from businesses.
The “other theft offences” subcategory, which comprises mostly theft of unattended items, accounted for 71% (344,950 offences) of the overall “all other theft offences” category (486,217 offences) in the year ending March 2016. The police recorded “other theft offences” subcategory includes crimes against businesses and other organisations not covered by the CSEW, but it is not possible to separately identify thefts against such victims in centrally held police recorded crime data (this type of crime is covered by the Commercial Victimisation Survey for some business sectors).
“Other theft offences” have seen a 4% decrease in the year ending March 2016 compared with the previous year, consistent with declining trends seen over the last 3 years. A short period of increase was seen between the years ending March 2010 and March 2012. This rise was thought to have been driven by a surge in metal theft over this period, which corresponds with a spike in world commodity prices. Recent evidence suggests that such offences are now decreasing and should be seen in the context of metal theft legislation which came into force in May 2013 (further information is given in section 5).
This fall in “other theft offences” has offset smaller volume rises in other subcategories such as; making off without payment (a rise of 5,134 offences) and blackmail offences (a rise of 2,398 offences) resulting in only a small overall fall (1%) in “all other theft offences”.
Figure 7: Trends in selected police recorded theft offences in England and Wales, year ending March 2003 to year ending March 2016
Source: Police recorded crime, Home Office
Notes:
- Police recorded crime data are not designated as National Statistics.
Download this chart Figure 7: Trends in selected police recorded theft offences in England and Wales, year ending March 2003 to year ending March 2016
Image .csv .xlsExisting theories on why property crime has fallen
The reduction in property crime has been an important factor in driving falls in overall crime and various theories have been put forward to explain these falls. Many of them are contested and subject to continuing discussion and debate4. A broad range of factors such as drug consumption, the removal of lead from petrol, internet usage, forensic investigation techniques, legalised abortion, infrastructure deterrents such as CCTV, prison sentencing and police activity have all been suggested as being linked to changes in crime levels. A fuller discussion of these theories can be found in Focus on property crime, year ending March 2015.
Increased quality of building and vehicle security is likely to have been a factor in the reduction in property crime. This concept of “target-hardening”, which makes targets (that is, anything that an offender would want to steal or damage) more resistant to attack, is likely to deter offenders from committing crime (Cornish and Clarke, 2003). The recent Home Office research report ‘Reducing criminal opportunity: vehicle security and vehicle crime’ suggests that while security is not the only factor of relevance, some vehicle security improvements have positively impacted vehicle crime reduction.
Findings from the CSEW add some evidence to support this view point. There have been statistically significant reductions in vehicle-related theft resulting from offenders gaining entry by forcing locks (39% of vehicle-related theft incidents in the 1995 CSEW; compared with 14% in the latest survey year) or breaking windows (40% of vehicle-related theft incidents in the 1995 CSEW; compared with 23% in the latest survey year).
Additionally, the CSEW indicates that alongside the falls in property crime, there were also improvements in household security. Since 1995, there have been statistically significant increases in the proportion of households in the latest survey year5 (‘Nature of Crime’ Table 3.12) with:
- window locks (up 21 percentage points from 68% to 89% of households)
- light timers and sensors (up 16 percentage points from 39% to 56% of households)
- double and dead locks (up 12 percentage points from 70% to 82% of households)
- burglar alarms (up 11 percentage points from 20% to 31% of households)
Notes for falling long-term trends in property crime:
- CSEW trend data does not currently include fraud.
- Thefts from inside a dwelling (referring to incidences in which the offender had the right to be there, in contrast to domestic burglary, where the offender did not have the right to be there) and thefts from outside a dwelling.
- Thefts of property being held or carried by someone, but no or minimal force is used (in contrast to robbery, where non-minimal force, or the threat of, is used).
- ONS does not endorse any one of the theories over the others.
- Sourced from ‘Nature of burglary, 2007/08’ tables (the latest published data on home security measures from the 1996 CSEW).
5. Continued falls in metal theft
Main points
There were 16,155 metal theft offences recorded by the police (42 forces) in the year ending March 2016, a decrease of over a third (38%) compared with the same forces for the previous year.
Over the same period (for the same 42 police forces) infrastructure-related metal theft offences, which include those that have a direct impact on the functioning or structure of buildings or services, decreased by 36% while non-infrastructure-related metal theft decreased by 40%.
There were 3 metal theft offences per 10,000 population in England in Wales in the latest year.
Rates of metal theft offences have remained highest in the Northern regions, with the North East recording 7 offences per 10,000 population. However, all regions have shown similar patterns of metal theft trends with year-on-year decreases.
Police recorded crime
Metal theft refers to the theft of items for the value of their constituent metals, rather than the attainment of the item itself. There is no specific offence classification for metal theft and so it is not possible to identify such crimes with the main police recorded crime figures. However, a separate data collection from police forces was established by the Home Office in April 2012 to identify the extent of metal theft offences. Appendix tables 16 to 19 provide more detailed information.
Police forces can flag offences that involve metal theft as either infrastructure or non-infrastructure-related. Infrastructure-related thefts involve the removal of metal that has a direct impact on the functioning or structure of buildings or services. This includes the theft of live services such as railway cabling, lead roofing from churches and historical buildings and copper cabling from power supplies. Non-infrastructure-related thefts involve the removal of metal that has no direct impact on the functioning or structure of buildings or services. This includes the theft of redundant metals, abandoned vehicles and gates and fencing.
Metal theft offences affect a range of sectors; notably telecommunications, transport services, power suppliers and heritage sites. Metal theft offences can cause major disruptions to passenger travel when public transport services are targeted and impact on communities when heritage sites, such as protected buildings and churches are targeted, resulting in the loss of our cultural heritage. Metal theft offences have costs to the bill payer in terms of repair, labour and security and prevention measures.
Table 1 shows there were 16,155 metal theft offences recorded by 42 police forces1 in England and Wales, including the British Transport Police, in the year ending March 2016; this represents a decrease of over a third (38%) compared with the same forces for the previous year. Table 1 also provides a breakdown by infrastructure and non-infrastructure-related offences. In the year ending March 2016, of all metal theft offences recorded, 44% were infrastructure-related and 56% were non-infrastructure-related.
Table 1: Metal theft offences recorded by the police in England and Wales, year ending March 2013 to year ending March 2016
| England and Wales | ||||||||||||
| Apr '12 to Mar '13 | Apr '13 to Mar '14 | Apr '14 to Mar '15 | Apr '15 to Mar '16 | |||||||||
| Number of offences | ||||||||||||
| Metal theft (42 forces)2 | 62,467 | 41,087 | 26,153 | 16,155 | ||||||||
| All metal theft (44 forces) | N/A | 42,206 | 27,237 | N/A | ||||||||
| Proportions3 | ||||||||||||
| Infrastructure related | 51 | 47 | 42 | 44 | ||||||||
| Non-infrastructure related | 49 | 53 | 58 | 56 | ||||||||
| Source: Police recorded crime, Home Office | ||||||||||||
| 1. Police recorded crime data are not designated as National Statistics. | ||||||||||||
| 2. Excludes Norfolk and Suffolk. | ||||||||||||
| 3. The proportion of offences which are infrastructure and non infrastructure related are based on a subset of forces. 38 forces used for the year ending March 2013 excluding Cleveland, Norfolk, Leicestershire, Devon and Cornwall, North Wales and West Midlands. 43 forces used for the year ending March 2014 and 2015 which only excludes Devon and Cornwall. 41 forces used for the year ending March 2016, excluding Devon & Cornwall, Suffolk and Norfolk. Forces excluded for providing partial data. | ||||||||||||
Download this table Table 1: Metal theft offences recorded by the police in England and Wales, year ending March 2013 to year ending March 2016
.xls (31.7 kB)The overall decline in metal theft offences recorded has occurred alongside government initiatives to tackle the prevalence of metal theft. The National Metal Theft Taskforce was introduced in November 2011 and Operation Tornado was introduced in January 2012 (see Focus on Property Crime 2014 to 2015 for more information). The Scrap Metal Dealers Act was implemented in 2013, which included the banning of cash payments for scrap metal and for all metal sellers to provide proof of identity at the point of sale. The act required all individuals and businesses to obtain a scrap metal dealer’s licence and for dealers to keep intensive records of their suppliers.
Metal theft by region
Across England and Wales2, the police recorded 3 metal theft offences per 10,000 population in the latest year. Rates of metal theft offences have remained higher in the northern regions than in the southern and Midlands regions and Wales. The North East had the highest rates of metal theft offences in the latest year, with 7 per 10,000 population. However, all regions have shown similar patterns of metal theft trends with year-on-year decreases; with northern regions showing smaller decreases (Appendix tables 16 to 19).
Metal theft by offence type
The Home Office Data Hub (HODH) collects record level crime data supplied by police forces and from these data it is possible to gain further detail, including the specific types of offences flagged as metal theft. The following analysis uses data from 21 forces that provided metal theft data via the HODH that was of sufficient quality for the year ending March 2016.
Figure 8 shows that in the year ending March 2016, of all metal theft offences recorded by the police 56% were part of the offence classification “all other theft offences”, which is principally made up of thefts of unattended items. This was followed by burglary and vehicle offences which accounted for 23% and 19% of all metal theft offences respectively. Of all burglary offences involving metal theft, 72% were recorded as non-domestic burglary, with the remaining 28% of offences recorded as domestic burglary.
Figure 8: Metal theft offences recorded by the police in England and Wales, by offence type, Home Office Data Hub(21 forces), year ending March 2016
Source: Police recorded crime, Home Office Data Hub
Notes:
- Police recorded crime data are not designated as National Statistics.
- Data based on 21 forces that provided accurate data via the Home Office Data Hub.
- Percentages do not add up to 100 as a small proportion of metal theft offences (less than 1%) fall into categories which are not property crime related and are therefore not included in this analysis.
Download this chart Figure 8: Metal theft offences recorded by the police in England and Wales, by offence type, Home Office Data Hub(21 forces), year ending March 2016
Image .csv .xlsNotes for continued falls in metal theft:
- Norfolk and Suffolk did not provide metal theft data for the year to March 2016.
- Excluding Norfolk and Suffolk, who did not provide data for the year ending March 2016.
6. Recent trends within police recorded property crime
The number of offences recorded by police forces in England and Wales, increased in comparison with the previous year for the categories of vehicle offences, and criminal damage and arson. Administrative data from the National Fraud Intelligence Bureau (NFIB) also show an increase in fraud.
While overall theft has remained fairly steady, some individual categories (for example, shoplifting and theft from the person) have shown recent increases, while others (for example, bicycle theft and burglary) showed decreases compared with the previous year.
In comparison, none of the property offence categories from the year ending March 2016 Crime Survey for England and Wales (CSEW) showed any significant upward change compared with the previous survey year.
Shoplifting
The longer-term trend in shoplifting recorded by the police is different from that seen for other theft offences. While most theft offences saw steady declines over much of the last decade, incidents of recorded shoplifting have shown comparatively little change over this time (Figure 9).
Shoplifting accounted for 7% of all police recorded crime in the year ending March 2016. The police recorded 336,505 shoplifting offences in this period, a 3% increase compared with the previous year and the highest volume since the introduction of the NCRS in the year ending March 20031. There were reported increases in 28 of the 44 police force areas in the year ending March 2016.
The 2015 Commercial Victimisation Survey (CVS)2 provides an alternative measure of shoplifting (referred to in the survey as “theft by customers”); it includes crimes not reported to the police as well as those that have been reported. The 2015 CVS suggests a non-statistically significant rise in the rate of shoplifting compared with the 2014 CVS. The estimates have large confidence intervals and it is therefore difficult to detect significant changes over time. Whilst combined these sources suggest there may be some genuine rise in shoplifting offences, it should also be noted that other data from the CVS also shows that, while thefts by customers have shown a non-significant increase, the rate of thefts from unknown persons has fallen significantly, from 3,202 to 1,207 incidents per 1,000 premises. This may represent a shift of some thefts from the “unknown” category into “theft by customers”, suggesting that the perpetrators of more thefts have been identified as customers.
Further information on the nature of shoplifting comes from the British retail consortium (BRC) survey published in 2015, which indicates a new high in terms of the cost to retailers of shop theft. In the year ending March 2015, the incidence rate of customer theft per 100 premises within the retail sector fell by 2% compared with the year ending March 2014. However, over the same period, the average value per incident rose by 35% from £241 to £325, continuing the increase reported in the prior year. The BRC concluded that the upward trend in the value of these offences was due to the continued impact of organised gangs stealing higher value items to sell on.
Figure 9: Trends in police recorded shoplifting offences in England and Wales, year ending March 2003 to year ending March 2016
Source: Police recorded crime, Home Office
Notes:
- Police recorded crime data are not designated as National Statistics.
Download this chart Figure 9: Trends in police recorded shoplifting offences in England and Wales, year ending March 2003 to year ending March 2016
Image .csv .xlsVehicle offences
The police recorded crime category of vehicle offences has seen an increase of 15,227 incidents (4%) in the year ending March 2016, compared with the previous year. This is the first increase in this offence category since the year ending March 2006.
The largest contributor to this volume increase was “vehicle interference” (making up 48% of the rise), followed by “theft or unauthorised taking of a motor vehicle” (making up 39%). “Theft from a vehicle” also increased (by 1%) for the first time since the comparable time series began (year ending March 2003). Despite such a small year-on-year percentage increase, this sub-category contributed 11% to the total volume increase in vehicle offences.
Vehicle interference increased by 19% (from 38,254 to 45,580 offences) in the year ending March 2016 compared with the previous year. This annual increase represents a slowing of the rate of increase compared with a year earlier (year ending March 2015) when this offence rose by 88% compared with the previous year. Some of these continued rises are likely to be the result of a change in the guidance issued in April 2014 within the Home Office Counting Rules (HOCR). The impact is likely to have led to offences that previously might have been recorded as “attempted theft of, or from, a vehicle” or “criminal damage to a vehicle” now being recorded as vehicle interference where the motive of the offender was not clear. While in the previous year, offence numbers for these categories fell as vehicle interference increased; the current year shows increases in all vehicle offence categories, making it hard to unpick the effect of recording changes.
The increase in “theft or unauthorised taking of a motor vehicle” may in part be caused by a continued increase in 2-wheeled vehicle thefts (these vehicles typically do not have immobilisers and may be easier for offenders to target). A research paper by the Home Office, (Reducing criminal opportunity: vehicle security and vehicle crime, 2015) noted that within the Metropolitan police force area, comparing the data for the year ending March 2012 and March 2014, the slight rise in vehicle thefts was due to an increase in the theft of motorbikes. Whereas car thefts in 2014 were down by 15% compared with 2012 (equating to around 2,800 fewer offences), motorbike thefts had increased by 44% (around 2,900 extra offences). This paper also cited separate but unpublished analysis by the Retail Motor Industry Federation (RMIF). This analysis used data from the Police National Computer for the whole of England and Wales and also suggested a rise in motorcycle thefts during 2014.
Additionally, it has been suggested that new technology may be changing vehicle security dynamics, because tools are available (and available to buy via the internet) that allow thieves to bypass current car security. As a result of this, it has been suggested that “electronic immobilisers in cars are now more prone to getting hacked”. (Choudhuri et al., 2014; Mason, 2012). The latter suggestion was also explored further in “Reducing criminal opportunity: vehicle security and vehicle crime” and it was noted that, while the technology to overcome electronic immobilisers certainly exists and is available, current theft rates suggest it is not being used by a large number of offenders (relative to the 1990s). The extent to which this is impacting on vehicle theft rates is currently unclear.
A small increase of 5% (from 5,414 to 5,686 offences) was also seen in aggravated vehicle taking recorded by the police in the latest year.
Theft from the person
Theft from the person involves offences where there is theft (or attempted theft) of property, while the property is being carried by, or on the person of, the victim. These include snatch thefts (where a minimal element of force may be used to snatch the property away) and stealth thefts (where the victim is unaware of the offence being committed, for example, pick-pocketing). Unlike robbery, these offences do not involve violence or threats to the victim.
Most theft offences saw steady declines in the number of crimes recorded by the police over much of the last decade. Levels of recorded theft from the person, although generally declining since the year ending March 2003, saw a period of year-on-year increases between the years ending March 2008 and March 2013. Over this period there was an average annual increase of 5% in theft from the person offences recorded by the police. In the subsequent 2 years, the downward trend resumed and the number of theft from the person offences recorded by the police fell by 20% between the years ending March 2014 and 2015. The most recent data shows a 6% increase in these offences compared with the previous year (Figure 10).
It is thought that the increase seen in these offences between the years ending March 2009 and March 2013 may be due to people carrying more valuable items than previously, such as more advanced smartphones and tablet computers which attract a high value in the stolen goods market. Since this time, the concept of “target-hardening” (a term referring to the strengthening of the security of an item or building in order to reduce the risk of attack or theft), has also been applied by providers of mobile phones and this provides a good illustration of how both the value of and “target hardening” of items can affect crimes. Home Office research suggests that the introduction of device-based anti-theft solutions (such as Apple iOS7 in September 2013 and Samsung Reactivation Lock in April 2014) is likely to have contributed to a substantial reduction in mobile phone thefts in London. If this was the case across wider geographies, this could help explain year-on-year falls in theft from the person offences in March 2014 and March 2015.
Figure 10: Trends in police recorded theft from the person offences in England and Wales, year ending March 2003 to year ending March 2016
Source: Police recorded crime, Home Office
Notes:
- Police recorded crime data are not designated as National Statistics.
Download this chart Figure 10: Trends in police recorded theft from the person offences in England and Wales, year ending March 2003 to year ending March 2016
Image .csv .xlsThe most recent 6% rise in thefts from the person recorded by the police, reflects rises in offence numbers in around two-thirds of police forces. While it is not clear what has driven the latest increase, the CSEW indicates that the majority of offences involve; theft of purses or wallets, or cash or foreign currency, mobile phones or credit cards. Specifically, wallets or purses continue to be stolen in a high proportion (41%) of theft from the person offences along with cash or foreign currency, mobile phones and credit cards (40%, 37% and 34% respectively). Owing to the value associated with these items, and because crime reporting is often necessary for insurance purposes, a high proportion of these offences are likely to be recorded by the police.
Criminal damage and arson
Crimes recorded by the police show a 7% rise (539,767 offences) in criminal damage and arson offences between the year ending March 2015 and the year ending March 2016. Rises were seen across all offences which sit within the criminal damage and arson offence category. These rises were also seen consistently across 40 out of the 44 police forces in England and Wales (including the British Transport Police). In the year ending March 2016, criminal damage to a vehicle rose by 6% and other criminal damage rose by 12% compared with the previous year (despite both offence types increasing by a similar volume of around 12,000 offences); criminal damage to a dwelling also increased (by 7,274 offences; 6%).
In contrast, criminal damage as measured by the CSEW fell by 9% in the latest survey year. Falls were seen in both CSEW sub-categories; criminal damage to a vehicle (fell non-significantly by an estimated 46,000 offences or 5%) and arson and other criminal damage (fell significantly by 81,000 offences or 18%). With this in mind, the increases across all criminal damage offences recorded by the police, fairly simultaneously (and across the majority of police forces) may suggest that the offence of criminal damage has been impacted by the recording improvements made across police forces as a response to the recent inspections by Her Majesty’s Inspectorate of Constabulary (HMIC) previously discussed in this bulletin, as well as to ongoing audits by HMIC.
Notes for recent trends within police recorded property crime:
- An update to these figures (for the year ending June 2016), show a further rise in shoplifting, where offence numbers reached 340,719.
- Results from the 2015 CVS survey relate to interviews carried out between August and December 2015, when interviewers asked about the incidents of crime experienced in the 12 months prior to interview. This is an earlier time period than police recorded crime figures which cover crimes recorded in the year ending March 2016.
7. What is happening to trends in fraud
The police recorded crime series incorporates offences reported to Action Fraud (the national fraud and cybercrime reporting centre) as well as those reported to the National Fraud Intelligence Bureau (NFIB) by 2 industry bodies: Cifas and Financial Fraud Action UK (FFA UK). These sources show that fraud offences increased by 4% in the latest year, compared with the previous year. However, there are several complications in using these sources to measure trends AND the level of fraud reported via administrative sources is thought to significantly understate the true level of such crime.
FFA UK also collects information from its members on a broader range of bank account and plastic card frauds than those referred to the NFIB using a system referred to as CAMIS. While these figures are at UK level only, they offer a broader picture of the scale of bank account and plastic card fraud and can give an indication of longer-term trends for these particular fraud offences.
New Experimental Statistics provided by Crime Survey for England and Wales (CSEW) fraud questions do include crimes that have not been reported to the authorities. However, they do not capture fraud against organisations and being new, they do not yet provide any information on trends in fraud offences. Early estimates show that amongst CSEW crimes, fraud has the highest prevalence rate.
Separate data from the supplementary module in the CSEW asking about respondents’ experiences of plastic card fraud do provide some information about trends, albeit for this sub-category of fraud alone.
Recorded fraud offences
Fraud offences increased by 4% (to 619,674) in the year ending March 2016 compared with the previous year. Much of the increase was owing to fraud offences referred by Cifas, which increased by 16% (up to 298,968) compared with the previous year. In contrast, fraud offences recorded by Action Fraud decreased by 4% (down to 221,160) and those referred by FFA UK decreased by 5% (down to 99,546 offences) compared with the previous year. Changes in the volume of offences recorded by Action Fraud, coincided with a change in service provider for the Action Fraud call centre. It is likely that the level of fraud in the latter part of the year ending March 2016 may have been subject to under-reporting. As a result the latest trends in Action Fraud data should be interpreted with caution.
The largest increase in the separate categories of fraud referred to the NFIB in the latest year was “Banking and credit industry” fraud (up 15% to 367,812 offences). Almost all of this increase was in offences reported to the NFIB via Cifas (up 28% to 242,721 offences). This rise was seen principally in the sub-category of frauds relating to “Cheque, plastic card and online bank accounts” and is thought to have resulted from an increase in the volume of accounts used to purchase goods that have been set up using stolen identities and personal information (for example, applying to open a plastic card account using the identity of an innocent party and purchasing goods on it).
A limited time series for fraud reported to the NFIB is available back to the year ending March 2012. Although fraud offences over recent years appear to have been increasing while many other forms of property crime have fallen, trends in fraud over this period are difficult to interpret owing to a number of changes in reporting and recording such as the transfer in reporting fraud offences from police forces to Action Fraud. This is discussed in more detail in Crime in England and Wales, year ending March 2016.
CSEW
Experimental Statistics from new fraud and computer misuse questions that were added to the CSEW from October 2015 are unable to tell us more about trends in fraud but give some initial estimates of the extent of fraud victimisation amongst the resident household population. Adults aged 16 and over experienced an estimated 5.8 million fraud and computer misuse incidents in the 12 months prior to interview; 3.8 million of these were fraud incidents and 2.0 million were computer misuse incidents1.
The most common types of fraud experienced were “Bank and credit account” fraud (2.5 million incidents; 66% of the total), followed by “Non-investment” fraud – such as fraud related to online shopping or fraudulent computer service calls (1.0 million incidents; 28% of the total).
Data from the separate supplementary module on plastic card fraud is currently the most reliable measure of trends for this form of banking fraud (these questions have been included in the survey since the survey year ending March 2006). Estimates from this separate question showed that 4.7% of plastic card owners were victims of card fraud in the latest survey year, a similar level to the previous survey year (4.6%). The trend in levels of plastic card fraud measured by this supplementary module has remained fairly stable over the last few years, following a rise between the survey years ending March 2006 and March 2010 and a subsequent fall between the survey years ending March 2010 and March 2012.
Other sources of fraud data
Data referred to the NFIB by Cifas and FFA UK are known to exclude a significant volume of card and bank account fraud. Cifas do not collect information on some types of plastic card fraud, including “Remote purchase” frauds2, fraud resulting from cards being lost or stolen, or ATM fraud. While FFA UK does collect this information, it only refers crimes to the NFIB in cases where there is intelligence value for the police to aid in investigating and detecting fraud.
FFA UK does collect information from its members on a broader range of bank account and plastic card frauds than those referred to the NFIB using a system referred to as CAMIS. In the latest year, FFA UK reported 1.7 million cases of frauds on UK-issued cards, cheque fraud and remote banking fraud (internet, telephone and mobile banking)3, an increase of 32% from the previous year. This compares with a 5% decrease in the level of these frauds that were reported by FFA UK to the NFIB4. FFA UK have attributed recent rises to “the growth of impersonation and deception scams and complex online attacks where the methods target customers’ personal and financial details, including card data, to facilitate fraud” including remote purchase fraud. They also comment on the increase in fraud relating to lost and stolen cards suggesting that “intelligence from FFA UK members suggests there have been more incidents at ATMs, through distraction thefts and entrapment. Courier scams, in which a scammer visits the victim’s house to collect either cash or a bank card, also continue to play a role” (January to June 2016 fraud update).
In general, the FFA UK figures have been consistent with those shown by the CSEW trend in plastic card fraud, with levels peaking around 2008 to 2010 followed by falls in subsequent years that were likely to be related to the introduction of chip card technology. In the latest year, there was a small (non-statistically significant) increase in the prevalence of plastic card fraud measured by the CSEW. In the year to March 2016, FFA UK data from CAMIS showed a 32% rise in banking offences. More recent data released in Crime in England and Wales, year ending June 2016 show further non-statistically significant rises in CSEW plastic card fraud.
Alongside “Crime in England and Wales, year ending March 2016”, we published an “Overview of fraud statistics” article; this outlines the definitions used in fraud statistics for England and Wales, describes the main sources of data and provides an overview of what these sources tell us about long-term trends, the characteristics of victims and the nature and circumstances of fraud offences.
Notes for what is happening to trends in fraud:
- These data are only based on interviews with half of the sample of respondents conducted during the second half of the survey year, but have been grossed up to provide an estimate covering the entire survey year.
- Those frauds where the cardholder and card are not present at the point of sale, such as use of the card online, over the phone or by mail order.
- It is important to note that the number of cases relates to the number of accounts defrauded, rather than the number of victims.
- The cases reported to the NFIB are those with intelligence value to the police and are less likely to include incidences of “Remote purchase” fraud, which are an important driver in the overall increase in FFA UK data from CAMIS.
8. Levels of victimisation
Victimisation
Data on the prevalence of property crime from the Crime Survey for England and Wales (CSEW), year ending March 2016, suggest households were most likely to be a victim of vehicle-related theft or criminal damage (both 4% or 4 in 100 households) than other household property crimes. Personal crimes such as theft from the person and robbery were lower in volume and currently affect an estimated 0.7% of the population (or 7 in 1,000 adults) and 0.3% (or 3 in 1,000 adults) respectively.
The most noticeable difference in the proportion of households affected by crime between the latest survey year and the peak survey year in 1995 was in vehicle-related theft. These offences decreased from around 1 in 5 vehicle-owning households experiencing a vehicle-related theft in 1995 to 1 in 25 in the last 12 months, according to the survey in the year ending March 2016.
Levels of victimisation vary by property crime type (Figure 11). In the latest survey year, 1 in 25 vehicle-owning households had experienced vehicle-related theft and just under 1 in 25 households had experienced criminal damage. In contrast a much lower number of adults had been a victim of theft from the person (only 7 in 1,000 adults) or robbery (3 in 1,000 adults).
Around 3 in 50 children aged 10 to 15 had been a victim of personal theft1 and around 1 in 50 had been a victim of criminal damage to personal property.
Comparing victimisation rates in 1995 (when crime was at its peak) with the latest survey year:
- the most noticeable difference is in vehicle-related theft, which decreased from around 1 in 5 vehicle-owning households experiencing a vehicle-related theft in 1995 to 1 in 25 in the latest survey year
- criminal damage has shown a decrease from around 1 in 10 households experiencing criminal damage in 1995 to fewer than 1 in 25 in the latest survey year
- domestic burglary has also shown a decrease from just under 9 in 100 households experiencing domestic burglary in 1995 to only 2 in 100 in the latest survey year
- personal crimes, such as theft from the person, are lower in volume but have shown smaller decreases; 16 in 1,000 adults (1.6%) experienced theft from the person in 1995 compared with around 7 in 1,000 (0.7%) in the latest survey year
Figure 11: Property crime victimisation, year ending December 1995 and year ending March 2016 Crime Survey for England and Wales

Source: Crime Survey for England and Wales, Office for National Statistics
Notes:
- Vehicle-related theft victimisation rates relate to vehicle-owning households only.
- Bicycle theft victimisation rates relate to bicycle-owning households only.
- Data for 1995 are unavailable for children aged 10 to 15.
- Experimental Statistics, based on 6-months of data only.
Download this image Figure 11: Property crime victimisation, year ending December 1995 and year ending March 2016 Crime Survey for England and Wales
.png (24.1 kB) .xls (20.5 kB)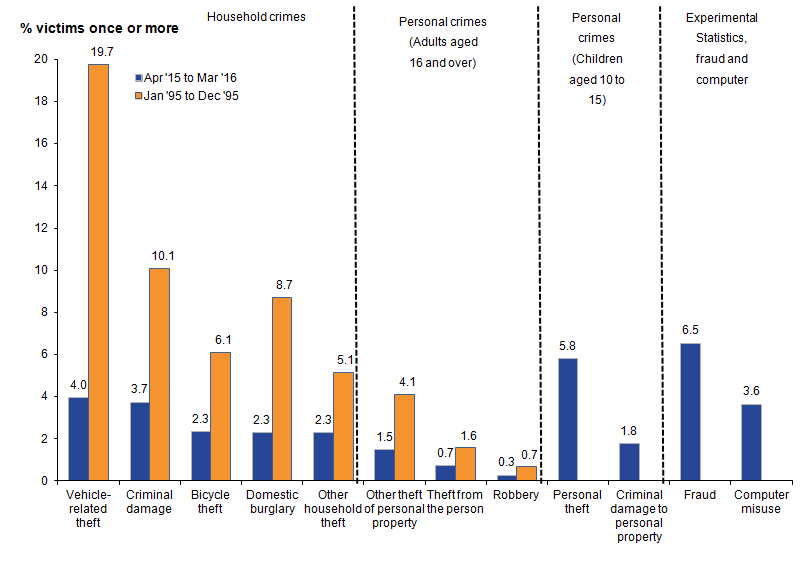
Experimental Statistics based on new fraud questions in the year ending March 2016 CSEW suggest fraud against adults (from the resident household population) is currently a relatively high prevalence crime, affecting 6.5% of adults. This is still far lower than the prevalence rate for both criminal damage and vehicle-related theft at the crime peak in 1995 and it therefore does not appear that substitution into fraud can explain why overall CSEW property crime has fallen.
The levels of victimisation experienced by children aged 10 to 15 years show a higher level than adult victimisation rates for all crime types in the latest year (Figure 11). This is because data from the CSEW show that crimes against 10-to-15-year olds are different in nature compared with those against adults. For example, the majority of personal theft offences against children were carried out by a pupil at their school (61%) or a friend (23%) and took place in or around school (70%). The “Nature of Crime” tables accompanying this release have further details on the data contained within this section.
Notes for levels of victimisation:
- Personal theft includes: theft from the person (stealth theft, snatch theft and attempted snatch or stealth theft) and “other” theft of personal property, but also theft from inside and outside a dwelling and theft of bicycles where the property stolen belonged solely to the child respondent.
9. Characteristics associated with being a victim of property crime
Some demographic and household characteristics may be closely associated with each other, so caution is needed in the interpretation of the effect of these different characteristics when viewed in isolation (for example, employment and household income are closely related). However, some of these characteristics show a similar relationship to victimisation across the majority of traditional property crime types. Experimental Statistics on fraud and computer misuse from the Crime Survey for England and Wales (CSEW) show less variation across demographic and household characteristics. Appendix tables 1 to 11 contain victimisation data broken down according to a broad range of household and personal characteristics.
Similar to findings from previous years, in the latest survey year some general patterns in victimisation were similar across most types of CSEW property crime:
- respondents living in areas with the highest unemployment levels1 are more likely to be victims than those who lived elsewhere
- those living in urban areas were more likely to be victims than those living in rural areas for all property crime types
- respondents living in households in areas of high incivility2 were more likely to be victims than those living in households in areas of low incivility
- there was a pattern across almost all offence types (though not all the differences were statistically significant) where those who were unemployed were more likely to be victims compared with those in other occupational groups3
- while not statistically significant for all crime types, there was a general pattern in which private and social renters were more likely to be victims than owner occupiers
Additionally, other demographics factors also showed relationships with victimisation but these relationships varied by crime type.
Age groups had different relationships with victimisation depending on the type of offence in question. In general those aged 16 to 24 were more likely to be victims of crime than those in older age groups (for example, than those aged 65 and over for domestic burglary, vehicle-related theft and other household theft; and than those aged 35 and over for bicycle theft, robbery and theft from the person). Those in the older age group (75 and over) were significantly less likely than any other age group to experience criminal damage (1.6%). Those most likely to experience criminal damage were aged between 25 to 54 (4.6%).
In the main, lower income households (£10,000 or less) were more likely to have been victims of crime than higher income households. However, this did not hold true for victims of criminal damage, where those with a household income of less than £10,000 were significantly less likely (2.8%) than those with a household income of £40,000 or more (4.4%) to have been victims. Similarly for vehicle-related theft, those with a household income of £50,000 were more likely (4.9%) to have been victims than those in households with incomes between £10,000 and £40,000 (where risks were between 3.5% and 3.8%).
Levels of victimisation were similar for men and women for most crime types; with the exception of robbery where men had higher rates of victimisation than women (0.4% and 0.2%, respectively).
Fraud
Initial analysis of the year ending March 2016 CSEW Experimental Statistics looked at personal and household characteristics associated with being a victim of fraud (Experimental tables E7 and E8) and found fraud victims to exhibit different patterns of victimisation compared with victims of other CSEW crime types. There was typically less variation than other types of crime in the rate of victimisation across different groups in society, although some personal and household characteristics were associated with being a victim of fraud and those with the higher risk of victimisation often differed from other crime types.
Fraud victimisation was identified as being higher in:
- the middle of the age distribution
- higher income households (of £50,000 or more) than in lower income households (of less than £10,000)
- those in managerial professions as compared to those in a manual or routine profession, unemployed or students
The characteristics of plastic card fraud victims from the separate CSEW sub-module were very similar to those described above (Appendix tables).
Notes for characteristics associated with being a victim of property crime:
- Data are available for England only. There is more information on the employment deprivation indicator, in Section 7.1 of the User Guide. Areas with the highest unemployment are output areas with the 20% highest employment deprivation as measured by the The English Index of Multiple Deprivation (IMD) 2015.
- This term is used in the CSEW to describe a measure based on the interviewer’s assessment of the level of (a) vandalism, graffiti and deliberate damage to property; (b) rubbish and litter; and (c) homes in poor condition in the area.
- Other occupational groups include; Managerial and professional occupations, intermediate occupations, routine and manual occupations, full-time students and those not classified, further information is available in Section 7.1 of the User Guide.
10. Mobile phone theft
The year ending March 2016 Crime Survey for England and Wales (CSEW) suggested 81% of adults (over 46 million people) owned a mobile phone, the same proportion as the previous year.
Data from the latest survey year suggest 1.0% (equivalent to 446,000 people) of mobile phone owners experienced a theft in the previous year. This reflects a decrease from 1.2% in the survey year ending March 2015 and is the second consecutive fall.
Between the survey year ending March 2005 and the survey year ending March 2009, levels of mobile phone theft showed a fairly flat trend, but this was followed by a fall between the years ending March 2009 and March 2010 (from 2.1% to 1.7% respectively). The rate then remained stable until the year ending March 2014 when further drops have occurred. Changes in trends in mobile phone theft from 2010 can be linked to legislation requiring improved security to be incorporated into new phones. More recent falls may be attributable to improved security features on mobile phone operating systems.
Trends
Since April 2005, the CSEW has asked respondents about every household member’s ownership of mobile phones and their experience of mobile phone theft. Data on CSEW mobile phone ownership and theft are shown in Appendix tables 12 to 15.
In the latest survey year, it is estimated that 1.0% (equivalent to 446,000 people) of mobile phone owners experienced a theft in the previous year; a decrease from 1.2% in the survey year ending March 2015. Between the survey year ending March 2005 (when measurement began on the CSEW) and the survey year ending March 2009, levels of mobile phone theft showed a fairly flat trend, but this was followed by a fall between the survey years ending March 2009 and March 2010 (from 2.1% to 1.7%). Since then, the rate has remained consistently below 2%. The largest fall in the proportion of people experiencing mobile phone theft occurred between the survey years ending March 2014 and March 2015, when the rate fell from 1.7% to 1.2%. This has been followed by a further 0.2 percentage point fall in the latest survey year (Figure 12).
Figure 12: Proportion of individual mobile phone owners experiencing theft in the last year, year ending March 2006 to year ending March 2016 Crime Survey for England and Wales
Source: Crime Survey for England and Wales, Office for National Statistics
Notes:
- Information on mobile phone theft was collected about the respondent and all other members of the household.
Download this chart Figure 12: Proportion of individual mobile phone owners experiencing theft in the last year, year ending March 2006 to year ending March 2016 Crime Survey for England and Wales
Image .csv .xlsThe trend in prevalence of mobile phone theft has been similar for males and females. In the latest survey year, 1.0% of both male and female mobile phone owners had their mobile phone stolen, equivalent to around 218,000 males and 227,000 females.
Consistent with previous years, teenagers and young adult mobile phone owners (those aged 18 to 24) were more likely than other age groups to have had their mobile phone stolen (18 to 21: 2.4%; 22 to 24: 2.0%). Children under 10, adults aged 65 to 74 and adults aged 75 or older who own a mobile phone were least likely to have had their phone stolen (0.1%, 0.4% and 0.1% respectively).
It is not clear what caused the fall in mobile phone theft prevalence between the survey years ending March 2009 and March 2010, although they cover a period relatively soon after a charter was launched by the Mobile Industry Crime Action Forum (at the end of 2006) where the majority of mobile phones would be blocked (and hence unusable) within 48 hours of being reported stolen, making them less desirable to criminals.
The latest 0.2 percentage point decrease (representing a reduction of 89,000 victims) in the prevalence of mobile phone theft compared with the previous survey year may be partly explained by improvements to mobile phone security and theft prevention. It has been suggested that there has been a fall in levels of mobile phone theft since the introduction of device-based anti-theft solutions such as Apple iOS7 (September 2013) and Samsung Reactivation Lock (April 2014). The Home Office research paper “Reducing mobile phone theft and improving security, paper 2” published in March 2016 also provides further information on mobile phone ownership and theft, using results from the CSEW and London-specific data from the Metropolitan Police. The London-specific analysis showed that some brands and types of mobile phone, such as Apple, Samsung and Microsoft devices, were more likely to be stolen than others. There are several factors that are likely to affect this, from how desirable a phone is and its potential resale in second-hand markets, to how easy it is to steal the personal data contained within it.
Back to table of contents11. Nature of CSEW property crime
The tables discussed in this section are based on findings from the Crime Survey for England and Wales (CSEW), year ending March 2016 and give a picture of the nature of domestic burglary, theft, criminal damage and crimes against children aged 10 to 15. Nature of crime tables include data on the timing and location of incidents, what was stolen or damaged and the associated costs, the emotional impact on the victim and information about contact with offenders. There is further detail on the data contained in the ”Nature of Crime” tables accompanying this release.
Timing
The year ending March 2016 CSEW showed, as in previous years, that property crimes happened mostly in the evening or night1 (59% of total CSEW property crime). Exceptions to this general pattern were “other” theft of personal property and theft from the person, which were more likely to happen in the daytime (67% and 61% of incidents respectively, Figure 13). As might be expected, the majority of thefts experienced by children aged 10 to 15 took place during daylight2 hours (89%).
Figure 13: Time during day when incidents of property crime occurred, year ending March 2016 Crime Survey for England and Wales
Source: Crime Survey for England and Wales, Office for National Statistics
Notes:
- Morning/afternoon is from 6:00am to 6:00pm; afternoon is from noon to 6:00pm.
- Evening/night is from 6:00pm to 6:00am; night is midnight to 6:00am.
Download this chart Figure 13: Time during day when incidents of property crime occurred, year ending March 2016 Crime Survey for England and Wales
Image .csv .xlsThe timing of victimisation was similar across most crime types (Figure 14). Robbery had the lowest proportion of incidents occurring during the week, at 60% and the highest proportions of incidents occurring during the weekend, at 40%. Looking at property crimes against adults, between 60% and 73% of incidents occurred during the week (this is equivalent to between 13% and 16% per week day3). Although the percentage of incidents occurring at a weekend was generally lower (between 27% and 40%) this was equivalent to a similar proportion of incidents per day (between 11% and 16% per weekend day4).
Figure 14: Time during week when incidents of property crime occurred, year ending March 2016 Crime Survey for England and Wales
Source: Crime Survey for England and Wales, Office for National Statistics
Notes:
- Weekend is from Friday 6:00pm to Monday 6:00am.
Download this chart Figure 14: Time during week when incidents of property crime occurred, year ending March 2016 Crime Survey for England and Wales
Image .csv .xlsIn the latest survey year, 90% of incidents of theft from children aged 10 to 15 occurred during the week (equivalent to 20% per week day) and 10% of incidents occurred during the weekend (equivalent to 4% per weekend day). This means that the likelihood of a child aged 10 to 15 being a victim of theft is much higher during the week and reflects the fact that a large proportion of incidents occurred in or around school (70%) (“Nature of crime” Table 10.1).
Location
Similar to previous findings, in the latest survey year, incidents of vehicle-related theft, criminal damage to a vehicle and bicycle theft most often occurred at or nearby the victim’s home (74%, 72% and 66% respectively) (Figure 15). Looking in more detail at the location of these incidents (“Nature of Crime Tables 4.2, 5.2, and 8.2), bicycle theft was most likely to occur in a semi-private location nearby the victim’s home (49% of incidents), while criminal damage to a vehicle was most likely to occur in the street outside the victim’s home (47% of incidents). Vehicle-related theft was almost equally likely to occur in the street outside the victim’s home (37% of incidents) or in a semi-private location nearby the victim’s home (35% of incidents), such as in or near a row of shared garages, or shared residential car park.
Figure 15: Location of where incidents of property crime occurred, year ending March 2016 Crime Survey for England and Wales
Source: Crime Survey for England and Wales, Office for National Statistics
Download this chart Figure 15: Location of where incidents of property crime occurred, year ending March 2016 Crime Survey for England and Wales
Image .csv .xlsItems stolen
Table 2 shows the items most commonly stolen in different types of property crime where a theft was involved.
The year ending March 2016 CSEW found that “purse, wallet or money” were the items most commonly stolen in incidents of domestic burglary in a dwelling (44%).
Cash and foreign currency6, were the most commonly stolen items in incidents of robbery (44%) and purse or wallet were the most commonly stolen items in incidents of theft from the person (41%) (“Nature of Crime” Tables 3.6 and 7.3).
The changing value of goods and the emergence of new consumer electronics, mobile telephones and computing (such as satellite navigation systems), impact how attractive items are to criminals. According to the latest survey, electrical equipment was stolen in 16% of vehicle-related theft incidents compared with only 3% of incidents in the year ending March 2006.
Ease of removal is also a factor in many property crimes. Results from the latest survey year showed that in incidents of theft from vehicles, the items most commonly stolen were exterior fittings (for example, hub caps, wheel trims, number plates); stolen in 26% of incidents. This was also the case in 1995 where a third of thefts from vehicles, were of external fittings. Conversely other goods such as car radios will have become less attractive to steal. For example, whereas car radios were stolen in around a third of incidences in the 1995 survey, this is now rarely reported; reflecting a change in both value and accessibility.
Table 2: Item most commonly stolen in incidents of property crime, year ending March 2016 Crime Survey for England and Wales
| Households/adults aged 16 and over/ children aged 10 to 15 | ||
| England and Wales | ||
| Property crime type | Item most commonly stolen | Proportion of incidents where item was stolen |
| Percentage | ||
| Theft from the person1 | Purse/wallet | 41 |
| Theft from outside a dwelling | Garden furniture | 44 |
| Robbery1 | Cash / foreign currency | 44 |
| Domestic burglary in a dwelling1 | Purse / wallet / money / cards | 44 |
| Domestic burglary in a non-connected building to a dwelling1 | Tools / work materials | 37 |
| Theft from a dwelling | Purse / wallet / money / cards | 49 |
| Theft from vehicles1 | Exterior fittings | 26 |
| Other theft of personal property | Cash / foreign currency | 29 |
| Personal theft (children aged 10 to 15) | Clothing | 21 |
| Source: Crime Survey for England and Wales, Office for National Statistics | ||
| Notes: | ||
| 1. Where an item was stolen (excludes attempts). | ||
Download this table Table 2: Item most commonly stolen in incidents of property crime, year ending March 2016 Crime Survey for England and Wales
.xls (30.2 kB)Items of clothing were the most commonly stolen items in incidents of theft experienced by children aged 10 to 15 (stolen in 21% of incidents) in the latest survey year. Cash and foreign currency were stolen in 16% of incidents and stationery or books were stolen in 9% of incidents (“Nature of Crime” Table 10.6).
Emotional impact on victims and perceived seriousness
Property crime does not generally result in physical injury to the victim; one possible exception to this is robbery, which by definition involves the use or threat of force or violence. However, the emotional impact can still be considerable for victims. The “Nature of Crime” Tables 3.10, 4.7, 5.4, 6.4, 7.5, 8.5, and 9.4 provide estimates on the proportion of victims emotionally affected by the result of property crimes. Respondents who were victims of property crime were also asked to rate the seriousness of the crime, with a score of 1 being the least serious and 20 being the most. The “Nature of Crime“ Tables 3.11, 4.8, 5.5, 6.5, 7.6, 8.6, and 9.5 provide estimates on the perceived seriousness of the property crimes.
Offender profile
For certain crime types, it is possible to provide further information on the characteristics of offenders. According to the year ending March 2016 CSEW, the victim was able to say something about the offender(s) in 95% of incidents of robbery, 45% of incidents of domestic burglary, 25% of criminal damage incidents and in 50% of thefts of personal property experienced by children aged 10 to 15. There is more detailed information on the characteristics of offenders for the above crime types in “Nature of Crime“ Tables 3.9, 8.7, 9.1 and 10.3.
Notes for nature of CSEW property crime:
- Evening is from 6:00pm to midnight; night is midnight to 6:00am.
- Daylight (morning) is from 6am to noon; and (afternoon) from noon to 6:00pm.
- Daily data are calculated from the weekly total with the week classified at 6:00am Monday until 6:00pm Friday.
- Daily data are calculated from the weekend total with the weekend classified as 6:00pm Friday until 6:00am Monday.
- “Semi-private” includes outside areas on or near the premises and garages or car parks around, but not connected to the home.
- For personal theft offences (robbery, theft from the person and “other” theft of personal property) “Purse or wallet”, “Cash or foreign currency” and “Credit cards” are separate stolen item categories; for household theft offences (domestic burglary and “other” household theft) they have been combined into one stolen item category: “Purse, wallet, money or cards”.
12. Property crime against businesses
Results from the 2012, 2013, 2014 and 2015 CVS
It should be noted that the following totals from the Commercial Victimisation Survey (CVS) represent a small proportion of all crimes experienced by businesses. Direct comparisons in all sectors are not possible due to different sectors and differing numbers of sectors being sampled each year. Further information is available in section 13 (Quality and Methodology).
CVS data for 2015 estimated that there were 4.9 million crimes against business in the 4 sectors covered by the survey in the year prior to the interview, of these, 91% were property related. Each year since 2012 the wholesale and retail sector has been surveyed consistently. The 2015 CVS showed that, while wholesale and retail premises have consistently experienced the highest levels of crime compared with other sectors, crime against the wholesale and retail sector fell significantly between the 2012 and 2015 CVS, showing a steady downward trend over time.
While it is difficult to make comparisons over time for all sectors, there is some evidence that the proportion of agricultural premises experiencing crime has fallen compared with the 2013 CVS.
Property-related crimes have consistently contributed between 86% and 91% of estimated CVS crime across all sectors. CVS data for 2015 estimated that there were 9.2 million crimes against business in the 4 sectors covered by the survey in the year prior to interview; of these 91% were property related. CVS data for 2013 estimated a total of 6.8 million crimes against business (again 4 sectors were covered by the survey); of these, 91% were property related. The 2014 CVS only sampled 3 industry sectors, but estimated a total of 4.8 million crimes against businesses in these sectors, 86% were property related. Full details of the sampled business sectors for each of these years and the estimated number of offences by crime type, are available in Crime against business: headline findings from the CVS 2015.
Back to table of contents13. Quality and methodology
Data sources – coverage and coherence: Crime Survey for England and Wales
The Crime Survey for England and Wales (CSEW; previously known as the British Crime Survey) is a face-to-face survey in which people resident in households in England and Wales are asked about their experiences of crime in the 12 months prior to the interview. It covers both children aged 10 to 15 and adults aged 16 and over, but does not cover those living in communal establishments (such as care homes, student halls of residence and prisons), or crimes against commercial or public sector bodies.
The CSEW is able to capture a broad range of victim-based crimes1 experienced by those interviewed, not just those that have been reported to, and recorded by, the police. It covers a broad range of victim-based crimes experienced by the resident household population. However, there are some serious, but relatively low volume offences, such as homicide and sexual offences, which are not included in its main estimates. Although, at the end of the main interview there is a self-completion element (via a tablet computer), where adults aged 16 to 59 are asked about their experience of domestic abuse and sexual violence, and these results are reported separately2.
A major strength of the CSEW has been its ability to compare crime types over time and for this reason the CSEW has changed little over the last 30 years. However, the way in which criminals are operating is changing and they can now take advantage of new technologies, such as the internet, to both expand the scope of existing crime types and develop new ones. Nowhere has this been more apparent than in fraud and cybercrime. As questions aimed at identifying fraud and other cyber offences were not part of the original survey design, it had not previously been possible to include these new offences in the main estimate of CSEW crime.
To address this issue, new questions relating to fraud and computer misuse were introduced onto half the survey sample from October 2015. Sufficient data have now been gathered to produce estimates of fraud and computer misuse and these are published within the “Crime in England and Wales” release for the first time. Details regarding the process in obtaining these new fraud and computer misuse estimates are available in the “Overview of fraud statistics” article.
Since it began, the CSEW has been conducted by an independent (from government or the police) survey research organisation using trained interviewers to collect data from sampled respondents; the interviewers have no vested interest in the results of the survey. For the crime types and population groups it covers, the CSEW has a consistent methodology and is unaffected by changes in levels of public reporting to the police, recording practice or police activity. As such, the survey is widely seen to operate as an independent reality-check of the police figures. The independence of the survey has been further strengthened by the transfer of responsibility from the Home Office to the Office for National Statistics (ONS) in April 2012.
The CSEW has a higher number of reported offences than police recorded crime as the survey is able to capture all offences by those interviewed, not just those that have been reported to the police and then recorded. However, it does cover a narrower range of offences than the police recorded crime collection.
In 2009, the CSEW was extended to cover children aged 10 to 15, and this release also incorporates results from this element of the survey. However, the main analysis and commentary is restricted to adults and households due to the long time series for which comparable data are available.
The CSEW has a nationally representative sample of around 35,000 adults and 3,000 children (aged 10 to 15 years) per year. The response rates for the latest financial survey year were 72% for adults and 66% for children. The survey is weighted to adjust for possible non-response bias and to ensure the sample reflects the profile of the general population.
Data sources – coverage and coherence: Police recorded crime and other sources
Police recorded crime figures are restricted to a subset of notifiable offences that have been reported to and recorded by the police. Therefore, while the police recorded crime series covers a wider population and a broader3 set of offences than the CSEW, it does not include crimes that do not come to the attention of the police or are not recorded by them.
Police recorded crime figures are supplied by the 43 territorial police forces of England and Wales, plus the British Transport Police, via the Home Office, to us. Data on fraud are sourced from Action Fraud, the UK’s national fraud reporting centre; Cifas, the UK-wide fraud and financial crime prevention service; and Financial Fraud Action UK, who co-ordinate fraud prevention activity for the financial services industry.
Police recorded crime is the principal source of subnational crime statistics and for relatively serious, but low volume, crimes that are not well-measured by a sample survey. It covers victims (including, for example, residents of institutions and tourists as well as the resident population) and sectors (for example, commercial bodies) excluded from the CSEW sample. Recorded crime has a wider coverage of offences, for example, covering homicide, sexual offences and crimes without a specific, identifiable victim (referred to as “Other crimes against society”) not included in the main CSEW crime count. Police recorded crime also provides good measures of well-reported crimes, but does not cover any crimes that are not reported to, or discovered by, the police. It is also affected by changes in reporting and recording practices. Like any administrative data, police recorded crime will be affected by the rules governing the recording of data, by the systems in place and by operational decisions in respect of the allocation of resources.
As well as the main police recorded crime series, there are additional collections providing detail on offences involving the use of knives and firearms, which are too low in volume to be measured reliably by the CSEW.
Strengths and limitations of the Crime Survey for England and Wales and police recorded crime
| Crime Survey for England and Wales | Police recorded crime |
| Strengths | Strengths |
| Large nationally representative sample survey that provides a good measure of long-term crime trends for the offences and the population it covers (that is, those resident in households) | Has wider offence coverage and population coverage than the CSEW |
| Consistent methodology over time | Good measure of offences that are well-reported to the police |
| Covers crimes not reported to the police and is not affected by changes in police recording practice; therefore is a reliable measure of long-term trends | Primary source of local crime statistics and for lower-volume crimes (for example, homicide) |
| Coverage of survey extended in 2009 to include children aged 10 to 15 resident in households | Provides whole counts (rather than estimates that are subject to sampling variation) |
| Independent collection of crime figures | Time lag between occurrence of crime and reporting results tends to be short, providing an indication of emerging trends |
| Limitations | Limitations |
| Survey is subject to error associated with sampling and respondents recalling past events | Excludes offences that are not reported to, or not recorded by, the police and does not include less serious offences dealt with by magistrates’ courts (for example, motoring offences) |
| Excludes crimes against businesses and those not resident in households (for example, residents of institutions and visitors) | Trends can be influenced by changes in recording practices or police activity |
| Headline estimates exclude offences that are difficult to estimate robustly (such as sexual offences) or that have no victim who can be interviewed (for example, homicides and drug offences) | Not possible to make long-term comparisons due to fundamental changes in recording practice introduced in 1998 and the year ending March 2003(5) |
| Previously, excluded fraud and cybercrime(4) | There are concerns about the quality of recording – crimes may not be recorded consistently across police forces and so the true level of recorded crime may be understated |
Download this table Strengths and limitations of the Crime Survey for England and Wales and police recorded crime
.xls (28.7 kB)Accuracy of the statistics: Crime Survey for England and Wales
Since the CSEW is based on a sample of the population, estimates have a margin of quantifiable and non-quantifiable error associated with them. Non-quantifiable error includes:
- when respondents have recalled crimes in the reference period that actually occurred outside that period (“telescoping”)
- crimes that did occur in the reference period that were not mentioned at all (either because respondents failed to recall a fairly trivial incident or, conversely, because they did not want to disclose an incident, such as a domestic assault)
- respondents saying they reported crimes to police when they did not (a “socially desirable” response)
- some incidents reported during the interview being miscoded (“interviewer or coder error”)
Unless stated otherwise, all changes in CSEW estimates described in the main text are statistically significant at the 5% level. Since the CSEW estimates are based on a sample survey, it is good practice to publish confidence intervals alongside them; these provide a measure of the reliability of the estimates and can be found in the User Guide tables. Further information on statistical significance can be found in Chapter 8 of the User Guide.
Accuracy of the statistics: Police recorded crime
Police recorded crime figures are a by-product of a live administrative system that is continually being updated as incidents are logged as crimes and subsequently investigated. The police return provisional figures to the Home Office on a monthly basis and each month they may supply revised totals for previously supplied months. The Home Office Crime and Policing Statistics team undertake a series of validation checks on receipt of the data and query outliers with forces who may then re-submit data. Details of these validation checks are given in Section 3.3 of the User Guide, and the differences in data published between the current and preceding publications can be found in Table QT1a.
Police recording practice is governed by the Home Office Counting Rules (HOCR) and the National Crime Recording Standard (NCRS). The HOCR have existed in some form since the 1920s, with substantial changes in 1998. The NCRS was introduced in April 2002 following a critical report from Her Majesty’s Inspectorate of Constabulary (HMIC) in 2000 (Povey, 2000), which showed that there was a problem with differing interpretation of the HOCR that resulted in inconsistent recording practices across forces.
Following an assessment of crime statistics by the UK Statistics Authority, published in January 2014, the statistics based on police recorded crime data have been found not to meet the required standard for designation as National Statistics.
In their report, the UK Statistics Authority set out 16 requirements that needed addressing for the statistics to meet National Statistics standards. We are working in collaboration with the Home Office Crime and Policing Statistics team and HMIC to address these requirements. A summary of actions taken in response to these requirements is available.
Full details on the history of the assessment and auditing of the quality and accuracy of police recorded crime statistics carried out in recent years is given in Section 3.3 of the User Guide. Since the UK Statistics Authority assessment decision, HMIC have undertaken an inspection of the integrity of police recorded crime (carried out between December 2013 and August 2014), which reviewed a total of 10,267 reports of crime recorded between November 2012 and October 2013 across all 43 police forces in England and Wales.
The final report on findings from the HMIC inspections, Crime-recording: making the victim count, was published on 18 November 2014 and separate crime data integrity force reports for each of the 43 police forces in England and Wales were published on 27 November 2014.
HMIC concluded that, across England and Wales as a whole, an estimated 1 in 5 offences (19%) that should have been recorded as crimes were not. The greatest levels of under-recording were seen for violence against the person offences (33%) and sexual offences (26%). However, there was considerable variation in the level of under-recording across the different offence types investigated. For other crime types: an estimated 14% of criminal damage and arson offences that should have been recorded as crimes were not; 14% of robbery offences; 11% of burglary offences; and 17% of other offences (excluding fraud).
HMIC is now undertaking a further set of crime data integrity inspections across all 43 police forces in England and Wales. These are unannounced visits, and will include a statistically robust audit in each force. Forces will be awarded a graded judgment. This programme of inspections commenced in April 2016 and is expected to continue until the end of 2019.
Reports have been published (25 August 2016) for the first 3 of these forces, and moderated graded judgments applied as follows:
- Sussex – Good
- Greater Manchester – Inadequate
- Staffordshire – Requires Improvement
In these 3 forces, officers and staff were found to have made progress in placing the victim at the forefront of their crime-recording decisions. In addition, good progress had been made against recommendations made to forces following the 2014 inspection.
The renewed focus on the quality of crime recording means that caution is needed when interpreting statistics on police recorded crime. While we know that it is likely that improvements in compliance with the NCRS have led to increases in the number of crimes recorded by the police, it is not possible to quantify the scale of this, or assess how this effect varied between different police forces. In volume terms, police recorded crime for England and Wales as a whole has increased by 8% in the latest year compared with the previous year and 40 police forces (including the British Transport Police) have recorded overall increases in levels of crime.
Apparent increases in police force area data may reflect a number of factors, including tightening of recording practice, increases in reporting by victims and also genuine increases in the levels of crime. It is thought that incidents of violence are more open to subjective judgements about recording and thus more prone to changes in police practice. A number of forces have also shown large increases in sexual offences, which are thought to reflect both a greater willingness among victims to report such crimes and improved compliance with recording standards for sexual offences.
More information regarding the coverage, coherence and accuracy of the CSEW and police recorded crime can be found in the User Guide to Crime Statistics for England and Wales and (for CSEW only) the CSEW technical report.
The Crime in England and Wales Quality and Methodology Information document contains important information on:
- the strengths and limitations of the data and how it compares with related data
- users and uses of the data
- how the output was created
- the quality of the output including the accuracy of the data
Notes for quality and methodology:
- Victim-based crimes are those offences with a specific identifiable victim. These include the CSEW categories of “Violence”, “Robbery”, “Theft offences”, “Criminal damage” (and recently “Fraud” and “Computer misuse”) and the police recorded crime categories of “Violence against the person”’, “Sexual offences”, “Robbery”, “Theft offences” and “‘Criminal damage and arson”.
- Focus on Violent Crime and Sexual Offences: Year ending March 2015 has more detailed information.
- The coverage of police recorded crime is defined by the Notifiable Offence List, which includes all indictable and triable-either-way-offences (offences which could be tried at a Crown Court) and a few additional closely related summary offences (which would be dealt with by magistrates’ courts). Appendix 1 of the User Guide has more information on the classifications used for notifiable crimes recorded by the police.
- From 1 October 2015, the offence coverage of the CSEW was extended to include fraud experienced by the adult population. Estimates from these new questions were published for the first time in ‘Crime in England and Wales, year ending March 2016’ release.
- Section 3.3 of the User Guide has more information.