Table of contents
- Main points
- Statistician’s quote
- What has changed within this publication?
- Future publication plans
- Things you need to know
- What is happening to trends in crime?
- How have trends for individual crime types changed?
- Latest violent crime figures present a complex picture
- No change in CSEW sexual offences and rise in police recorded offences slowing
- Police recorded offences involving weapons rise
- What’s happening to trends in fraud?
- Quality and methodology
- Background notes
1. Main points
Latest figures from the Crime Survey for England and Wales (CSEW), which is the best guide to trends for the population and offences it covers, estimated there were 6.4 million incidents of crime based on interviews in the survey year ending June 2016. This was not significantly different compared with the previous year’s estimate (6.5 million in the year ending June 2015). These headline figures do not yet incorporate estimates from new questions added to the survey since 1 October 2015 on fraud and computer misuse offences.
Estimates derived from these new fraud and computer misuse offence questions continue to be published as experimental statistics and the latest figures (based on questions asked of half of those interviewed in the survey between the beginning of October 2015 and end of June 2016) showed there were 3.6 million fraud and 2.0 million computer misuse offences experienced in the 12 months prior to interview. Next quarter (in January 2017) it is our intention to add these estimates to the headline CSEW totals, once the questions have been asked for a full 12 months in the survey. Latest administrative statistics showed an annual rise of 5% in frauds referred to the police. Industry data on financial fraud, the vast bulk of which is unreported to the police, showed there were 1.9 million cases of frauds on UK-issued cards, an increase of 46% from the previous year.
The police recorded 4.6 million offences in the year ending June 2016, an annual rise of 7%. However, this series is not currently a reliable measure of trends in crime with a large proportion of the rise considered to be due to continued improvements in crime-recording practices and processes.
CSEW estimates showed no significant change in levels of violence compared with the previous survey year, with the underlying trend fairly flat over the last few years. While the police recorded an annual rise of 24% in violence against the person offences, this is thought to largely reflect factors other than a rise in actual levels of violence. Around a third of the increase in violence was due to the inclusion of 2 additional harassment offences within the notifiable offence list. Other factors include process improvements in the wake of the renewed focus on the quality of crime recording; an increase in the proportion of violent crimes reported to the police but also possible small increases in violent crime.
There were 681 homicides recorded by the police in the year to June 2016 and the latest figures include, for the first time, the 96 cases of manslaughter which resulted from events in Hillsborough in 1989. These account for the majority of the 114 increase in homicide compared with the last year. Excluding the victims at Hillsborough the latest figures show a 3% year on year rise. The homicide rate (10 per million population, excluding the 96 cases) remains lower than the rate recorded a decade ago (14 per million population, in the year ending March 2006) and 5 years ago (12 per million population, in the year ending March 2011).
Police recorded offences involving the use of knives or sharp instruments increased by 9% and those involving the use of firearms also rose, by 7%. Both these rises should be seen in the context of significant reductions in recent years. For both knife crime and firearm offences, there appears to be a mixed picture with some evidence to suggest there has been a small but genuine rise in some areas but also suggestions that it reflects general changes in recording processes.
Back to table of contents2. Statistician’s quote
“Violent crime covers a wide spectrum from minor assaults, harassment and abuse that result in no physical harm to the victim through to incidents of wounding and murder.
The latest figures present a complex picture, with the Crime Survey for England and Wales estimating similar levels of violent crime to that seen in recent years, but the number of offences recorded by the police increasing.
We think the rise in the police figures is due to a combination of factors. First, the expansion of the police series to cover new harassment offences. Second, a greater proportion of incidents reported to the police being recorded as crimes. At the same time, the Crime Survey has shown a greater proportion of victims of violent crime reporting to the police. Finally, it appears there has been a small but genuine increase in some categories of violent crime."
John Flatley, Crime Statistics and Analysis, Office for National Statistics, @ONSJohnFlatley on Twitter.
Back to table of contents3. What has changed within this publication?
Quarterly bulletins have adopted a new, shorter format since the year ending December 2015 release, with the aim of making the main messages more accessible. Further changes to the structure and content were made in the previous quarterly bulletin (Crime in England and Wales: Year ending March 2016), with developments continuing to be made in this quarterly bulletin. Despite cutting down the commentary in these bulletins we have maintained the published level of detail in reference tables, and in order to ensure that none of the previously published information has been lost all “former bulletin tables” continue to be published alongside current ones. New questions on fraud and computer misuse were added to the Crime Survey for England and Wales (CSEW) in October 2015. While these questions have only been included within the CSEW for part of the survey year, sufficient data have been gathered to produce estimates of fraud and computer misuse, and these are included within this release as Experimental Statistics (Tables E1 to E13). These do not currently form part of the headline CSEW estimates. These new offences will be included in the CSEW headline estimates for the first time in January 2017, once the questions have been asked for a full 12 months.
Additional data on fraud and cybercrime are being published again alongside this bulletin, including Experimental Statistics on:
- Action Fraud data at police force area level, based on victim residency; these are presented in Table E14
- police recorded crime data on offences that have been flagged as having an online element1; these are presented in Table E15
Notes:
- An offence should be flagged where the reporting officer believes that on the balance of probability, the offence was committed, in full or in part, through a computer, computer network or other computer-enabled device.
4. Future publication plans
The briefing note Improving Crime Statistics for England and Wales – progress update provides an overview of our plans to improve the design, coverage and presentation of crime statistics in England and Wales over the next few years.
The main focus of the commentary in our statistical bulletins has always been on numbers of crimes. In the future, alongside continued commentary on numbers, we intend to give more prominence to crime rates to put numbers in the context of the population. We will be seeking advice from the National Statistician’s Crime Statistics Advisory Committee regarding the planned implementation of these presentational changes.
These proposed presentational changes will also be informed by the responses to our user consultation regarding the methodology for addressing high frequency repeat victimisation in Crime Survey for England and Wales (CSEW). The consultation ran from 6 July to 13 September 2016 and we will be publishing our response and proposed plans later within the next 2 months.
At the end of November we aim to publish information regarding an alternative crime measure called a “Crime Severity Score". This will be based on police recorded crime and built on the premise that some offences are deemed to be more harmful to victims than others and hence, not all crimes should be counted equally in aggregated totals (as they currently are) since the latter can mask a changing profile of harms to society. We will seek your views on its helpfulness and whether or not you would like to see such a measure incorporated regularly within future “Crime in England and Wales” releases; this would be presented alongside the existing measures, rather than replacing them.
We intend to continue developing the structure of our quarterly statistical bulletins in future editions, as well as conducting an extensive review of the data tables published with each release. As part of this review we will be seeking your views on whether there is a continuing need for all of the data we publish and whether there are new requirements for data we are not currently producing. We will also be looking at opportunities to exploit new data sources to meet your needs for more detailed information on the nature of crime.
We would welcome any feedback on this new format or any aspect of our improvement programme at: crimestatistics@ons.gov.uk.
Back to table of contents5. Things you need to know
A crime is an act harmful to an individual (or individuals), a community, society or the State and is punishable by law. Being an illicit activity, by its nature, crime is impossible to measure in its entirety.
These Official Statistics draw on 2 main sources to measure crime levels and trends: the Crime Survey for England and Wales (CSEW) and police recorded crime; neither of these sources can provide a complete picture and each have different strengths and limitations.
Crime Survey for England and Wales
The CSEW is a face-to-face victimisation survey in which people resident in households in England and Wales are asked about their experiences of a selected range of offences in the 12 months prior to the interview. For the population and offence types it covers, the CSEW generally provides the better measure of trends on a consistent basis over time, because it is unaffected by changes in levels of reporting to the police or police recording practices. The methodology employed in the main count of crime has remained comparable since the survey began in 1981.
The CSEW is able to capture a broad range of victim-based crimes experienced by those interviewed, not just those that have been reported to, and recorded by, the police. However, there are some high harm but lower-volume offences, such as homicide and sexual offences, which are not included in its main estimates.
The survey now includes fraud and computer misuse; work that has been completed to address this particular gap is described in section 5.4 of the User Guide to Crime Statistics for England and Wales. Until such data are available for 2 complete survey years, comparisons with previous years and analysis of trends for remaining crimes will be based on CSEW crime excluding fraud and computer misuse offences.
The CSEW allows for the calculation of estimates based on a variety of different measures, including the number of incidents of crime, and the number of victims. Using population estimates it is also possible to calculate the corresponding number of incidents per 1,000 population (the incident rate) and the number victims per 1,000 population (the prevalence rate) or the risk of being a victim of crime. All four measures have been included within this release. For individual crime types, the numbers of victims will be lower than the numbers of incidents, as some people (or households) experience repeat victimisation. This difference will vary by crime type due to differing levels of repeat victimisation.
Police recorded crime
Police recorded crime figures are restricted to a subset of notifiable offences that have been reported to and recorded by the police. Therefore, while the police recorded crime series covers a wider population and a broader set of offences than the CSEW (for example, residents of institutions, tourists and crimes against commercial bodies1), it does not include crimes that do not come to the attention of the police or are not recorded by them. Police recorded crime is the principal source of subnational crime statistics and for higher harm, but lower volume, crimes that are not well-measured by a sample survey.
Police recorded crime is not currently considered a reliable measure of trends in crime for most crime types, since it is prone to changes in recording practices and police activity (for example, a proactive operation on weapons’ offences) as well as changing behaviour in public reporting of crime. As a result, trends will not always reflect changing levels of criminal activity.
Following an assessment of crime statistics by the UK Statistics Authority, published in January 2014, the statistics based on police recorded crime data were found not to meet the required standard for designation as National Statistics. Apparent increases in police recorded crime seen over the last 2 years may reflect a number of factors, including tightening of recording practice, process improvements, increases in reporting by victims and also genuine increases in the levels of crime. It is difficult to disentangle these different factors. Further information is available in the “Quality and methodology” section of this release.
Time periods covered
The latest CSEW figures presented in this release are based on interviews conducted between July 2015 and June 2016, measuring peoples’ experiences of crime in the 12 months before the interview.
The latest recorded crime figures relate to crimes recorded by the police during the year ending June 2016 (between July 2015 and June 2016).
In this release:
- “latest year” (or “latest survey year”) refers to the year (or survey year) ending June 2016
- “previous year” (or “previous survey year”) refers to the year (or survey year) ending June 2015
- any other time period is referred to explicitly
Notes:
- The Commercial Victimisation Survey, carried out by the Home Office, provides estimates of crimes against businesses.
6. What is happening to trends in crime?
Crime Survey for England and Wales
Latest figures from the Crime Survey for England and Wales (CSEW) show there were an estimated 6.4 million incidents of crime experienced by adults aged 16 and over based on interviews in the survey year ending June 2016. The apparent 1% decrease from 6.5 million incidents estimated in the previous year’s survey was not statistically significant.
These estimates cover crimes against the person (for example, violence or theft from the person) and crimes against households (for example, domestic burglary or criminal damage). The headline estimates currently exclude fraud and computer misuse offences, as questions about these offences were first included in October 2015, and there will not be a full year’s worth of data available for publication until January 2017.
Results from these new questions continue to be released as Experimental Statistics and showed there were an estimated 5.6 million fraud and computer misuse offences (3.6 million fraud and 2.0 million computer misuse offences) experienced by adults in the 12 months prior to interview. We plan to incorporate these new offences into the headline CSEW estimates for the year ending September 2016 (due to be published in January 2017), when a full year’s interview data will be available for the first time.
The estimate of 5.6 million fraud and computer misuse offences is similar in magnitude to the current headline estimate covering all other CSEW offences and provides an indication of the scale of the threat from such offences. However, it would be misleading to conclude that this means actual crime levels have doubled, since the survey previously did not cover these fraud and computer misuse offences. It was precisely because these offences were thought to be such high volume that the decision was made to extend the CSEW to cover them. It will not be until January 2018 that we will be able to release valid year-on-year comparisons of CSEW estimates including the new fraud and computer misuse figures.
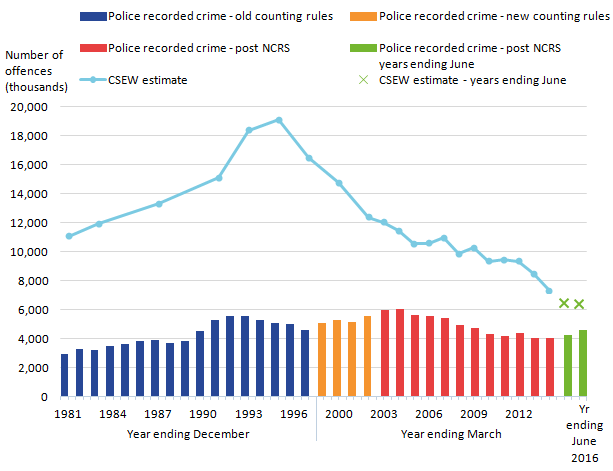
Crime covered by the CSEW increased steadily from 1981, before peaking in 1995. After peaking, the CSEW showed marked falls until the survey year ending March 2005. Since then, the underlying trend has continued downwards, but with some fluctuation from year to year (Figure 1).
These figures relate to a broad range of victim-based crimes experienced by the resident household population. However, they exclude some high harm (but lower-volume) offences such as homicide and sexual offences as well as crimes against children1.
Figure 1: Trends in Crime Survey for England and Wales and police recorded crime, year ending December 1981 to year ending June 2016
Source: Crime Survey for England and Wales, Office for National Statistics / Police recorded crime, Home Office
Notes:
- Police recorded crime data are not designated as National Statistics.
- Prior to the year ending March 2002, CSEW respondents were asked about their experience of crime in the previous calendar year, so year-labels identify the year in which the crime took place. Following the change to continuous interviewing, respondents' experience of crime relates to the full 12 months prior to interview (that is a moving reference period). Year-labels for year ending March 2002 onwards identify the CSEW year of interview.
- From the year ending March 2012 onwards, police recorded crime data has included offences from additional sources of fraud data.
- CSEW data relate to adults aged 16 and over/households.
- Some forces have revised their data and police recorded crime totals may not agree with those previously published.
Download this image Figure 1: Trends in Crime Survey for England and Wales and police recorded crime, year ending December 1981 to year ending June 2016
.png (18.5 kB) .xls (246.8 kB)
Figures for the year to June 2016 CSEW showed that an estimated 7.0 million adults aged 16 and over were a victim of at least one crime2. The likelihood of being a victim of CSEW crime has fallen significantly over time; around 15 in 100 adults were victims in the latest survey year compared with around 23 in 100 a decade ago (in the survey year ending March 2006) and around 40 in 100 in 1995 (the peak survey year).
CSEW estimates of crimes experienced by children aged 10 to 15 are not directly comparable with the main survey of adults, so are not included in the headline total. In the latest survey year, the CSEW estimated that around 12 in 100 children aged 10 to 15 were victims of at least one crime. A total of 799,000 crimes3 were experienced by children; of this number, 54% were categorised as violent crimes4 (428,000), 33% as thefts of personal property (260,000), 9% as criminal damage to personal property (72,000) and 5% as robbery (40,000). Given the small sample size for the 10-to-15-year old element of the CSEW, estimates can fluctuate over time, and as a result trends can be difficult to interpret. Detailed data are available from Tables F21, F22 and F23.
Police recorded crime
The police recorded 4.6 million offences5 in the year ending June 2016, an increase of 7% compared with the previous year. Of the 44 forces (including the British Transport Police), 38 showed an obvious annual increase, which was largely driven by rises in recording of violence against the person and sexual offences.
These increases need to be seen in the context of the renewed focus on the quality of crime recording by the police, in light of the inspections of forces by Her Majesty’s Inspectorate of Constabulary (HMIC), the Public Administration Select Committee (PASC) inquiry into crime statistics and the UK Statistics Authority’s decision to remove the National Statistics designation from police recorded crime statistics. This renewed focus is thought to have led to improved compliance with the National Crime Recording Standard (NCRS), leading to the recording of a greater proportion of crimes that come to the attention of the police.
In November 2015, HMIC wrote to all police forces advising that they would be commencing an unannounced programme of rolling inspections of police forces on an ongoing basis. A series of reports based on the first group of forces inspected (Sussex, Staffordshire and Greater Manchester) were published on 25 August 2016. Sussex Police force was rated as "good" with 95%6 of crimes reported being recorded correctly, Staffordshire Police force was rated as "requiring improvement" with 91%7 of crimes correctly recorded and Greater Manchester Police force was rated as "inadequate" with 85%8 of crimes being recorded correctly. For more information on this new programme of inspections and details on the scheduled inspections, see section 3.3 of the User Guide for Crime Statistics.
Police recorded crime increased during most of the 1980s and then fell each year from 1992 to 1997. Expanded coverage of offences in the police recorded crime collection, following changes to the Home Office Counting Rules (HOCR) in 1998 and the introduction of the NCRS in April 2002, saw general increases in the number of crimes recorded by the police. Following these changes, there was a near continual decline in police recorded crime between the years ending March 2004 and March 2014; the only exception was the year ending March 2012, when there was an increase due to the introduction of offences recorded by the National Fraud Intelligence Bureau (NFIB) for the first time. Since the year ending March 2014 onwards, total police recorded crime has increased; although, as previously stated, it is thought this is principally owing to the renewed focus on the quality of crime recording by the police, rather than an actual increase in crime coming to their attention.
Other related sources
Neither the CSEW nor police recorded crime figures provide a total picture of crime. Other sources of information help to provide a fuller picture, including administrative data on anti-social behaviour and non-notifiable offences, and the Commercial Victimisation Survey, which provides estimates of crime against business premises covered in its sample (the survey generally covers premises in 3 or 4 industrial sectors each year).
Around 1.8 million incidents of anti-social behaviour (ASB) were recorded by the police (including the British Transport Police) in the latest year, a decrease of 6% compared with the previous year (Figure F10). These are incidents that may still be crimes in law, such as littering or dog fouling, but are not of a level of severity that would result in the recording of a notifiable offence. A review by HMIC in 2012 found that there was a wide variation in the quality of decision-making associated with the recording of ASB. As a result, ASB incident data should be interpreted with caution.
The CSEW also provides some information on ASB; an estimated 29% of respondents reported experiencing or witnessing ASB in their local area in the latest survey year, similar to the 28% in the previous survey year. This estimate has remained at a similar level (between 27% and 30%) since the data were first collected in the survey year ending March 2012. Further information is available in Figures F10 and F11 and Tables F24 and F25.
In the year ending March 2016 (the latest period for which data are available), there were 1.1 million convictions for non-notifiable offences9 that were not covered in police recorded crime or the CSEW. This was an increase of 3% from the year ending March 2015, continuing a pattern of similar rises recorded from the year ending December 2014 onwards, and is largely driven by increases in the numbers of defendants prosecuted for motoring offences, failure to pay for a motor vehicle licence and TV licence evasion10. In addition, there were 20,000 Penalty Notices for Disorder (PND) issued in relation to non-notifiable offences for the year ending March 2016, a decrease of 25% from the year ending March 2015; the majority of these PNDs related to drunk and disorderly behaviour11.Further information is available in Tables F26a and F26b.
The CSEW does not cover crimes against businesses and police recorded crime can only provide a partial picture (as not all offences come to the attention of the police). The Commercial Victimisation Survey provides estimates of crime against business premises12 in England and Wales and gives some insight into the number of these crimes that go unreported to the police. However, it does not cover all industry sectors and the small sample sizes associated with individual sectors means that caution must be applied when comparing crime rates over time.. In the survey year ending December 2015, businesses in the wholesale and retail sector experienced the highest levels of crime – an estimated 4.7 million incidents, a rate of around 12,000 incidents per 1,000 business premises, which is lower than the rate recorded for the previous year (13,000 incidents per 1,000 business premises in the year ending December 2014) (Table F27).
The quarterly report Crime in England and Wales: Year ending September 2015 contains further commentary on trends in these other sources.
Notes:
- Estimates of crimes against children are published in Appendix tables A9, A10, A11 and A12.
- This estimate is higher than the estimated number of incidents given for the same time period. In calculating the number of victims of all CSEW crime, all adults resident in a household that had experienced one incident of crime against the household are counted as victims of the crime. Hence, the estimated number of adults who were victims of all CSEW crime is larger than that presented for the number of incidents.
- The survey of children aged 10 to 15 only covers personal level crime (so excludes household level crime) and, as with the main survey, does not include sexual offences.
- The majority (77%) of violent crimes experienced in the latest survey year resulted in minor or no injury, so in just over three-quarters of cases the violence is low level.
- The 4.6 million offences include fraud offences recorded by the police. Excluding fraud offences there were 3.9 million offences recorded by the police in the year ending June 2016, a 7% rise from last year.
- With a confidence interval of +/- 1.70 percent.
- With a confidence interval of +/-1.79 percent.
- With a confidence interval of +/- 1.92 percent.
- Non-notifiable offences are offences dealt with exclusively by magistrates’ courts or by the police issuing of a Penalty Notice for Disorder or a Fixed Penalty Notice. Along with non-notifiable offences dealt with by the police (such as speeding), these include many offences that may be dealt with by other agencies – for example: prosecutions by TV Licensing; or the Driver and Vehicle Licensing Agency (DVLA) for vehicle registration offences.
- Caution should be used when interpreting these provisional magistrates’ court volumes, due to an apparent fall in the number of defendants proceeded against in extracts received for February and March 2016, which is being investigated.
- A pilot scheme was implemented from early November 2014 in Leicestershire and Staffordshire police forces and from late November in West Yorkshire to reduce the types of out of court disposals available for adult offenders. In the pilot areas, the only out of court disposals available are community resolutions and conditional cautions.
- This is a premises-based survey; respondents were asked if the business at their current premises had experienced any of a range of crime types in the 12 months prior to interview.
7. How have trends for individual crime types changed?
The Crime Survey for England and Wales (CSEW) showed that estimates for most of the main individual offence categories showed few significant changes compared with the previous year; only the fall in “bicycle theft” was statistically significant (Table 1a).
The estimated number of “bicycle theft” incidents in the latest survey year decreased to 291,000, down 27% (from 401,000 in the previous year) and continuing the general downward trend seen for this offence category over the last 4 years.
The fall in “bicycle theft” contributed to a 5% non-statistically significant decrease in the estimated total number of theft offences in the latest survey year (3.7 million, down from 3.9 million in the previous survey year). There have been long-term reductions in theft offences with the latest estimated number of incidents being 28% lower than that of roughly 5 years ago (year to March 2011).
Table 1a: CSEW incidence rates and numbers of incidents for year ending June 2016 and percentage change1
| England and Wales | ||||||||||
| July 2015 to June 2016 compared with: | ||||||||||
| Offence group2 | Jul '15 to Jun '16 | Jan '95 to Dec '95 | Apr '05 to Mar '06 | Apr '10 to Mar '11 | Jul '14 to Jun '15 | |||||
| Rate per 1,000 population3 | Number of incidents (thousands)4 | Number of incidents - percentage change and significance5 | ||||||||
| Violence | 28 | 1,292 | -66 | * | -35 | * | -32 | * | 4 | |
| with injury | 13 | 602 | -73 | * | -45 | * | -44 | * | -8 | |
| without injury | 15 | 690 | -56 | * | -23 | * | -16 | 18 | ||
| Robbery | 3 | 149 | -56 | * | -50 | * | -38 | * | 56 | |
| Theft offences6 | .. | 3,702 | -68 | * | -35 | * | -28 | * | -5 | |
| Theft from the person | 9 | 402 | -41 | * | -28 | * | -27 | * | -8 | |
| Other theft of personal property | 17 | 802 | -61 | * | -31 | * | -17 | * | 14 | |
| Unweighted base - number of adults | 36,406 | |||||||||
| Domestic burglary | 29 | 695 | -71 | * | -32 | * | -33 | * | -7 | |
| in a dwelling | 20 | 492 | -72 | * | -32 | * | -33 | * | -5 | |
| in a non-connected building to a dwelling | 8 | 203 | -69 | * | -34 | * | -32 | * | -12 | |
| Other household theft | 27 | 649 | -59 | * | -20 | * | -31 | * | -9 | |
| Unweighted base - number of households | 36,322 | |||||||||
| Vehicle-related theft | 46 | 863 | -80 | * | -48 | * | -26 | * | -1 | |
| Unweighted base - number of vehicle owners | 29,098 | |||||||||
| Bicycle theft | 23 | 291 | -56 | * | -31 | * | -43 | * | -27 | * |
| Unweighted base - number of bicycle owners | 17,321 | |||||||||
| Criminal damage | 52 | 1,255 | -62 | * | -53 | * | -41 | * | -1 | |
| Unweighted base - number of households | 36,322 | |||||||||
| ALL CSEW CRIME6 | .. | 6,398 | -67 | * | -40 | * | -32 | * | -1 | |
| Source: Crime Survey for England and Wales, Office for National Statistics | ||||||||||
| Notes | ||||||||||
| 1. More detail on further years can be found in Appendix tables A1 and A2. | ||||||||||
| 2. Section 5 of the User Guide provides more information about the crime types included in this table. | ||||||||||
| 3. Rates for violence, robbery, theft from the person and other theft of personal property are quoted per 1,000 adults; rates for domestic burglary, other household theft, and criminal damage are quoted per 1,000 households; rates for vehicle-related theft and bicycle theft are quoted per 1,000 vehicle-owning and bicycle-owning households respectively. | ||||||||||
| 4. Data may not sum to totals shown due to rounding. | ||||||||||
| 5. Statistically significant change at the 5% level is indicated by an asterisk. | ||||||||||
| 6. It is not possible to construct a rate for all theft offences or CSEW crime because rates for household offences are based on rates per household, and those for personal offences on rates per adult, and the two cannot be combined. | ||||||||||
Download this table Table 1a: CSEW incidence rates and numbers of incidents for year ending June 2016 and percentage change^1^
.xls (244.2 kB)Table 1b provides an alternative measure of crime based upon prevalence rates (risk of being a victim) and numbers of victims. For individual crime types, the numbers of victims will be lower than the numbers of incidents, as people or households can experience repeat victimisation. It is possible that due to repeat victimisation, there will be some differences in short-term trends between the measures based on numbers of incidents and numbers of victims.
Table 1b: CSEW prevalence rates and numbers of victims for year ending June 2016 and percentage change1
| England and Wales | Adults aged 16 and over/households | |||||||||
| July 2015 to June 2016 compared with: | ||||||||||
| Offence group2 | Jul '15 to Jun '16 | Jan '95 to Dec '95 | Apr '05 to Mar '06 | Apr '10 to Mar '11 | Jul '14 to Jun '15 | |||||
| Percentage, victims once or more3 | Number of victims (thousands)4 | Numbers of victims - percentage change and significance5 | ||||||||
| Violence | 1.8 | 832 | -57 | * | -29 | * | -30 | * | 1 | |
| with injury | 0.9 | 418 | -65 | * | -39 | * | -41 | * | -4 | |
| without injury | 0.9 | 436 | -50 | * | -19 | * | -18 | * | 6 | |
| Robbery | 0.3 | 130 | -53 | * | -44 | * | -34 | * | 50 | |
| Theft offences6 | 10.4 | 4,778 | -63 | * | -28 | * | -26 | * | -6 | * |
| Theft from the person | 0.8 | 376 | -42 | * | -26 | * | -25 | * | -5 | |
| Other theft of personal property | 1.5 | 692 | -58 | * | -31 | * | -18 | * | 11 | |
| Unweighted base - number of adults | 36,406 | |||||||||
| Domestic burglary | 2.3 | 551 | -70 | * | -29 | * | -32 | * | -8 | |
| in a dwelling | 1.6 | 384 | -71 | * | -30 | * | -35 | * | -6 | |
| in a non-connected building to a dwelling | 0.7 | 172 | -69 | * | -30 | * | -28 | * | -12 | |
| Other household theft | 2.2 | 542 | -49 | * | -10 | * | -26 | * | -5 | |
| Unweighted base - number of households | 36,322 | |||||||||
| Vehicle-related theft | 3.9 | 733 | -76 | * | -44 | * | -24 | * | -1 | |
| Unweighted base - number of vehicle owners | 29,098 | |||||||||
| Bicycle theft | 2.1 | 265 | -53 | * | -26 | * | -39 | * | -25 | * |
| Unweighted base - number of bicycle owners | 17,321 | |||||||||
| Criminal damage | 3.8 | 925 | -56 | * | -46 | * | -35 | * | 3 | |
| Unweighted base - number of households | 36,322 | |||||||||
| ALL CSEW CRIME7 | 15.1 | 6,956 | -57 | * | -30 | * | -27 | * | -2 | |
| Source: Crime Survey for England and Wales, Office for National Statistics | ||||||||||
| Notes: | ||||||||||
| 1. More detail on further years can be found in Appendix tables A3 and A8. | ||||||||||
| 2. Section 5 of the User Guide provides more information about the crime types included in this table. | ||||||||||
| 3. Percentages for violence, robbery, theft from the person and other theft of personal property are quoted for adults; percentages for domestic burglary, other household theft, and criminal damage are quoted for households; percentages for vehicle-related theft and bicycle theft are quoted for vehicle-owning and bicycle-owning households respectively. | ||||||||||
| 4. Where applicable, numbers in sub-categories will not sum to totals, because adults/households may have been a victim of more than one crime. | ||||||||||
| 5. Statistically significant change at the 5% level is indicated by an asterisk. | ||||||||||
| 6. This is the estimated percentage/number of adults who have been a victim of at least one personal theft crime or have been resident in a household that was a victim of at least one household theft crime. | ||||||||||
| 7. This is the estimated percentage/number of adults who have been a victim of at least one personal crime or have been resident in a household that was a victim of at least one household crime. | ||||||||||
Download this table Table 1b: CSEW prevalence rates and numbers of victims for year ending June 2016 and percentage change^1^
.xls (245.8 kB)The 7% increase1 in the number of police recorded crimes in the latest year compared with the previous year was largely driven by increases in violence against the person offences (up 24% to 1,035,162), public order offences (up 28% to 219,282), sexual offences (up 14% to 108,762) and miscellaneous crimes against society (up 19% to 65,981). Improvements in crime-recording practices and processes by the police and an increase in the willingness of victims to come forward and report offences (particularly sexual offences, of which 26% were non-recent offences) are thought to be key drivers of this change.
While total theft offences recorded by the police have remained broadly level, there have been increases in the sub-categories of vehicle offences (up 4% to 367,447), shoplifting (up 3% to 340,719) and theft from the person (up 5% to 83,470) offset by decreases in burglary (down 2% to 398,406) and bicycle theft (down 9% to 84,794) (Table 2).
There was a 5% increase in the number of fraud offences recorded in England and Wales (up to 627,8252) compared with the previous year. The increase was due to the number of fraud offences referred by Cifas, which increased by 16%; in contrast, offences recorded by Action Fraud decreased by 6% and offences referred by Financial Fraud Action UK (FFA UK) decreased by less than 1%.
Figure 2 focuses on selected police recorded crime offences with notable changes in the latest year compared with the previous year.
Figure 2: Selected police recorded crime offences in England and Wales: volumes and percentage change between year ending June 2015 and year ending June 2016
Source: Police recorded crime, Home Office
Notes:
- Police recorded crime data are not designated as National Statistics.
Download this chart Figure 2: Selected police recorded crime offences in England and Wales: volumes and percentage change between year ending June 2015 and year ending June 2016
Image .csv .xls
Table 2: Police recorded crimes - rate, number and percentage change for year ending June 20161,2,3
| Offence group | Jul '15 to Jun '16 | July 2015 to June 2016 compared with: | |||
| Rate per 1,000 population | Number of offences | Apr '05 to Mar '06 | Apr '10 to Mar '11 | Jul '14 to Jun '15 | |
| Number of offences - percentage change | |||||
| VICTIM-BASED CRIME | 60 | 3,493,759 | -29 | -3 | 7 |
| Violence against the person offences | 18 | 1,035,162 | 23 | 56 | 24 |
| Homicide | 0 | 681 | -11 | 7 | 20 |
| Violence with injury4 | 8 | 439,146 | -19 | 19 | 12 |
| Violence without injury5 | 10 | 595,335 | 102 | 101 | 35 |
| Sexual offences | 2 | 108,762 | 80 | 102 | 14 |
| Rape | 1 | 36,438 | 152 | 129 | 16 |
| Other sexual offences | 1 | 72,324 | 58 | 90 | 13 |
| Robbery offences | 1 | 51,419 | -48 | -33 | 2 |
| Robbery of business property | 0 | 5,386 | -39 | -30 | 0 |
| Robbery of personal property | 1 | 46,033 | -49 | -33 | 3 |
| Theft offences | 30 | 1,756,937 | -36 | -17 | -0 |
| Burglary | 7 | 398,406 | -38 | -24 | -2 |
| Domestic burglary | 3 | 195,286 | -35 | -24 | -0 |
| Non-domestic burglary | 4 | 203,120 | -41 | -23 | -4 |
| Vehicle offences | 6 | 367,447 | -54 | -18 | 4 |
| Theft of a motor vehicle | 1 | 84,355 | -65 | -28 | 9 |
| Theft from a vehicle | 4 | 237,260 | -53 | -24 | -0 |
| Interfering with a motor vehicle | 1 | 45,832 | -36 | 53 | 13 |
| Theft from the person | 1 | 83,470 | -33 | -10 | 5 |
| Bicycle theft | 1 | 84,794 | -25 | -22 | -9 |
| Shoplifting | 6 | 340,719 | 15 | 11 | 3 |
| All other theft offences6 | 8 | 482,101 | -37 | -23 | -2 |
| Criminal damage and arson | 9 | 541,479 | -54 | -22 | 5 |
| OTHER CRIMES AGAINST SOCIETY | 8 | 455,791 | -12 | -5 | 11 |
| Drug offences | 2 | 144,279 | -19 | -38 | -11 |
| Trafficking of drugs | 0 | 24,967 | -1 | -23 | -6 |
| Possession of drugs | 2 | 119,312 | -22 | -41 | -11 |
| Possession of weapons offences | 0 | 26,249 | -34 | -0 | 16 |
| Public order offences | 4 | 219,282 | -1 | 27 | 28 |
| Miscellaneous crimes against society | 1 | 65,981 | -12 | 37 | 19 |
| TOTAL FRAUD OFFENCES7 | 11 | 627,825 | .. | .. | 5 |
| TOTAL RECORDED CRIME - ALL OFFENCES INCLUDING FRAUD7 | 79 | 4,577,375 | -18 | 10 | 7 |
| Source: Police recorded crime, Home Office | |||||
| Notes: | |||||
| 1. Police recorded crime data are not designated as National Statistics. | |||||
| 2. Police recorded crime statistics based on data from all 44 forces in England and Wales (including the British Transport Police). | |||||
| 3. Appendix tables A4 and A7 provide detailed footnotes and further years. | |||||
| 4. Includes attempted murder, intentional destruction of viable unborn child, causing death by dangerous driving/careless driving when under the influence of drink or drugs, more serious wounding or other act endangering life (including grievous bodily harm with and without intent), causing death by aggravated vehicle taking and less serious wounding offences. | |||||
| 5. Includes threat or conspiracy to murder, harassment, other offences against children and assault without injury (formerly common assault where there is no injury). | |||||
| 6. All other theft offences now includes all 'making off without payment' offences recorded since year ending March 2003. Making off without payment was previously included within the fraud offence group, but following a change in the classification for year ending March 2014, this change has been applied to previous years of data to give a consistent time series. | |||||
| 7. Total fraud offences cover crimes recorded by the National Fraud Intelligence Bureau via Action Fraud, Cifas and Financial Fraud Action UK. Action Fraud have taken over the recording of fraud offences on behalf of individual police forces. Percentage changes compared with earlier years are not presented, as fraud figures for year ending March 2006 and year ending March 2011 covered only those crimes recorded by individual police forces. Given the addition of new data sources, it is not possible to make direct comparsions with earlier years. | |||||
Download this table Table 2: Police recorded crimes - rate, number and percentage change for year ending June 2016^1,2,3^
.xls (248.3 kB)Offences involving firearms3 increased by 7% (to 5,244 offences in the latest year) compared with the previous year (4,889 offences). This was largely driven by an 18% increase in offences involving imitation and other firearms such as BB guns4 and an 11% increase in offences involving handguns. The latest rise follows a general downward trend in firearm offences which remain 53% below its peak around a decade ago.
Offences that involved a knife or sharp instrument5 also showed an increase (9%, to 29,306 offences ) during the latest year. However, we have seen a general downward trend in this series over the longer-term, and hence the latest figures are 10% lower than those from around 5 years ago (year ending March 2011).
More detailed commentary on trends in violent offences, sexual offences, offences involving weapons and fraud offences is included in subsequent sections of this release. In addition, we are in the process of producing a series of overview articles, each focusing on a specific crime type, that will provide information on long-term trends, victim profiles and the nature of incidents (where available). The first of these, an overview on fraud statistics, was published alongside the quarterly report “Crime in England and Wales: Year ending March 2016”; articles on other crime and justice topics will be published in due course. In the meantime, the quarterly report “Crime in England and Wales: Year ending September 2015” contains further commentary on each crime type.
Notes:
- This 7% increase in police recorded crime includes fraud offences recorded by the police. Excluding fraud offences there were 3.9 million offences recorded by the police in the year ending June 2016, an 8% rise from last year.
- This figure is taken from Table A4 and includes 4 fraud offences recorded by the police. The total fraud offences recorded in England and Wales reported in Table A5 differs slightly, as it excludes these 4 offences.
- Firearms include shotguns; handguns; rifles; imitation weapons such as BB guns or soft air weapons; other weapons such as CS gas or pepper spray and stun guns; and unidentified weapons. These figures exclude conventional air weapons, such as air rifles.
- A type of air gun that fires spherical projectiles.
- Only selected violent offences can be broken down by whether a knife or sharp instrument was used. These are: homicide; attempted murder; threats to kill; assault with injury and assault with intent to cause serious harm; robbery; rape; and sexual assault.
- Includes data from all police forces, including Thames Valley, who have reported that they had previously undercounted offences following the implementation of their new crime recording system; section 10 of this release has more information regarding this issue.
8. Latest violent crime figures present a complex picture
Violent crime covers a wide range of offences, from minor assaults (such as pushing and shoving), harassment and abuse that result in no physical harm through to wounding and homicide.
For the population and offences that it covers, the Crime Survey for England and Wales (CSEW) provides the better measure of trends in violent crime. The police recorded crime series is restricted to violent offences that have been reported to and recorded by the police and is not currently believed to provide a reliable measure of trends.
Following criticism of the methodology for handling high-frequency repeat victimisation in CSEW estimates, particularly with regard to violent crime, we commissioned an independent review of the current and alternative methods for addressing repeat victimisation. This review was published on 6 July 2016 alongside a user consultation seeking feedback on the review’s recommendations. The consultation ran until 13 September 2016. We will publish our proposed way forward, along with a summary of the feedback received to the consultation, within the next 2 months.
Main findings
Over the longer-term, levels of violent crime measured by the CSEW have shown substantial falls.
CSEW findings for the latest survey year, however, show no change in levels of violence compared with the previous survey year (the apparent 4% increase was not statistically significant). Other research from Cardiff University also suggests that recent falls in violence may be coming to an end with the number of people in England and Wales injured in serious violence (resulting in hospital treatment) showing no decrease for the first time in seven years.
Violence against the person offences recorded by the police rose by 24% in the latest year with the latest figures representing the highest number of violence against the person offences recorded in a 12-month period since the introduction of the National Crime Recording Standard (NCRS) in April 2002.
The expansion of the harassment category (a sub-category of “Violence without injury”) in April 2015 to include 2 additional offences1 that were previously non-notifiable, has been a contributor to the recent rise in violent crime, with the 2 additional offences contributing just over a third (36%) to the overall rise in Violence against the person offences, and a 47% to the increase in “Violence without injury” sub-category (taken from the Home Office Data Hub). In addition, improvements in crime-recording processes and practices by the police are also thought to be a key driver behind the recent trends. There has also been evidence from the CSEW of a rise in the proportion of violent crimes reported to the police. It is also possible there have been small, but genuine increases, in some types of violent crime.
The police recorded 681 homicides in the latest year, 114 more than in the previous year (a 20% increase). However, this includes for the first time the 96 cases of manslaughter that resulted from the events in Hillsborough in 19892. Excluding those 96 cases of manslaughter the increase in police recorded homicides is much lower, at 3%. The rate of recorded homicides has remained stable compared to the previous year, at 10 per million population (excluding the 96 cases resulting from events at Hillsborough), however, over the longer-term, there has been a general downward trend in recorded homicides.
Crime Survey for England and Wales
CSEW violence includes incidents with and without injury, and also covers attempted incidents.
Latest CSEW data showed there were an estimated 1.3 million incidents of violence experienced by adults aged 16 and over in the latest survey year; no change from the previous survey year (the apparent 4% rise was not statistically significant). There was an apparent 8% decrease in the sub-category of “violence with injury” and an apparent 18% increase in the sub-category of “violence without injury”, although neither of these changes were statistically significant (Figure 3).
The estimated number of CSEW violence incidents rose sharply through the early 1990s (peaking in 1995) and then fell steeply until the survey year ending March 2002. The underlying trend in violence between the survey year ending March 2002 and survey year ending March 2014 has been declining, but the last two survey years indicate a fairly flat trend.
Around 2 in every 100 adults were a victim of CSEW violent crime in the latest survey year, compared with around 3 in 100 adults in the survey year ending March 2006 and 5 in 100 adults in 1995 (the peak year).
Estimates of violence against 10 to 15-year-olds, as measured by the CSEW, can be found in Table F22.
Figure 3: Trends in Crime Survey for England and Wales violence, year ending December 1981 to year ending June 2016
Source: Crime Survey for England and Wales, Office for National Statistics
Notes:
- Prior to the year ending March 2002, CSEW respondents were asked about their experience of crime in the previous calendar year, so year-labels identify the year in which the crime took place. Following the change to continuous interviewing, respondents' experience of crime relates to the full 12 months prior to interview (ie a moving reference period). Year-labels for the year ending March 2002 onwards identify the CSEW year of interview.
Download this chart Figure 3: Trends in Crime Survey for England and Wales violence, year ending December 1981 to year ending June 2016
Image .csv .xlsRecent trends in violent crime, as shown by the CSEW, are also reflected in evidence from research conducted by the Violence and Society Research Group at Cardiff University. Findings from their annual survey, covering a sample of hospital emergency departments and walk-in centres in England and Wales, show that serious violence-related attendances in 2015 were broadly similar to the level recorded in 2014 following a declining trend seen in earlier years.
Police recorded crime
Violent offences in police recorded data are referred to as “violence against the person” and include homicide, violence with injury and violence without injury3. As with the CSEW, both actual and attempted assaults are included in the figures. It should also be noted that the police recorded crime category of violence against the person also include some offences, such as harassment and stalking, in which there is no physical assault involved.
There was a 24% increase in the number of violence against the person offences recorded by the police in the latest year (up to 1,035,162) compared with the previous year. Part of this increase is down to the expansion of the harassment category to include 2 additional notifiable offences. Improvements in crime-recording practices and processes are also thought to be a key driver of this increase as well as an increase in the proportion of victims reporting crimes to the police.
The “violence without injury” sub-category showed an increase of 35% over the same period (up to 595,335 offences), while the “violence with injury” sub-category showed a smaller increase of 12% (up to 439,146 offences).
The increase in “violence without injury” is partially due to an 81% rise in harassment offences in the latest year compared with the previous year (up to 172,960 from 95,573). The rise in harassment is almost entirely the result of the expansion of this category in April 2015 to include 2 additional notifiable offences4 that were previously not included in the police recorded crime series. These are “Disclosure (including on the internet) of private sexual photographs and films with the intent to cause distress or anxiety”5 and “Sending letters (including emails) with intent to cause distress or anxiety” ; the latter thought to account for 97% of these newly added offences6. It is estimated that these 2 additional notifiable offences contribute just over a third (36%) to the overall rise in Violence against the person offences and 47% to the increase in the “violence without injury” sub-category. Taking out the 2 additional notifiable offences, based on data from 39 forces (from the Home Office Data Hub), the increase in harassment offences is estimated at around 6% (instead of 81%), the increase in “violence without injury” is estimated at around 19% (instead of 35%) and the increase in total violent offences is estimated at around 16% (instead of 24%).
The increase in “violence without injury” is also, in part, due to a large increase in modern slavery offences, rising to 1,028 from the 157 recorded the previous year. This increase is in part as a result of improved recording of modern slavery since the introduction of this new offence category last year7. However, a recent report by the Independent Anti-Slavery Commissioner was critical of the under-recording of such offences noting that whilst 884 modern slavery offences were recorded in the year ending March 2016, there was over three times that number of referrals (3,146) to the National Referral Mechanism over the same period.
The increase in the “violence with injury” sub-category includes a 26% rise in the number of attempted murder offences (a volume increase of 147) in the latest year. Attempted murder rose in 26 of the 44 police forces (including the British Transport Police) in England and Wales, in the year ending March 2016; these figures may also have been influenced by improvements in crime recording. Prior to the recent tightening of recording practices, it is possible that some police officers may have been applying Crown Prosecution Service charging standards (guidelines on what charges should be brought against suspects) when deciding what type of crime to record rather than basing the decision on the Home Office Counting Rules (HOCR), which require offences to be recorded in line with the criminal offence committed. Attempted murder is an important example of this potential issue, as offences may have previously been recorded (and charged) as another type of violent crime that is easier to prove in court, such as “assault with intent to cause serious harm”.
All but one police force recorded a rise in violence in the latest year compared with the previous year; Nottingham recorded a 5% decrease. In percentage terms, the largest increase was reported by Northumbria Police, which recorded an additional 11,355 offences compared with the previous year (an increase of 80%, up to 25,540). Other large increases included West Yorkshire Police (up 63%, to 54,706 offences), Durham Police (up 62%, to 11,032) and Avon and Somerset Police (up 52%, to 33,644) (Tables P1 and P3).
Recent changes in recording practice make interpreting trends in violence against the person offences difficult. The latest figures represent the highest number of recorded violence against the person offences in a 12-month period since the introduction of the NCRS in April 2002; 22% above that recorded at the previous peak of the financial year time series in the year ending March 2005.
It is known that violent offences are more prone than some other offences to subjective judgement about whether or not to record a crime. The Crime-recording: making the victim count report, published by Her Majesty’s Inspectorate of Constabulary (HMIC), found that “violence against the person” offences had the highest under-recording rates across police forces in England and Wales. Nationally, an estimated 1 in 3 (33%) violent offences that should have been recorded as crimes were not. The “Quality and methodology” section has more information.
Action taken by police forces to improve their compliance with the NCRS is likely to have resulted in the increase in the number of offences recorded8. It is thought that recording improvements are more likely to affect relatively less serious violent offences and could explain the larger increase in the sub-category “violence without injury” compared with “violence with injury”.
A number of forces have indicated that the rise in recorded violence is a result of a greater proportion of reports of crime being recorded rather than a genuine rise in violent crime. For example, data from the Metropolitan Police Service showed that while police recorded violence against the person increased by 12% in the latest year, the number of “calls for service” (for example, emergency and non-emergency calls from members of the public) relating to violent crime decreased by 2% over the same period.
Domestic abuse
Another possible factor behind the rise in police recorded violent offences is an increase in the reporting of domestic abuse and the subsequent recording of these offences by the police. In 2015, an HMIC report detailed the improvements in the police response to domestic abuse that had taken place across England and Wales. It concluded that recent increases in the number of domestic abuse-related crimes were due, in part, to police forces improving their recording of domestic abuse incidents as crimes and to forces actively encouraging victims to come forward to report these crimes.
The Home Office has been collecting information from the police, since April 2015, on whether recorded offences are related to domestic abuse. Crimes are “flagged” as being domestic-abuse-related by the police if the offence meets the government definition of domestic violence and abuse9. Data for the year ending June 2016 showed that violence against the person offences were the most likely to be flagged, with 32% of such offences flagged as domestic abuse-related. The offence group with the next highest proportion of offences flagged was sexual offences (12%) (Figure 4).
Figure 4: Proportion of offences recorded by the police in England and Wales which were flagged as domestic abuse-related, selected offence groups, year ending June 2016
Source: Police recorded crime, Home Office
Notes:
- Police recorded crime data are not designated as National Statistics.
- Data are provisional and have not been reconciled with police forces.
- Data exclude domestic abuse offences recorded by Durham police from April to June 2016.
Download this chart Figure 4: Proportion of offences recorded by the police in England and Wales which were flagged as domestic abuse-related, selected offence groups, year ending June 2016
Image .csv .xlsAt present, given that only 5 quarters’ of data on offences flagged by the police as being domestic-abuse-related are available; it is not possible to compare levels with earlier years.
However, since the year ending March 2005, the CSEW has included a self-completion questionnaire module on intimate violence, for persons aged 16 to 59 only, which provides a measure of the proportion of people who have been victims of domestic abuse in this age group over time.
Most recent estimates from this self-completion section of the CSEW for the year ending March 2016 showed that the proportion of all adults aged 16 to 59 who had been victims of domestic abuse in the last year (including attempted offences) had remained the same as for the previous survey year (year ending March 2015; both 6.1%). These figures have remained between 6.1% and 7.0% since the survey year ending March 2009, albeit with some year-on-year fluctuation and the underlying trend since the survey year ending March 2012 has been downwards (Table S41).
Data from the year ending March 2015 survey year10 showed that women, and especially younger women, were more likely to be victims of domestic abuse than other demographic groups, for example, 12.6% of women aged 16 to 19 were victims in the last year. In comparison, 6.1% of all adults were victims of domestic abuse for the same time period.
Homicide
Unlike many other offences in the “violence against the person” category, the recording of homicides is not prone to changes in recording practice by the police.
The police recorded 681 homicides in the latest year, 114 more than in the previous year (Tables F3a and F3b)11. However, the 681 homicides recorded in 2016 include the 96 cases of manslaughter that resulted from events in Hillsborough in 1989, excluding these cases the number of homicides increased by 3%.
Historically, the number of homicides increased from around 300 per year in the early 1960s to over 800 per year in the early years of this century, which was at a faster rate than population growth over that period. Over the past decade, the volume of homicides has generally decreased while the population of England and Wales has continued to grow. The rate of homicide has fallen by just under a third (31%) between the year ending March 2006 and the year ending March 2016, from 14 homicides per million of the population to 10 homicides per million. For the latest year (year ending June 2016) the rate is 12 homicides per million. Excluding the 96 Hillsborough cases, the rate remains at 10 homicides per million population.
There is more detailed information on trends and the circumstances of violence in Focus on Violent Crime and Sexual Offences: Year ending March 2015. Information on violent crimes such as modern slavery, and female genital mutilation (FGM) is available in the “Violent crime” section of the Crime in England and Wales: Year ending September 2015 release.
The latest figures relating to “hate crime” were published by the Home Office on 13 October 2016. According to “Hate Crime, England and Wales, 2015/16” there were 62,518 crimes recorded by the police in the year to March 2016 in which one or more hate crime strands were deemed to be a motivating factor. This was an increase of 19% compared with the 52,465 hate crimes12 recorded in the year ending March 2015 with over three-quarters (79%) of the latest figure recorded as race hate crimes. As discussed earlier in this section, part of the increase may be the result of action taken by police forces to improve their compliance with the National Crime Recording Standard (NCRS), especially for violence against the person and public order offences. This, together with a greater awareness of hate crime, and improved willingness of victims to come forward, is likely to be a factor in the increase in hate crimes recorded by the police in the year ending March 2016 compared with the previous year.
Although the Home Office publication covers hate crimes recorded by the police between the 1 April 2015 and 31 March 2016, an Annex to the publication examines levels of hate crime (specifically racially or religiously aggravated offences) around the EU Referendum on 23 June 2016. The Annex shows a sharp increase in the number of racially or religiously aggravated offences recorded by the police following the EU Referendum. The number of racially or religiously aggravated offences recorded by the police in July 2016 was 42% higher than in July 2015.
Notes:
- “Disclosure of private sexual photographs and films with the intent to cause distress or anxiety” and “Sending letters with intent to cause distress or anxiety”.
- The 96 offences of manslaughter were recorded in the year ending June 2016 figures, and not in 1989, due to the result of the recent inquest into the events.
- There are some closely-related offences in the police recorded crime series, such as public order offences, that have no identifiable victim and are contained within the “Other crimes against society” category.
- The 2 additional harassment offences are included within all 4 quarters (12 months data) for the latest year (ending June 2016) while the comparator year data (ending June 2015) only includes these additional offences in one quarter. In future quarterly releases, the comparator year will begin to include the additional harassment offences in more quarters and we therefore expect to see the extent of the increase in the “violence without injury” subcategory lessen.
- In addition to letters, this offence also covers electronic communications such as emails, text messages and those sent via social media.
- Based on data from 39 forces supplied via the Home Office Data Hub.
- This new offence category includes offences previously included under other offence types. More information can be found in the attached notes to Appendix table A4.
- The inspections took place over the period December 2013 to August 2014; this falls within the time period covered by the comparator year in this release (ending June 2015).
- Any incident or pattern of incidents of controlling, coercive or threatening behaviour, violence or abuse between those aged 16 or over who are, or have been, intimate partners or family members regardless of gender or sexuality.
- The latest published data in Focus on Violent Crime and Sexual Offences: Year ending March 2015; data for the survey year ending March 2016 are due for release in February 2017.
- Homicide includes the offences of murder, manslaughter, corporate manslaughter and infanticide. Figures from the Homicide Index for the time period April 2014 to March 2015, which take account of further police investigations and court outcomes, were published in Focus on Violent Crime and Sexual Offences: Year ending March 2015 on 11 February 2016.
- Figure differs to that previously published (52,528) due to small changes in the volume of crimes identified by forces as hate crimes.
9. No change in CSEW sexual offences and rise in police recorded offences slowing
Main findings
The most recent estimates from the self-completion questionnaire module in the Crime Survey for England and Wales (CSEW) on intimate violence (for the year ending March 2016) showed that the proportion of adults aged 16 to 59 who had been victims of sexual assaults in the last year (including attempted offences) had not significantly changed between the latest survey year (year ending March 2016; 2.0%, equivalent to 645,000 victims), and the previous survey year (year ending March 2015; 1.7%).
There was an increase of 14% in sexual offences recorded by the police in the latest year (up to 108,762 offences) compared with the previous year; this includes a 16% increase in rape and a 13% increase in other sexual offences. However, this increase is starting to slow, with the rise this year being less than what was reported last quarter (21% in the year ending March 2016) or last year (41% in the year ending June 2015).
It is not thought that police recorded crime data currently provide a reliable indication of trends in sexual offences. The increases are believed to have resulted from both an improvement in the recording of sexual offences by the police and an increased willingness of victims to come forward and report these crimes to the police.
Crime Survey for England and Wales
Due to the small number of sexual offences identified in the face-to-face interview section of the CSEW, estimates of the volume of incidents are prone to fluctuation and therefore not included in the main CSEW estimate of crime. Since the year ending March 2005, the CSEW has included a self-completion module on intimate violence, for persons aged 16 to 59 only, which provides an improved measure of the proportion of people in this age group who have been victims of sexual offences. The upper age limit 59 may be increased or removed entirely from April 2017 following new development work.
Most recent headline estimates from this self-completion section of the CSEW, from the year ending March 2016 showed that the proportion of all adults aged 16 to 59 who had been victims of sexual assaults in the last year (including attempted offences) had not significantly changed between the latest survey year (2.0%) and the previous survey year (1.7%). These figures have remained at around 2.0% since the survey year ending March 2009, albeit with some year-on-year fluctuation (Table S41).
Data from the previous survey year1 showed that women, and especially younger women, were more likely to be victims of sexual assault than other demographic groups (for example, 9.0% of women aged 16 to 19 were victims in the last year). In comparison, 1.7% of all adults were victims of sexual assault for the same time period.
Detailed findings from the self-completion module for the previous CSEW year are available in Focus on Violent Crime and Sexual Offences: Year ending March 2015; detailed findings for the latest CSEW year are planned for release in the “Year ending March 2016” edition in February 2017.
Police recorded crime
There was an increase of 14% in the number of sexual offences recorded by the police in the latest year compared with the previous year (up to 108,762; Tables F6a and F6b). Sexual offences have reached the highest volume recorded since the introduction of the National Crime Recording Standard (NCRS) in April 2002 and it is the third time that the total number of offences has exceeded 100,000 in a 12-month period (the first time being in the year ending December 2015, and the second in the year ending March 2016). The rate of year-on-year increases, however, is slowing; it was 21% in the year ending March 2016 and the latest increase is considerably less steep than those seen in the year ending, June 2015 and the year ending June 2014 (41% and 21% respectively).
Police recorded rape increased by 16% (to 36,438 offences) compared with the previous year, while other sexual offences increased by 13% (to 72,324). Offence categories that directly relate to sexual offences against children2 contributed over a third (37%) to the total increase in the number of sexual offences recorded by the police.
Between the year ending March 2008 and the year ending March 2013, the trend in sexual offences was broadly flat with small increases recorded in some years. Since the year ending March 2013, police recorded sexual offences have risen consistently. In the year ending March 2014, the increases were generally driven by a rise in the recording of non-recent offences (those that took place more than 12 months before being recorded by the police), whereas the increases seen throughout the previous and latest years (particularly the most recent quarters) have been largely due to a rise in current offences (those that took place within 12 months of being recorded by the police)3.
Overall, the increases are believed to have resulted from both an improvement in the recording of sexual offences by the police and an increased willingness of victims to come forward and report these crimes to the police, and hence we feel these data do not currently provide a reliable indication of trends in sexual offences.
The Crime-recording: making the victim count report, published by Her Majesty’s Inspectorate of Constabulary (HMIC) in late 2014, found that sexual offences had been substantially under-recorded (by 26% nationally) and led to police forces reviewing and improving their recording processes4. Additionally the high-profile coverage of sexual offences and the police response to reports of non-recent sexual offending (for example, through Operation Yewtree which began in 2012) are likely to have had an effect on the willingness of victims to come forward and report offences of this nature.
Police recorded sexual offences represent a small proportion of all victim-based crime (excluding fraud). Figure 5 illustrates that there have been almost continual year-on-year increases in the proportion of police recorded victim-based crime comprising sexual offences since the year ending March 2003 (the only exception being the year ending March 2007) and these increases have become more pronounced over the last 4 years (more than doubling over this period).
Figure 5: Police recorded sexual offences as a proportion of victim-based crime in England and Wales, year ending March 2003 to year ending June 2016
Source: Police recorded crime, Home Office
Notes:
- Police recorded crime data are not designated as National Statistics.
Download this chart Figure 5: Police recorded sexual offences as a proportion of victim-based crime in England and Wales, year ending March 2003 to year ending June 2016
Image .csv .xlsNotes:
- The latest published data in Focus on Violent Crime and Sexual Offences: Year ending March 2015; data for the survey year ending March 2016 are due for release in February 2017.
- This includes “Rape of a male / female child under 16”, “Rape of a male / female child under 13”, “Sexual assault on a male / female child under 13”, “Sexual activity involving a child under 13 / under 16” and “Abuse of children through sexual exploitation”.
- Based on findings from the Home Office Data Hub; these were discussed in detail in Crime in England and Wales, period ending March 2014
- More information on interpreting longer-term trends in these offences can be found in An Overview of Sexual Offending in England and Wales and Focus on Violent Crime and Sexual Offences: Year ending March 2015.
10. Police recorded offences involving weapons rise
Some of the more serious offences in the police recorded crime data (violence against the person, robbery and sexual offences) can be broken down by whether or not a knife or sharp instrument was involved1.
Data are also available for police recorded crimes involving the use of firearms (that is, if a firearm is fired, used as a blunt instrument, or used as a threat).
As offences involving the use of weapons are relatively low in volume, the Crime Survey for England and Wales (CSEW) is not able to provide reliable estimates for numbers of such incidents.
Main findings
In the latest year the police recorded 29,306 offences involving a knife or sharp instrument, a 9% increase compared with the previous year. While in the past these offences were not thought to be prone to changes in recording practices by the police, some forces are reporting that the general improvement in recording processes may be impacting on these categories.
Offences involving firearms in the latest year also increased, by 7% (to 5,244 offences) compared with the previous year; this was largely driven by an increase in offences involving imitation and other firearms such as BB guns and soft air weapons and an increase in offences involving a handgun.
Offences involving knives or sharp instruments2
In the latest year, the police recorded 29,306 offences involving a knife or sharp instrument, a 9% increase compared3 with the previous year (26,843, Table 3). The past two quarters have seen a rise in the number of offences involving a knife or sharp instrument recorded. However, there has been a general downward trend in this series over the longer-term and the latest figures are 10% lower than in the year ending March 2011.
All of the offence groups for which data are collected showed increases, including an 18% increase in “attempted murder” and a 30% increase in “threats to kill” involving a knife or sharp instrument. The category of “assault with injury and assault with intent to cause serious harm” showed the largest rise in terms of volume of offences (up 12%, from 13,766 to 15,447).
The majority of police forces (37 of the 44) recorded a rise in offences involving knives and sharp instruments compared with the previous year. The largest contributor to the total rise was West Midlands Police (accounting for 18% of the increase). Data for police force areas are published in the Home Office’s knife crime open data table4.
Table 3: Selected violent and sexual offences involving a knife or sharp instrument recorded by the police, year ending March 2011 to year ending June 2016 and percentage change1,2,3,4,5,6
| England and Wales | |||||||||
| Apr '10 to Mar '11 | Apr '11 to Mar '12 | Apr '12 to Mar '13 | Apr '13 to Mar '14 | Jul '14 to Jun '15 | Jul '15 to Jun '16 | Jul '15 to Jun '16 compared with previous year | |||
| Number of selected offences involving a knife or sharp instrument | Percentage change | ||||||||
| Attempted murder | 240 | 246 | 198 | 248 | 294 | 347 | 18 | ||
| Threats to kill | 1,462 | 1,183 | 1,188 | 1,317 | 1,797 | 2,335 | 30 | ||
| Assault with injury and assault with intent to cause serious harm7 | 13,941 | 12,621 | 11,343 | 11,551 | 13,766 | 15,447 | 12 | ||
| Robbery | 16,438 | 16,417 | 13,194 | 11,910 | 10,350 | 10,508 | 2 | ||
| Rape | 258 | 237 | 190 | 261 | 325 | 336 | 3 | ||
| Sexual assault8 | 93 | 72 | 88 | 97 | 120 | 127 | 6 | ||
| Total selected offences | 32,432 | 30,776 | 26,201 | 25,384 | 26,652 | 29,100 | 9 | ||
| Homicide9 | 237 | 211 | 195 | 204 | 191 | 206 | 8 | ||
| Total selected offences including homicide | 32,669 | 30,987 | 26,396 | 25,588 | 26,843 | 29,306 | 9 | ||
| Rate per million population - selected offences involving a knife or sharp instrument | |||||||||
| Total selected offences including homicide | 587 | 552 | 467 | 449 | 468 | 506 | |||
| Source: Police recorded crime, Home Office | |||||||||
| 1. Police recorded crime data are not designated as National Statistics. | |||||||||
| 2. Police recorded crime statistics based on data from all 44 forces in England and Wales (including the British Transport Police). | |||||||||
| 3. Police recorded knife and sharp instrument offences data are submitted via an additional special collection. Proportions of offences involving the use of a knife or sharp instrument presented in this table are calculated based on figures submitted in this special collection. Other offences exist that are not shown in this table that may include the use of a knife or sharp instrument. | |||||||||
| 4. Data from Surrey Police include unbroken bottle and glass offences, which are outside the scope of this special collection; however, it is not thought that offences of this kind constitute a large enough number to impact on the national figure. | |||||||||
| 5. Numbers differ from those previously published due to Sussex Police revising their figures to exclude unbroken bottles. | |||||||||
| 6. An audit of Thames Valley Police into the recording of knife and sharp instrument offences since the introduction of their new recording system in April 2014 has revealed that they were previously under-counting these offences. Data for the year ending March 2016 have been revised, but data for the year ending March 2015 have not; it is likely that the percentage changes presented are slightly higher than they would be once the year ending March 2015 data are revised. | |||||||||
| 7. Changes to offence codes in April 2012 mean the category of assault with injury and assault with intent to cause serious harm is not directly comparable with previous years. Appendix table A4 contains more details. | |||||||||
| 8. Sexual assault includes indecent assault on a male/female and sexual assault on a male/female (all ages). | |||||||||
| 9. Homicide offences are those currently recorded by the police as at 1 September 2016 and are subject to revision as cases are dealt with by the police and by the courts, or as further information becomes available. They include the offences of murder, manslaughter, infantIcide and, as of year ending March 2013, corporate manslaughter. These figures are taken from the detailed record level Homicide Index (rather than the main police collection for which forces are only required to provide an overall count of homicides, used in Appendix table A4). There may therefore be differences in the total homicides figure used to calculate these proportions and the homicide figure presented in Appendix table A4. | |||||||||
Download this table Table 3: Selected violent and sexual offences involving a knife or sharp instrument recorded by the police, year ending March 2011 to year ending June 2016 and percentage change^1,2,3,4,5,6^
.xls (247.8 kB)In the last two years, there has been a reversal of the previously downward trend in total selected knife offences, though the pattern varies by offence type. The latest 18% increase in attempted murders involving a knife or sharp instrument may have been influenced by improvements in crime recording, with offences previously being more likely to be recorded according to the Crown Prosecution Service (CPS) charging standard rather than the Home Office Counting Rules and the National Crime Recording Standard (NCRS). For example, they might have been recorded (and charged) as another type of violent crime that is easier to prove in court, such as “assault with intent to cause serious harm”.
While in the past offences involving a knife were generally not thought to be prone to changes in recording practices, some forces have suggested that recording process improvements may have been a factor driving the recent increases.
“Possession of an article with a blade or point” offences also rose by 15% to 11,708 offences in the latest year. This figure can often be influenced by increases in targeted police action in relation to knife crime.
Taking everything into account, it suggests the picture is a complex one, with rises reflecting both improvements in recording processes but also a genuine rise in knife crime in some areas.
Further analysis on offences involving knives or sharp instruments has been published in Focus on Violent Crime and Sexual Offences: Year ending March 2015.
Offences involving firearms
Similar to the breakdown of offences involving knives or sharp instruments, statistics are available for police recorded crimes involving the use of firearms5. Firearms are taken to be involved in an offence if they are fired, used as a blunt instrument against a person, or used as a threat. Focus on Violent Crime and Sexual Offences: Year ending March 2015 has more detailed information on trends and the circumstances of offences involving firearms, including figures based on a broader definition of the types of firearm involved6.
Offences involving firearms in the latest year increased by 7% (to 5,244 offences) compared with the previous year. This was largely driven by a 22% increase in offences involving imitation weapons (such as BB guns7) and an 11% increase in handguns. The increase in offences involving imitation weapons may reflect improvements in the recording of crime by the police for this less serious firearm category. The increase in offences involving handguns is driven by increases in a small number of urban forces and follows a long-term downward trend, with the number of these offences down by 60% since the year ending March 2003. The increase in overall firearm offences has also followed a general downward trend and the overall level remained 53% below its peak (in the year ending March 2006; Figure 6).
Figure 6: Trends in police recorded crime in England and Wales involving the use of firearms, year ending March 2003 to year ending June 2016

Source: Police recorded crime, Home Office
Notes:
- Police recorded crime data are not designated as National Statistics.
- Firearms include: shotguns; handguns; rifles; imitation weapons such as BB guns or soft air weapons; other weapons such as CS gas or pepper spray; and stun guns; and unidentified weapons. They exclude conventional air weapons, such as air rifles.
Download this image Figure 6: Trends in police recorded crime in England and Wales involving the use of firearms, year ending March 2003 to year ending June 2016
.png (9.8 kB) .xls (241.2 kB)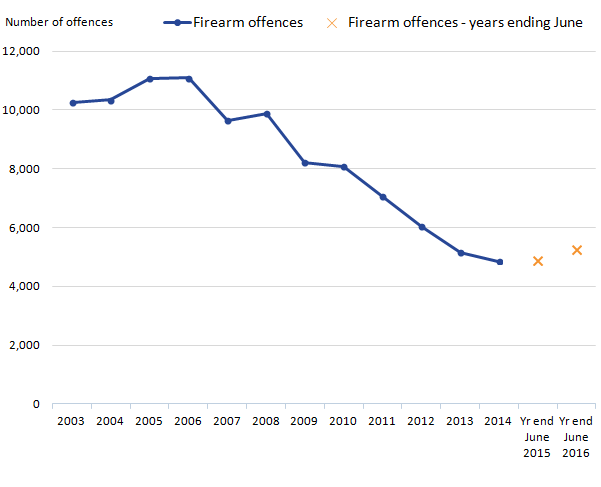
Notes:
- These are: homicide; attempted murder; threats to kill; assault with injury and assault with intent to cause serious harm; robbery; rape; and sexual assault.
- A sharp instrument is any object that pierces the skin (or in the case of a threat, is capable of piercing the skin), for example a broken bottle.
- An audit into the recording of knife and sharp instrument offences by Thames Valley Police has revealed that they had been under-counting these offences since the introduction of their new recording system in April 2014. Data for year ending March 2016 were revised, but data for the previous year (ending March 2015) have not been.
- This source excludes homicides committed using a knife or sharp instrument.
- Firearms include shotguns; handguns; rifles; imitation weapons such as BB guns or soft air weapons; other weapons such as CS gas or pepper spray and stun guns; and unidentified weapons. These figures exclude conventional air weapons, such as air rifles.
- The broader definition of firearms includes conventional air weapons, such as air rifles.
- A type of air gun that fires spherical projectiles.
11. What’s happening to trends in fraud?
The extent of fraud is difficult to measure because it is a deceptive crime; victimisation is often indiscriminate, covering organisations as well as individuals. Some victims of fraud may be unaware they have been a victim of crime, or that any fraudulent activity has occurred for some time after the event. Others might be unwilling to see themselves as victims or reluctant to report the offence to the authorities, feeling embarrassed that they have fallen victim. The level of fraud reported via administrative sources is thought to significantly understate the true level of such crime.
While the Crime Survey for England and Wales (CSEW) estimates will include crimes that have not been reported to the authorities, being a household survey, they will not capture fraud against organisations. It is also likely that some victims of fraud, especially very elderly and vulnerable victims who may have suffered significant financial losses, may not have the confidence to allow an interviewer into their home to conduct an interview.
Main findings
Based on Experimental Statistics from new fraud and computer misuse questions that were added to the CSEW from October 2015, adults aged 16 and over experienced an estimated 5.6 million fraud and computer misuse incidents in the 12 months prior to interview; 3.6 million of these were fraud incidents and 2.0 million were computer misuse incidents. These data are only based on interviews with half of the sample of respondents conducted between October 2015 and June 2016, but have been grossed up to provide an estimate covering the entire survey year.
In the latest year, there was a 5% increase in the number of fraud offences recorded in England and Wales (up to 627,8251 offences) compared with the previous year. The increase was owing to fraud offences referred by Cifas to the police, which increased by 16% (up to 308,901) compared with the previous year.
Other industry data from by Financial Fraud UK showed 1.9 million cases of frauds on UK-issued cards, cheque fraud and remote banking fraud (internet, telephone and mobile banking), an increase of 46% from the previous year. The vast majority of such cases were not referred to the police due to insufficient intelligence value to aid in investigating and detecting fraud.
Crime Survey for England and Wales
New questions on fraud and computer misuse were added to the CSEW in October 2015. Sufficient data have now been gathered to produce estimates, based on these new questions and published as Experimental Statistics. These data build upon the findings from the recent field trial of the newly developed survey questions – which can be found in the methodological note: CSEW Fraud and Cyber-crime development: Field trial – October 2015 – however, the 2 sets of figures should not be directly compared, as methodological refinements were made following the trial.
Based on these new questions, adults aged 16 and over experienced an estimated 3.6 million incidents of fraud (Table 4), with just over half of these (52%; 1.8 million incidents) being cyber-related2.
The most common types of fraud experienced were “Bank and credit account” fraud (2.4 million incidents; 65% of the total), followed by “Non-investment” fraud – such as fraud related to online shopping or fraudulent computer service calls (1.0 million incidents; 28% of the total).
In addition, adults experienced an estimated 2.0 million computer misuse incidents; around two-thirds (66%; 1.3 million incidents) of these were computer virus related and around one-third (34%; 0.6 million incidents) were related to unauthorised access to personal information (including hacking).
Further data from the new CSEW fraud and computer misuse questions are presented in Tables E1 to E13.
Table 4: CSEW fraud and computer misuse – numbers of incidents for year ending June 2016 (Experimental Statistics)1,2
| England and Wales | Adults aged 16 and over |
| Offence group | Number of incidents (thousands) |
| Fraud | 3,616 |
| Band and credit account fraud | 2,356 |
| Non-investment fraud | 1,028 |
| Advance fee fraud | 117 |
| Other fraud | 116 |
| Computer misuse | 2,021 |
| Computer virus | 1,340 |
| Unauthorised access to personal information (including hacking) | 681 |
| Unweighted base - number of adults | 13,575 |
| Source: Crime Survey for England and Wales, Office for National Statistics | |
| 1. Experimental Statistics are those which are in the testing phase and not yet fully developed. They are published in order to involve users and stakeholders in their development, and as a means to build in quality at an early stage. | |
| 2. New victimisation questions on fraud and computer misuse were incorporated into the CSEW from October 2015. Initial estimates are based on the approximately 13,800 cases gathered betweeen October 2015 and June 2016. The questions are currently asked of half the survey sample to test for detrimental effects on the survey as a whole and help to ensure that the historical time series is protected. | |
Download this table Table 4: CSEW fraud and computer misuse – numbers of incidents for year ending June 2016 (Experimental Statistics)^1,2^
.xls (241.2 kB)In addition to these new data covering a wide spectrum of fraud, for the last decade, the survey has included a supplementary module of questions on plastic card (bank and credit card) fraud.
The results from this supplementary module show that 4.9% of plastic card owners were victims of card fraud in the latest survey year, a similar level to the previous survey year (4.6%) and similar with the findings from the new Experimental Statistics for the same period (4.2% of all adults, equivalent to 3.9% of plastic card owners). The trend in levels of plastic card fraud measured by this supplementary module has remained fairly stable over the last few years, following a rise between the survey years ending March 2006 and March 2010 and a subsequent fall between the survey years ending March 2010 and March 2012 (Figure 7). Data from these questions provide an indication of whether an individual has been a victim of plastic card fraud, but do not provide any information on the number of times this occurred or the scale of any loss that may have been experienced.
Figure 7: Proportion of Crime Survey for England and Wales plastic card users who had been a victim of plastic card fraud in the last year, year ending March 2006 to year ending June 2016

Source: Crime Survey for England and Wales, Office for National Statistics
Notes:
- The data refer to crimes experienced in the 12 months before interview, based on interviews carried out in that year.
Download this image Figure 7: Proportion of Crime Survey for England and Wales plastic card users who had been a victim of plastic card fraud in the last year, year ending March 2006 to year ending June 2016
.png (9.7 kB) .xls (239.6 kB)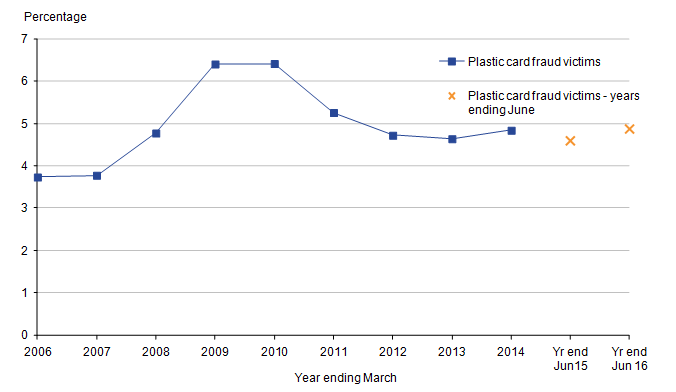
At this early stage, the existing estimates from the supplementary module on plastic card fraud and from the new Experimental Statistics on bank and credit account fraud appear similar. Given that these types of offence comprise just under two-thirds (65%) of the new fraud estimate, trends in plastic card fraud from the supplementary module could provide an illustration of how the trends in other frauds may have behaved in recent years, in the absence of the data being collected.
The “Overview on fraud statistics” article published alongside the year to March 2016 quarterly bulletin provides more detailed findings from the new CSEW fraud data.
Recorded fraud offences
The police recorded crime series incorporates offences reported to Action Fraud (the national fraud and cybercrime reporting centre) as well as those reported to the National Fraud Intelligence Bureau (NFIB) by 2 industry bodies: Cifas and Financial Fraud Action UK (FFA UK). The volume of such incidents referred to the police is significantly lower than the estimates from the new CSEW fraud and computer misuse questions. However, while the survey provides a better indication of the threat of such crimes, it will tend to be dominated by lower-harm cases than the administrative data, which will tend to be focused on the more serious end of the spectrum.
In the latest year, there was a 5% increase in the number of fraud offences recorded in England and Wales (up to 627,8253 offences) compared with the previous year (Tables 18a and 18b); this was owing to offences referred by Cifas, which increased by 16% (up to 308,901). In contrast, fraud offences recorded by Action Fraud decreased by 6% (down to 223,863) and those referred by FFA UK showed little change from the previous year.
Victims of fraud may report incidents to Action Fraud via an online reporting tool or via a telephone helpline. In July 2015, the company that was contracted to provide the call centre service went into administration. This led to an immediate downscaling of the call centre operation. A new contractor, who was due to take over the Action Fraud call centre in April 2016, was asked to take over operations early in August 2015. As at the end of the latest reporting period, it is thought that call centre operations were only just starting to run at normal capacity levels.
Following the previous call centre service contractor going into administration in July 2015, Action Fraud recorded lower than normal monthly volumes of fraud offences between the period of July 2015 to April 2016, with the figures for May and June 2016 only now returning to levels seen prior to the contractual issues. Any discrepancy in the latest trends will therefore have been influenced by the changes in the operation of the Action Fraud call centre, and latest figures should be interpreted with caution.
One of the largest increases in the separate categories of fraud referred to the NFIB in the latest year was seen in “Banking and credit industry” fraud (up 13% to 371,733 offences). Almost all of this increase was in offences reported to the NFIB via Cifas (up 21% to 250,228 offences). This rise was seen principally in the sub-category of frauds relating to “Cheque, plastic card and online bank accounts” and is thought to have resulted from an increase in the volume of accounts used to purchase goods that have been set up using stolen identities and personal information (for example, applying to open a plastic card account using the identity of an innocent party, and purchasing goods on it).
“All charity fraud” accounted for a relatively small proportion of total fraud offences (less than 1%; 880 offences), but the number of offences increased by 34% from the previous year. Likewise, the category “Business trading fraud” also made up only a small proportion of total fraud offences (less than 1%; 496 offences), but saw an increase of 16% in number of offences, compared to what was recorded the previous year.
“Insurance fraud” also saw an increase in the number of offences recorded (10%) despite only making up a small proportion of total fraud offences (2%; 10,322 offences).This is thought to have resulted specifically from a rise in insurance application frauds, largely due to an increase in the number of individuals attempting to get a cheaper policy by fraudulent means. Initiatives such as MyLicence and the Insurance Fraud Register may also be improving the insurance industry’s detection of such frauds.
Several major categories of fraud saw decreases in the latest year; these included “Pension fraud”, which fell by 58%, “Non-investment fraud”, which fell by 9%, “Telecom industry fraud (misuse of contracts4)”, which fell by 5% and “Advance fee payments”, which fell by 28% compared with the previous year.
The fall in “Advance fee payments” is in contrast with the increase that was last recorded in this category in the year ending September 2015. Data on this type of fraud come solely from reports to Action Fraud and therefore the changes seen may be related to the reduction in the capacity of the Action Fraud call centre since August 2015 rather than a real change in the level of these frauds. The decrease may also be in relation to the tighter regulation of lender loans and the expiry of legitimate PPI claims.
A full breakdown of the types of fraud offences referred to the NFIB by Action Fraud, Cifas and FFA UK in the latest year is presented in Table A5.
Concerning offences recorded by Action Fraud, unlike other crime types (for which recorded crime data are submitted by individual police forces) subnational breakdowns have not previously been available. This reflects both Action Fraud’s role as the national reporting centre for fraud, and the fact that such offences often cross geographical boundaries and can be difficult to pin down to geographic territories.
Following work conducted by the Home Office and Action Fraud, a police force area breakdown of Action Fraud data based on where the individual victim resides, or in the cases of businesses where the business is located, has now been produced. These data are published as Experimental Statistics and presented in Table E14. In contrast with most other crimes, the latest data show there was generally less variation in rates of fraud by police force area, although rates in London and southern areas were slightly higher than those in northern areas.
Further details on the different categories of fraud and how data on them are collected are available in Section 5.4 of the User Guide.
Card and bank account fraud not reported to the police
Data referred to the NFIB by Cifas and FFA UK are known to exclude a significant volume of card and bank account fraud. Cifas do not collect information on some types of plastic card fraud, including “Remote purchase” frauds (those frauds where the cardholder and card are not present at the point of sale, such as use of the card online, over the phone or by mail order), fraud resulting from cards being lost or stolen, or ATM fraud. While FFA UK does collect this information, it only refers crimes to the NFIB in cases where there is intelligence value for the police to aid in investigating and detecting fraud.
FFA UK does, however, collect information from its members on a broader range of bank account and plastic card frauds than those referred to the NFIB using a system referred to as CAMIS and data from this source are shown in Table F205. While these figures are at UK level only, they offer a broader picture of the scale of bank account and plastic card fraud. It is important to note that these data also include those cases referred by FFA UK to the NFIB (presented in Table F18a) and many of them will also be included in the CSEW; for example, individual account holders whose bank has also referred the incident to the NFIB.
In the latest year, FFA UK reported 1.9 million cases of frauds on UK-issued cards, cheque fraud and remote banking fraud (internet, telephone and mobile banking)6, an increase of 46% from the previous year. This compares with a less than 1% decrease in the level of these frauds that were reported by FFA UK to the NFIB. The cases reported to the NFIB are those with intelligence value to the police and are less likely to include incidences of “Remote purchase” fraud, which is the main driver in the overall increase in FFA UK data from CAMIS.
The FFA UK January to June 2016 fraud update attributed recent rises to “the growth of impersonation and deception scams and complex online attacks” where the methods target customers’ personal and financial details, including card data, to facilitate fraud including remote purchase fraud. The report also comments on the increase in fraud relating to lost and stolen cards suggesting that “intelligence from FFA UK members suggests there have been more incidents at ATMs, through distraction thefts and entrapment. Courier scams, in which a scammer visits the victim’s house to collect either cash or a bank card, also continue to play a role”.
In general, the FFA UK figures have been consistent with those shown by the CSEW trend in plastic card fraud, with levels peaking around 2008 to 2010, followed by falls in subsequent years that were likely to be related to the introduction of chip card technology. While the latest CSEW rise in the prevalence of plastic card fraud (from 4.6% to 4.9%) is not statistically significant it appears to mirror the trend observed in FFA UK data from CAMIS.
Further information on trends in payment industry fraud based on industry data collated by FFA UK is available in Fraud the Facts 2016.
Notes:
This figure is taken from Table A4 and includes 4 fraud offences recorded by the police. This differs slightly from the total recorded fraud offences reported in Table A5, which exclude these 4 offences.
Based on whether the internet or any type of online activity was related to any aspect of the offence.
This figure is taken from Table A4 and includes 4 fraud offences recorded by the police. The total fraud offences recorded in England and Wales reported in Table A5 differs slightly, as it excludes these 4 offences.
Frauds within the telecoms sector that are reported to Cifas are subject to a lot of fluctuation as they use a batch reporting system whereby they submit multiple reports in one go, which can refer to incidents occurring over a period of time.
FFA UK publish data on the volume of incidents of frauds on all payment types (including “Remote purchase”), alongside data on financial fraud losses by the value of losses to customers. Latest figures for 2015 are available in their report 2015: Financial Fraud Figures published in March 2016.
It is important to note that number of cases relates to the number of accounts defrauded, rather than the number of victims.
12. Quality and methodology
Data sources – coverage and coherence: Crime Survey for England and Wales
The Crime Survey for England and Wales (CSEW; previously known as the British Crime Survey) is a face-to-face survey in which people resident in households in England and Wales are asked about their experiences of crime in the 12 months prior to the interview. It covers both children aged 10 to 15 and adults aged 16 and over, but does not cover those living in communal establishments (such as care homes, student halls of residence and prisons), or crimes against commercial or public sector bodies.
The CSEW is able to capture a broad range of victim-based crimes1 experienced by those interviewed, not just those that have been reported to, and recorded by, the police. It covers a broad range of victim-based crimes experienced by the resident household population. However, there are some serious, but relatively low-volume offences, such as homicide and sexual offences, which are not included in its main estimates. Although, at the end of the main interview there is a self-completion element (via a tablet computer), where adults aged 16 to 59 are asked about their experience of domestic abuse and sexual violence, and these results are reported separately2.
A major strength of the CSEW has been its ability to compare crime types over time and for this reason the CSEW has changed little over the last 30 years. However, the way in which criminals are operating is changing and they can now take advantage of new technologies, such as the internet, to both expand the scope of existing crime types and develop new ones. Nowhere has this been more apparent than in fraud and cybercrime. As questions aimed at identifying fraud and other cyber offences were not part of the original survey design, it had not previously been possible to include these new offences in the main estimate of CSEW crime.
To address this issue, new questions relating to fraud and computer misuse were introduced onto half the survey sample from October 2015. Sufficient data have now been gathered to produce estimates of fraud and computer misuse and these are published within the “Crime in England and Wales” release again this quarter, after first being published in the year ending March 2016 quarterly bulletin. Details regarding the process in obtaining these new fraud and computer misuse estimates are available in the “Overview on fraud statistics” article.
Since it began, the CSEW has been conducted by an independent (from government or the police) survey research organisation using trained interviewers to collect data from sampled respondents; the interviewers have no vested interest in the results of the survey. For the crime types and population groups it covers, the CSEW has a consistent methodology and is unaffected by changes in levels of public reporting to the police, recording practice or police activity. As such, the survey is widely seen to operate as an independent reality-check of the police figures. The independence of the survey has been further strengthened by the transfer of responsibility from the Home Office to the Office for National Statistics (ONS) in April 2012.
The CSEW has a higher number of reported offences than police recorded crime as the survey is able to capture all offences by those interviewed, not just those that have been reported to the police and then recorded. However, it does cover a narrower range of offences than the police recorded crime collection.
In 2009, the CSEW was extended to cover children aged 10 to 15, and this release also incorporates results from this element of the survey. However, the main analysis and commentary is restricted to adults and households due to the long time series for which comparable data are available.
The CSEW has a nationally representative sample of around 35,000 adults and 3,000 children (aged 10 to 15 years) per year. The response rates for the survey year ending March 2016 were 72% for adults and 66% for children. The survey is weighted to adjust for possible non-response bias and to ensure the sample reflects the profile of the general population.
Data sources – coverage and coherence: Police recorded crime and other sources
Police recorded crime figures are restricted to a subset of notifiable offences that have been reported to and recorded by the police. Therefore, while the police recorded crime series covers a wider population and a broader3 set of offences than the CSEW, it does not include crimes that do not come to the attention of the police or are not recorded by them.
Police recorded crime figures are supplied by the 43 territorial police forces of England and Wales, plus the British Transport Police, via the Home Office, to us. Data on fraud are sourced from Action Fraud, the UK’s national fraud reporting centre; Cifas, the UK-wide fraud and financial crime prevention service; and Financial Fraud Action UK, who co-ordinate fraud prevention activity for the financial services industry.
Police recorded crime is the principal source of subnational crime statistics and for relatively serious, but low volume, crimes that are not well measured by a sample survey. It covers victims (including, for example, residents of institutions and tourists as well as the resident population) and sectors (for example, commercial bodies) excluded from the CSEW sample. Recorded crime has a wider coverage of offences, for example, covering homicide, sexual offences and crimes without a specific, identifiable victim (referred to as “Other crimes against society”) not included in the main CSEW crime count. Police recorded crime also provides good measures of well-reported crimes, but does not cover any crimes that are not reported to, or discovered by, the police. It is also affected by changes in reporting and recording practices. Like any administrative data, police recorded crime will be affected by the rules governing the recording of data, by the systems in place and by operational decisions in respect of the allocation of resources.
As well as the main police recorded crime series, there are additional collections providing detail on offences involving the use of knives and firearms, which are too low in volume to be measured reliably by the CSEW.
Strengths and limitations of the Crime Survey for England and Wales and police recorded crime
| Crime Survey for England and Wales | Police recorded crime |
| Strengths | Strengths |
| Large nationally representative sample survey that provides a good measure of long-term crime trends for the offences and the population it covers (that is, those resident in households) | Has wider offence coverage and population coverage than the CSEW |
| Consistent methodology over time | Good measure of offences that are well-reported to the police |
| Covers crimes not reported to the police and is not affected by changes in police recording practice; therefore is a reliable measure of long-term trends | Primary source of local crime statistics and for lower-volume crimes (for example, homicide) |
| Coverage of survey extended in 2009 to include children aged 10 to 15 resident in households | Provides whole counts (rather than estimates that are subject to sampling variation) |
| Independent collection of crime figures | Time lag between occurrence of crime and reporting results tends to be short, providing an indication of emerging trends |
| Limitations | Limitations |
| Survey is subject to error associated with sampling and respondents recalling past events | Excludes offences that are not reported to, or not recorded by, the police and does not include less serious offences dealt with by magistrates’ courts (for example, motoring offences) |
| Excludes crimes against businesses and those not resident in households (for example, residents of institutions and visitors) | Trends can be influenced by changes in recording practices or police activity |
| Headline estimates exclude offences that are difficult to estimate robustly (such as sexual offences) or that have no victim who can be interviewed (for example, homicides and drug offences) | Not possible to make long-term comparisons due to fundamental changes in recording practice introduced in 1998 and the year ending March 2003[5] |
| Previously, excluded fraud and cybercrime[4] | There are concerns about the quality of recording – crimes may not be recorded consistently across police forces and so the true level of recorded crime may be understated |
Download this table Strengths and limitations of the Crime Survey for England and Wales and police recorded crime
.xls (28.7 kB)Accuracy of the statistics: Crime Survey for England and Wales
Since the CSEW is based on a sample of the population, estimates have a margin of quantifiable and non-quantifiable error associated with them. Non-quantifiable error includes:
- when respondents have recalled crimes in the reference period that actually occurred outside that period (“telescoping”)
- crimes that did occur in the reference period that were not mentioned at all (either because respondents failed to recall a fairly trivial incident or, conversely, because they did not want to disclose an incident, such as a domestic assault)
- respondents saying they reported crimes to police when they did not (a “socially desirable” response)
- some incidents reported during the interview being miscoded (‘interviewer or coder error’)
Unless stated otherwise, all changes in CSEW estimates described in the main text are statistically significant at the 5% level. Since the CSEW estimates are based on a sample survey, it is good practice to publish confidence intervals alongside them; these provide a measure of the reliability of the estimates and can be found in the User Guide tables. Further information on statistical significance can be found in Chapter 8 of the User Guide.
Accuracy of the statistics: Police recorded crime
Police recorded crime figures are a by-product of a live administrative system that is continually being updated as incidents are logged as crimes and subsequently investigated. The police return provisional figures to the Home Office on a monthly basis and each month they may supply revised totals for previously supplied months. The Home Office Crime and Policing Statistics team undertake a series of validation checks on receipt of the data and query outliers with forces who may then re-submit data. Details of these validation checks are given in Section 3.3 of the User Guide, and the differences in data published between the current and preceding publications can be found in Table QT1a.
Police recording practice is governed by the Home Office Counting Rules (HOCR) and the National Crime Recording Standard (NCRS). The HOCR have existed in some form since the 1920s, with substantial changes in 1998. The NCRS was introduced in April 2002 following a critical report from Her Majesty’s Inspectorate of Constabulary (HMIC) in 2000 (Povey, 2000), which showed that there was a problem with differing interpretation of the HOCR that resulted in inconsistent recording practices across forces.
Following an assessment of crime statistics by the UK Statistics Authority, published in January 2014, the statistics based on police recorded crime data have been found not to meet the required standard for designation as National Statistics.
In their report, the UK Statistics Authority set out 16 requirements that needed addressing for the statistics to meet National Statistics standards. We are working in collaboration with the Home Office Crime and Policing Statistics team and HMIC to address these requirements. A summary of actions taken in response to these requirements is available.
Full details on the history of the assessment and auditing of the quality and accuracy of police recorded crime statistics carried out in recent years is given in Section 3.3 of the User Guide. Since the UK Statistics Authority assessment decision, HMIC have undertaken an inspection of the integrity of police recorded crime (carried out between December 2013 and August 2014), which reviewed a total of 10,267 reports of crime recorded between November 2012 and October 2013 across all 43 police forces in England and Wales.
The final report on findings from the HMIC inspections, Crime-recording: making the victim count, was published on 18 November 2014 and separate crime data integrity force reports for each of the 43 police forces in England and Wales were published on 27 November 2014.
HMIC concluded that, across England and Wales as a whole, an estimated 1 in 5 offences (19%) that should have been recorded as crimes were not. The greatest levels of under-recording were seen for violence against the person offences (33%) and sexual offences (26%). However, there was considerable variation in the level of under-recording across the different offence types investigated. For other crime types: an estimated 14% of criminal damage and arson offences that should have been recorded as crimes were not; 14% of robbery offences; 11% of burglary offences; and 17% of other offences (excluding fraud)6.
In November 2015, HMIC wrote to all police forces advising that they would be commencing an unannounced programme of rolling inspections of police forces on an ongoing basis. A series of reports based on the first group of forces inspected, Sussex Police force, which was rated as “good” (95% of crimes recorded correctly), Staffordshire Police force, which was rated as “requiring improvement” (91% of crimes recorded correctly) and Greater Manchester Police force, which was rated “inadequate” (85% of crimes recorded correctly), were published on the 25 August 2016. For more information on this new programme of inspections and details on the scheduled inspections, see section 3.3 of the User Guide to Crime Statistics for England and Wales.
The renewed focus on the quality of crime recording means that caution is needed when interpreting statistics on police recorded crime. While we know that it is likely that improvements in compliance with the NCRS have led to increases in the number of crimes recorded by the police, it is not possible to quantify the scale of this, or assess how this effect varied between different police forces. In volume terms, police recorded crime for England and Wales as a whole has increased by 8% in the latest year compared with the previous year and 40 police forces (including the British Transport Police) have recorded overall increases in levels of crime.
Apparent increases in police force area data may reflect a number of factors, including tightening of recording practice, increases in reporting by victims and also genuine increases in the levels of crime. It is thought that incidents of violence are more open to subjective judgements about recording and thus more prone to changes in police practice. A number of forces have also shown large increases in sexual offences, which are thought to reflect both a greater willingness among victims to report such crimes and improved compliance with recording standards for sexual offences.
More information regarding the coverage, coherence and accuracy of the CSEW and police recorded crime can be found in the User Guide to Crime Statistics for England and Wales, the Crime Statistics Quality and Methodology Information report and (for CSEW only) the CSEW technical report.
Notes:
- Victim-based crimes are those offences with a specific identifiable victim. These include the CSEW categories of “Violence”, “Robbery”, “Theft offences”, “Criminal damage” (and recently “Fraud” and “Computer misuse”) and the police recorded crime categories of “Violence against the person”’, “Sexual offences”, “Robbery”, “Theft offences” and “‘Criminal damage and arson”.
- Focus on Violent Crime and Sexual Offences: Year ending March 2015 has more detailed information.
- The coverage of police recorded crime is defined by the Notifiable Offence List, which includes all indictable and triable-either-way-offences (offences which could be tried at a Crown Court) and a few additional closely related summary offences (which would be dealt with by magistrates’ courts). Appendix 1 of the User Guide has more information on the classifications used for notifiable crimes recorded by the police.
- From 1 October 2015, the offence coverage of the CSEW was extended to include fraud experienced by the adult population. Estimates from these new questions were published for the first time in the ‘Crime in England and Wales, year ending Mach 2016’ release.
- Section 3.3 of the User Guide has more information.
- The range of crime recording accuracy for each of the crime types listed was +/-3. For more information, see section 7.51 of the HMIC publication Crime Recording Making the Victim Count.