Table of contents
- Main points
- Statistician’s quote
- Things you need to know
- Excess winter mortality (EWM) in England and Wales falls to be in line with average trends
- Period of increased mortality extends beyond winter months in 2015/16
- Females and the elderly are most affected by excess winter mortality
- Predominant strain of influenza in winter 2015/16 impacted the young more than the elderly
- Respiratory diseases caused most excess winter deaths
- Relationship between excess winter mortality and temperature is complex
- Warmer winter than average with excess winter deaths back in line with average trends
- Geographical patterns of excess winter mortality
- Causes of excess winter mortality
- Further information
- References
- Quality and methodology
1. Main points
Excess winter mortality in England and Wales was back in line with average trends in 2015/16. There were an estimated 24,300 excess winter deaths where 15% more deaths occurred in winter months than non-winter months.
In 2015/16 excess winter mortality significantly decreased from 2014/15 when the number of excess winter deaths was uncommonly high.
There were similar levels of excess winter mortality across all age groups, with those aged 0 to 64 affected more than in previous years and those aged 85 and over affected less than previous years.
Following the pattern of previous years there were more excess winter deaths in females than males in 2015/16. Excess winter deaths for both sexes decreased from the 2014/15 period.
More than one-third of all excess winter deaths were caused by respiratory diseases in England and Wales in 2015/16.
There is no clear geographical pattern in excess winter mortality over time, however, in 2015/16 Wales had the highest excess winter mortality index at 17% and East of England had the lowest excess winter mortality index at 13%.
Back to table of contents2. Statistician’s quote
"One of the key factors behind the lower excess mortality this winter was a fall in the number of deaths among the elderly. This was mainly due to the most prevalent strain of the flu virus impacting younger people rather older people, who are more at risk".
Dr Annie Campbell, Health Analysis and Life Events, Office for National Statistics.
Back to table of contents3. Things you need to know
In common with other countries, more people die in the winter than in the summer in England and Wales. This statistical bulletin presents provisional figures for excess winter deaths (EWD, also referred to as excess winter mortality – EWM) in England and Wales for the winter period 2015/16 and final figures for the winter period 2014/15. Historical trends from 1950/51 onwards are also provided for comparison. Figures are presented by sex, age, region and cause of death. Information on temperature and influenza incidence is also given to add context to the mortality figures.
Method for calculating excess winter mortality
Excess deaths
Johnson and Griffiths (2003) investigated seasonal mortality and reported that historically, above-average mortality is typically seen between December and March in England and Wales. Therefore, our standard method defines the winter period as December to March, and compares the number of deaths that occurred in this winter period with the average number of deaths occurring in the preceding August to November and the following April to July. The calculation used is presented below:
EWM = winter deaths - average non-winter deaths
This produces the number of excess winter deaths (EWDs). Provisional EWD figures are produced for the most recent winter using special estimation methods (see the “How the output is created” section of the Quality and Methodology Information document), and so are rounded to the nearest 100. Final EWM figures for the previous winter are rounded to the nearest 10.
Excess winter mortality (EWM) index
The EWM index is calculated so that comparisons can be made between sexes, age groups and regions, and is calculated as the number of excess winter deaths divided by the average non-winter deaths:
EWM Index = (EWM / average non-winter deaths) x 100
The EWM index is presented with 95% confidence intervals, which are calculated as:
EWM index ± 1.96 x (EWM Index / √ EWM)
The EWM index shows the percentage of extra deaths that occurred in the winter and is reported to 1 decimal place.
More details about how EWM is calculated and how to interpret and use confidence intervals are available in the quality and methodology section.
Back to table of contents4. Excess winter mortality (EWM) in England and Wales falls to be in line with average trends
There were an estimated 24,300 excess winter deaths (EWDs) in England and Wales in the 2015/16 winter period. This represents an excess winter mortality index of 15%; that is 15% more deaths occurred in winter compared to the non-winter months. The number of EWDs has almost halved since the 2014/15 period and is closer to the 5-year average (years 2011/12 to 2015/16) as shown in Figure 1.
Figure 1: Excess winter deaths and 5-year central moving average, England and Wales, 1950/51 to 2015/161,2,3,4
Source: Office for National Statistics
Notes:
- EWM figures are based on deaths occurring in each period (August through to the following July). Numbers of deaths from January to July 2016 are provisional, and have been adjusted to take account of late registrations (see Excess Winter Mortality Quality and Methodology Information document).
- Figures for the latest winter are provisional and are rounded to the nearest 100, figures for all other winters are final and are rounded to the nearest 10.
- Central moving averages were calculated using the winter period of interest, along with the two winter periods before and two periods after.
- Data include non-residents who died in England or Wales.
Download this chart Figure 1: Excess winter deaths and 5-year central moving average, England and Wales, 1950/51 to 2015/16^1,2,3,4^
Image .csv .xlsExcess winter deaths in 2015/16 were back in line with average trends. The large decrease in EWD from 2014/15 to 2015/16 can largely be explained by the higher than average number of EWDs in 2014/15 rather than unusually low EWDs in 2015/16. It can also, in part, be explained by a different predominant strain of the influenza virus that had a reduced effect on the elderly in 2015/16, with impact mainly seen in young adults (Public Health England, 2016).
Large fluctuation in EWDs is common and trends over time are not smooth. To provide a clear trend over time and to smooth out short-term fluctuations in EWDs a 5-year moving average is calculated and shown in Figure 1. There has been a steady decrease in EWDs since the 1950/51 winter period that has leveled off in recent years. Moreover, it appears that the higher than usual EWDs in 2014/15 were not the start of an upward trend in EWDs but instead a fluctuation in the time series.
Back to table of contents5. Period of increased mortality extends beyond winter months in 2015/16
For the period August 2015 to July 2016 the peak in daily deaths occurred towards the end of January 2016, this is later than that reported in recent years. Typically, a pronounced increase in mortality is seen over the winter months of December to March as seen in the 5-year average (see Figure 2), however for the 2015/16 period the increase in mortality was not as prominent over the winter months. The number of daily deaths was lower than the 5-year average during December. And then was elevated through most of January, February, March and April. Indeed, the number of daily deaths was higher than the 5-year average for 267 of the 366 days in the 2015/16 period.
Additionally, there was an unusual peak in mortality around 19 July 2016. Trends in provisional temperature data from this period show that there were higher than average temperatures around 19 July 2016 (Met Office, 2016), which may explain the peak in mortality at this time. Brown et al (2010) found there to be a small but significant relationship between extreme summer temperatures and excess mortality. According to the findings of Basu and Samet (2002) the elderly, infants and those with preexisting respiratory and cardiovascular diseases are most at risk of death in a heat wave. Central England daily temperatures from the Met Office Hadley Centre show that the highest temperature of the year was observed on 19 July 2016 with a mean temperature of 23°C and maximum temperature of 31°C.
The increased daily deaths in the non-winter months can impact on the calculation of excess winter deaths. If there are high daily deaths in some non-winter months then excess winter deaths will appear low, even if there are high numbers of deaths in the winter period. Increased daily deaths in the non-winter months can therefore mask high excess mortality in winter months.
Figure 2: Number of daily deaths, and 5-year average daily deaths, England and Wales, August 2015 to July 2016 1,2,3
Source: Office for National Statistics
Notes:
- Figures are based on deaths occurring each day. Numbers of deaths from January to July 2016 are provisional, and have been adjusted to take account of late registrations (see the Excess Winter Mortality Quality and Methodology Information document).
- 5 year averages for each day are calculated using data from the previous 5 years, excluding the current year.
- Mortality data include non-residents who died in England or Wales.
Download this chart Figure 2: Number of daily deaths, and 5-year average daily deaths, England and Wales, August 2015 to July 2016 ^1,2,3^
Image .csv .xls6. Females and the elderly are most affected by excess winter mortality
Of the 24,300 EWDs in 2015/16, 47% were males (11,400 EWDs) and 53% were females (12,900 EWDs). EWM is generally higher in females than males which may in part be explained by the greater proportion of females aged over 85 compared to males (65% of the population aged 85 and over are female; (ONS, 2015a).
Figures 3a and b show the excess winter mortality (EWM) index for males and females respectively for the last 3 winters by age group. The EWM index describes how many more people died in winter than in non-winter months expressed as a percentage of the average number of deaths in the non-winter months. For both males and females those aged 85 and older had the highest EWM index; approximately 17% for both males and females. For males, unusually, the next highest EWM index was for those aged 65 or younger (EWM index of 15%). In previous years, for both males and females there has been an increase in EWM index from those aged 0 to 65 through to the oldest ages (85+), however this trend was not as prominent in 2015/16; each age group has a similar EWM index. This is also reflected in the rate of consultations for influenza-like-illnesses with general practitioners (Public Health England, 2016).
From 2014/15 to 2015/16 the EWM index decreased significantly in all age groups apart from those aged 0 to 64 years where there were significant increases in EWM for both males and females. For the older age groups, the EWM index has roughly halved for both males and females. Specifically, the EWM index for males aged 85 and older has decreased by 53% from 36% in 2014/15 to 17% in 2015/16. For females aged 85 and older, there was a 60% decrease in EWM index from 42% in 2014/15 to 17% in 2015/16. This is likely due to the reduced impact of the predominant influenza strain on the elderly (Public Health England, 2016).
The EWM index for females of all ages decreased to 15% (down from 31% in 2014/15) compared with 14% (down from 23% in 2014/15) for males of all ages.
Figure 3a: Excess winter mortality index by age group, males, England and Wales, 2013/14 to 2015/161,2,3,4,5
Source: Office for National Statistics
Notes:
- EWM figures are based on deaths occurring in each period (August through to the following July). Numbers of deaths from January to July 2016 are provisional, and have been adjusted to take account of late registrations (see Excess Winter Mortality Quality and Methodology Information document).
- Figures for the latest winter are provisional and are rounded to the nearest 100, figures for all other winters are final and are rounded to the nearest 10.
- Totals for all ages will not be equal to the sum of the individual age groups due to rounding.
- The excess winter mortality (EWM) index is calculated as excess winter deaths divided by the average non-winter deaths, expressed as a percentage.
- Data include non-residents who died in England or Wales.
Download this chart Figure 3a: Excess winter mortality index by age group, males, England and Wales, 2013/14 to 2015/16^1,2,3,4,5^
Image .csv .xls
Figure 3b: Excess winter mortality index by age group, females, England and Wales, 2013/14 to 2015/161,2,3,4,5,6
Source: Office for National Statistics
Notes:
- EWM figures are based on deaths occurring in each period (August through to the following July). Numbers of deaths from January to July 2016 are provisional, and have been adjusted to take account of late registrations (see Excess Winter Mortality Quality and Methodology Information document).
- Figures for the latest winter are provisional and are rounded to the nearest 100, figures for all other winters are final and are rounded to the nearest 10.
- The lower and upper confidence limits (LCL and UCL) form a confidence interval, which is a measure of the statistical precision of an estimate.
- Totals for all ages will not be equal to the sum of the individual age groups due to rounding.
- The excess winter mortality (EWM) index is calculated as excess winter deaths divided by the average non-winter deaths, expressed as a percentage.
- Data include non-residents who died in England or Wales.
Download this chart Figure 3b: Excess winter mortality index by age group, females, England and Wales, 2013/14 to 2015/16^1,2,3,4,5,6^
Image .csv .xls7. Predominant strain of influenza in winter 2015/16 impacted the young more than the elderly
Influenza is a respiratory disease caused by a viral infection that affects the lungs and airways (World Health Organisation, 2008). Influenza infections can become potentially life-threatening when complications such as bacterial pneumonia occur. Those at most risk of developing complications are persons with other underlying health conditions, and the elderly (Public Health England, 2014a) and such complications may result in hospitalisation or death (Public Health England, 2014b). respiratory disease is one of the leading causes of excess winter deaths, where in 2015/16 there were 41% more respiratory deaths in the winter months than non-winter months and 35% of all excess winter deaths had a respiratory disease as the underlying cause (8,600 respiratory deaths out of 24,300 excess winter deaths). Nearly three-quarters (72%) of these respiratory deaths were from those aged 75 or older.
Public Health England report there were moderate levels of influenza activity within the community in England and Wales in 2015/16 and this activity peaked later in the season than in the previous year (Public Health England, 2016a). Figure 4 plots the weekly number of deaths and weekly influenza-like illness (ILI) consultation rate in primary care from week 31 in 1999 to week 30 in 2016. The peak of the ILI consultation rate for 2015/16 was reached in week 11 of 2016 (28 consultations per 100,000 population) whereas last season the ILI consultation rate peaked in week 1 of 2015. For weekly deaths, in 2015/16 the highest number of weekly deaths occurred in week 3 of 2016 with 11,459 deaths, however, the number of weekly deaths remained high up until week 11 of 2016 (11,125 deaths) coinciding with the peak of the ILI consultation rate. Following week 11 of 2016 there was a decline in both weekly deaths and the weekly ILI consulation rate.
The predominant influenza virus in winter 2015/16 was influenza A(H1N1) pdm09 (Public Health England, 2016). This strain of flu had a particularly noticeable impact on younger adults and children with the highest ILI consultation rates occurring in those aged 5 to 14 (37 per 100,000 population) and 15 to 44 (37 per 100,000 population). This pattern of activity is similar to the previous outbreak of this strain of the influenza virus in 2010/11 (Public Health England, 2011) but the extent of the activity was much lower this season compared to 2010/11 which saw very high levels of influenza (Public Health England, 2016).
The levels of influenza activity in the community in 2015/16 were similar to that reported in 2014/15 but this year activity occurred much later in the season (Public Health England, 2016). Despite this similarity in level, EWM was much lower in 2015/16 than in 2014/15. This is likely related to the strain of influenza virus that was most prominent in each of the two seasons. The predominant strain of influenza in 2014/15 was A(H3N2) and was particularly virulent in older people, an already at-risk group, whilst in 2015/16 the predominant strain of influenza, A(H1N1)pdm09, was a particular problem particularly in terms of hospitalisations and ICU admissions in younger people and had less impact on the elderly (Public Health England, 2016). In addition Public Health England (2016a) report a decrease in uptake of influenza vaccinations in those aged six months to under 65 with one or more underlying clinical risk factor (excluding pregnant women without other risk factors and carers) from 50% in 2014/15 to 45% in 2015/16 in England. In Wales a similar pattern was observed where uptake of flu vaccinations decreased from 49% in 2014/15 to 47% in 2015/16 for those aged 6 months to under-65 with one or more underlying clinical risk factor (excluding pregnant women without other risk factors, morbidly obese patients and carers).
Figure 4: Weekly deaths from all causes and Royal College of General Practitioners (RCGP) and Public Health Wales (PHW) influenza-like illness (ILI) consultation rates per 100,000 population, England and Wales, 1999 to 20161,2,3
Source: Office for National Statistics, The Royal College of General Practitioners Research and Surveillance Centre and Public Health Wales
Notes:
- Figures are based on deaths occurring each week. Numbers of deaths from January to July 2016 are provisional, and have been adjusted to take account of late registrations (see Excess Winter Mortality Quality and Methodology Information Document).
- The method for calculating ILI rates changed for data from week number 201531, so rates from this week onwards are not directly comparable to previous weeks.
- Mortality data include non-residents who died in England or Wales.
Download this chart Figure 4: Weekly deaths from all causes and Royal College of General Practitioners (RCGP) and Public Health Wales (PHW) influenza-like illness (ILI) consultation rates per 100,000 population, England and Wales, 1999 to 2016^1,2,3^
Image .csv .xls8. Respiratory diseases caused most excess winter deaths
As shown in Figure 5, respiratory diseases (ICD-10 codes J00-J99) remained the most prominent underlying cause of excess winter deaths, this cause of death category had an EWM index of 41% in 2015/16. This means that there were 41% more deaths from respiratory deaths in the winter months than there were in the non-winter months. Although this is a decrease from the 2014/15 period this is still greater than the 30% reported in the 2013/14 period. The 8,600 excess winter deaths from respiratory diseases accounted for over a third of all winter excess winter deaths (35%, 8,600 of 24,300 deaths). Pneumonia accounted for the largest proportion of these deaths but the prominence of this cause category is also likely related to the relationship between EWM and a range of bacterial and viral respiratory pathogens including influenza.
Figure 5: Excess winter mortality index, by underlying cause of death, England and Wales, 2013/14 to 2015/161,2,3,4,5
Source: Office for National Statistics
Notes:
- Underlying cause of death is defined using the International Classification of Diseases, Tenth Revision (ICD-10).
- Figures are based on deaths occurring in each period (August through to the following July). Numbers of deaths from January to July 2016 are provisional, and have been adjusted to take account of late registrations (see Excess Winter Mortality Quality and Methodology Information document).
- The excess winter mortality (EWM) index is calculated as excess winter deaths divided by the average non-winter deaths, expressed as a percentage.
- A more detailed version of Figure 5 showing excess winter mortality, broken down by sex and age group can be found in reference table 1
- Figures for England and Wales include deaths of non-residents.
Download this chart Figure 5: Excess winter mortality index, by underlying cause of death, England and Wales, 2013/14 to 2015/16^1,2,3,4,5^
Image .csv .xlsCirculatory diseases (ICD-10 codes I00-I99) were one of the leading causes of death in 2015 (ONS, 2016a) and accounted for nearly a quarter of all excess winter deaths (24%; 5,900 out of 24,300). Excess winter deaths from circulatory diseases decreased from an EWM index of 23% in 2014/15 to EWM index of 14% in 2015/16. This seasonal effect is not as strong as that seen in respiratory diseases or dementia and Alzheimer’s disease.
Dementia and Alzheimer’s disease (ICD-10 codes F01, F03 and G30) was the leading cause of death in 2015 (ONS, 2016a) and shows seasonality in mortality rates. The disease accounted for 18% of all excess winter deaths (4,300 out of 24,300 excess deaths) and approximately 23% more deaths from dementia and Alzheimer’s disease occurred in winter months than non-winter months.
Similar relationships between underlying cause and age can be seen for both males and females. Reference Table 1 is a more detailed version of Figure 5 and shows the number of excess winter deaths (EWDs) and the excess winter mortality (EWM) index in England and Wales for the winters of 1991/92 to 2015/16, by sex and age group for circulatory diseases, dementia and Alzheimer’s disease and injury and poisoning (up to 2014/15).
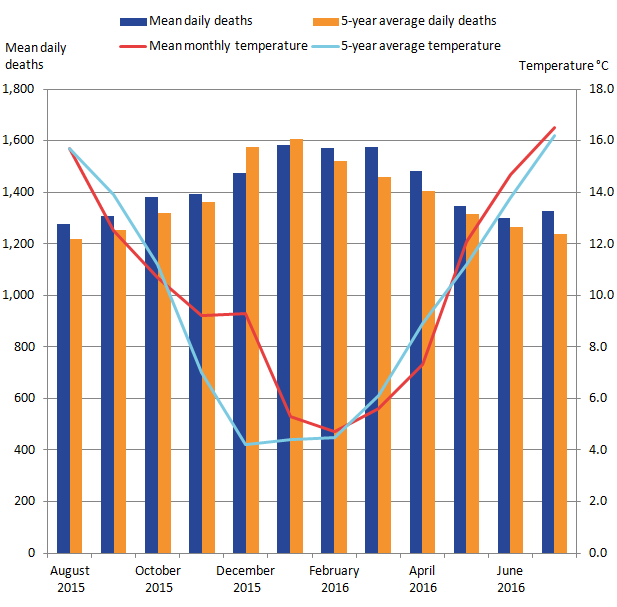
Back to table of contents9. Relationship between excess winter mortality and temperature is complex
Research has shown that as the temperature gets colder mortality does increase, but temperature is only able to explain a small part of the variance in excess winter mortality Brown et al. 2010). A more detailed explanation of this relationship can be found in the 2015 version of this bulletin. Figure 6 shows for the 2015/16 period the mean number of daily deaths each month and the 5-year average. Also shown are the mean monthly temperatures and the corresponding 5-year average for the 2015/16 period. The usual seasonal peak in mortality during the winter period was less pronounced in 2015/16 than in recent years and compared to the 5-year average. In the winter period, the months of December and January 2015/16 had fewer mean daily deaths than the 5-year average; however there were more deaths than the 5-year average for February and March. Indeed, all non-winter months throughout the rest of the period were above the 5-year average. The month with the highest mean daily deaths was January with 1,584 deaths; however February and March also had mean daily deaths of 1,570 and 1,575 respectively, a pattern not consistent with the 5-year average.
Above average temperatures were observed from November to February, with a particularly high average temperature in December. December was the month with the greatest negative difference from the 5-year average in terms of number of deaths and temperature, supporting a relationship between cold weather and excess mortality.
Figure 6: Mean number of daily deaths each month and mean monthly temperatures, England and Wales, August 2015 to July 20161,2,3
Source: Office for National Statistics and The Met Office
Notes:
- The mean number of daily deaths is based on deaths occurring in each month. Numbers of deaths from January to July 2016 are provisional, and have been adjusted to take account of late registrations (see Excess Winter Mortality Quality and Methodology Information document).
- 5-year averages for each month are calculated using data from the previous five years, excluding the current year.
- Data include non-residents who died in England or Wales.
Download this image Figure 6: Mean number of daily deaths each month and mean monthly temperatures, England and Wales, August 2015 to July 2016^1,2,3^
.png (50.4 kB) .xls (20.5 kB)
10. Warmer winter than average with excess winter deaths back in line with average trends
Excess winter deaths were back within a typical range observed within the last decade following unusually high EWD in 2014/15. Figure 7 shows the mean winter temperaure and excess winter deaths for each winter period from 1999/00 to 2015/16. It can be seen that most winter periods have excess winter deaths within the range 20,000 and 30,000 deaths with winter periods every 3 to 4 years having increased excess winter deaths. The 2015/16 winter period falls within the range of 20,000 to 30,000 excess winter deaths. Figure 7 also shows a weak relationship between temperature and excess winter deaths. Increased excess winter deaths are not always coupled with unusually cold winters and conversely winters with relatively few excess winter deaths are not always coupled with milder winter temperatures indicating that factors other than temperaure, such as influenza, are driving trends in excess winter mortality.
Figure 7: Excess winter deaths and average winter temperature, England and Wales, 1999/2000 to 2015/161,2,3,4
Source: Office for National Statistics and The Met Office
Notes:
- EWM figures are based on deaths occurring in each period (August through to the following July). Numbers of deaths from January to July 2016 are provisional, and have been adjusted to take account of late registrations (see Excess Winter Mortality Quality and Methodology Information Document).
- Figures for the latest winter are provisional and are rounded to the nearest 100, figures for all other winters are final and are rounded to the nearest 10.
- Mean winter temperature is calculated using average monthly temperatures from December to March.
- Data include non-residents who died in England or Wales.
Download this chart Figure 7: Excess winter deaths and average winter temperature, England and Wales, 1999/2000 to 2015/16^1,2,3,4^
Image .csv .xls11. Geographical patterns of excess winter mortality
Excess winter mortality decreased in all regions of England and in Wales in 2015/16
Figures 8a (map) and 8b show excess winter mortality indices for the regions of England and for Wales. Figure 8a shows the EWM index for each region for the most recent period (2015/16) whereas Figure 8b shows the index for each region for the latest 3 periods.
The highest regional EWM index in 2015/16 was 17% in Wales followed by 15% in both the South West and Yorkshire and the Humber, whereas the lowest EWM index was 13% in the East of England.
As shown in Figure 8a there is not a clear “north-south divide” as can be seen in a number of different mortality statistics such as avoidable mortality (ONS, 2016b), drug-related deaths (ONS, 2016c) and sub-national life expectancy (ONS, 2015b). The EWM index for Wales was significantly higher than the England and Wales average and higher than any region of England in 2015/16. However, in 2014/15 Wales had the lowest EWM index and was the third lowest in 2013/14 indicating that there is not a consistent regional pattern in EWM over time.
Figure 8a: Excess winter mortality (EWM) for regions of England, and Wales, 2015/16

Source: Office for National Statistics licensed under the Open Government Licence v.3.0. Contains OS data © Crown copyright 2016
Notes:
- EWM figures are based on deaths occurring in each period. Numbers of deaths from January to July 2016 are provisional, and have been adjusted to take account of late registrations (see Excess Winter Mortality Quality and Methodology Information document).
- The excess winter mortality (EWM) index is calculated as excess winter deaths divided by the average non-winter deaths, expressed as a percentage.
- Figures for the English regions and Wales only include deaths from those usually resident in those areas. The figure for England and Wales combined includes deaths from those not usually resident in England or Wales.
- Based on boundaries as of August 2016.
Download this image Figure 8a: Excess winter mortality (EWM) for regions of England, and Wales, 2015/16
.png (153.7 kB) .xls (19.5 kB)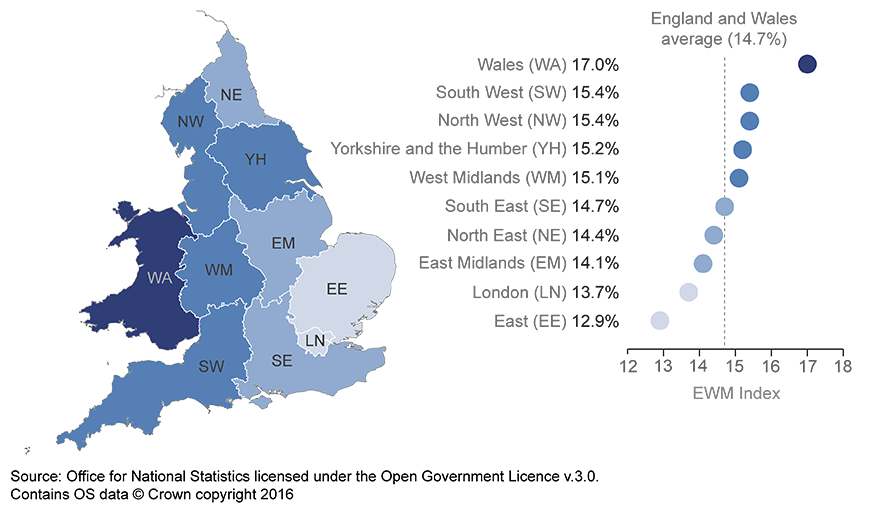
Figure 8b presents the EWM indices for each region of England and for Wales for the most recent 3 winter periods. Regions are ordered by EWM index from highest to lowest for the 2015/16 period. EWM has significantly reduced in every region from the 2014/15 period to the 2015/16 period but the rate was still higher than that observed in the 2013/14 period for each region.
Figure 8b: Excess winter mortality for regions of England, and Wales, 2013/14 to 2015/161,2,3,4
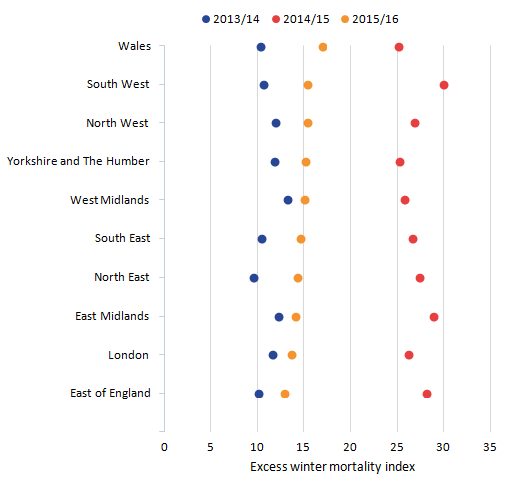
Source: Office for National Statistics
Notes:
- EWM figures are based on deaths occurring in each period. Numbers of deaths from January to July 2016 are provisional, and have been adjusted to take account of late registrations (see Excess Winter Mortality Quality and Methodology Information document).
- The excess winter mortality (EWM) index is calculated as excess winter deaths divided by the average non-winter deaths, expressed as a percentage.
- Figures for England, English regions and Wales exclude deaths of persons usually resident in each area. Figures for England and Wales combined also include deaths of non-residents.
- Based on boundaries as of August 2016.
Download this image Figure 8b: Excess winter mortality for regions of England, and Wales, 2013/14 to 2015/16^1,2,3,4^
.png (17.1 kB) .xls (19.5 kB)
Typically, regional EWM indices are variable with no consistent trends over time. This is clear from Figure 8b. In 2015/16 the areas with the highest EWM indices were Wales, the South West and Yorkshire and Humber, whereas in 2014/15 the highest EWM indices were observed in South West England and the East Midlands, and in 2013/14 the highest EWM indices were found in the East Midlands and West Midlands. The patterns for lowest EWM are similarly inconsistent; the lowest index observed in 2015/16 was East of England, in 2014/15 was Wales and in 2013/14 it was the North East.
Local authorities
Information presented in the earlier sections of this report is based upon provisional excess winter mortality (EWM) for 2015/16 whereas this section presents final EWM figures from 2014/15 for local authorities of England and Wales. Local area EWM data are not available for the most recent period (2015/16) because the data are provisional and the estimation method used to produce national and regional figures is not reliable for small geographic areas using provisional data.
As with regional EWM figures, there were no consistent patterns in EWM figures over time across local authorities in England and Wales.
For England, the local authority with the highest EWM index was Lincoln with 54% more deaths occurring in the winter period than the non-winter months. This was a large increase from an EWM index of 11% in the 2013/14 period. Tonbridge and Malling in Kent had the lowest EWM index in 2014/15 with 9% more deaths occurring in winter than in non-winter months; a decrease from 14% in 2013/14. Both of these local authorities highlight the large variation in EWM across time and geographical areas.
Within Wales, the local authority with the highest EWM index in 2014/15 was Torfaen with 40% more deaths occurring in the winter months than non-winter months. Blaenau Gwent had the lowest EWM index in 2014/15 with 12% more deaths occurring in winter than non-winter months. In 2013/14 the opposite pattern was observed, Torfaen had the lowest EWM in Wales whereas Blaenau Gwent had the highest EWM in Wales perfectly illustrating the lack of geographical or short-term temporal trends in EWM.
Back to table of contents12. Causes of excess winter mortality
A study by Healy (2003) showed that excess winter mortality (EWM) varied widely within Europe. The results show that countries with low winter temperatures in Scandinavia and Northern Europe, such as Finland and Germany, had very low rates of EWM. Conversely, countries with very mild winter temperatures in Southern Europe such as Portugal and Spain had very high rates of EWM. England and Wales both have higher than average EWM and exhibit high variation in seasonal mortality. These results were echoed in a more recent study by Fowler et al (2014).
There are many reasons why countries with milder winter climates have such a high level of winter mortality. For example, people who live in countries with warmer winters tend to take fewer precautions against the cold. The Eurowinter group (1997) reported that compared with people living in countries with cold winters, those from warmer countries were less likely to wear warm protective clothing in cold weather.
Countries with milder winters also tend to have homes with poorer thermal efficiency (for example, fewer homes have cavity wall insulation and double glazing), which makes it harder to keep homes warm during the winter (Healy, 2003). It has been shown that low indoor temperature is associated with higher EWM from cardiovascular disease in England (Wilkinson et al., 2001).
Although EWM is associated with low temperatures, conditions directly relating to cold, such as hypothermia, are not the main cause of EWM. The majority of additional winter deaths are caused by cerebrovascular diseases, ischaemic heart disease, respiratory diseases and dementia and Alzheimer’s disease. Although cancer causes more than a quarter of all deaths annually, previous research by Johnson and Griffiths (2003) found that there was no clear seasonal pattern for these deaths.
The cold can have various physiological effects, which may lead to death in vulnerable people. Woodhouse et al (1993) reported that colder home temperature was associated with increased blood pressure in older people. The Eurowinter group (1997) noted that cold causes haemoconcentration, which leads to thrombosis, and that cold can also lower the immune system’s resistance to respiratory infections. Additionally, the level of influenza circulating in the population increases in winter. In vulnerable groups, for example in the elderly or those with pre-existing health problems, influenza can lead to life-threatening complications, such as bronchitis or secondary bacterial pneumonia (Public Health England, 2014).
Previous research has shown that although mortality does increase as it gets colder, temperature only explains a small amount of the variance in winter mortality, and high levels of EWM can occur during relatively mild winters (Brown et al, 2010). Curwen and Devis (1988) showed that both temperature and levels of influenza were important predictors of excess winter mortality. The relationship between temperature, influenza and winter mortality is complex.
Back to table of contents13. Further information
We only hold mortality data for deaths registered in England or Wales. Excess winter mortality statistics for Scotland and Northern Ireland are the responsibility of National Records of Scotland (NRS) and the Northern Ireland Statistics and Research Agency (NISRA) respectively.
Earlier reports for excess winter mortality in England and Wales were published in the autumn edition of Health Statistics Quarterly.
Back to table of contents14. References
Basu, R., and Samet, J. M. (2002) ‘Relation between elevated ambient temperature and mortality: A review of the epidemiologic evidence’. Epidemiologic reviews, 24 (2), 190 to 202, accessed on 14 November 2016.
Brown G, Fearn V and Wells C (2010) ‘Exploratory analysis of seasonal mortality in England and Wales, 1998 to 2007’. Health Statistics Quarterly 48, 58 to 81, accessed on 18 October 2014.
Curwen M and Devis T (1988) ‘Winter mortality, temperature and influenza: has the relationship changed in recent years?’ Population Trends 54, 17 to 20, 18 October 2014.
The Eurowinter group (1997) ‘Cold exposure and winter mortality from ischaemic heart disease, cerebrovascular disease, respiratory disease, and all causes in warm and cold regions of Europe’ The Lancet 349, 1341 to 1346.
Fowler et al (2014) ‘Excess winter deaths in Europe: a multi-country descriptive analysis’.
Healy J D (2003) ‘Excess winter mortality in Europe: a cross country analysis identifying key risk factors’, accessed on 18 October 2014.
Johnson H and Griffiths C (2003) ‘Estimating excess winter mortality in England and Wales’, Health Statistics Quarterly 20, 19 to 24, accessed 21st October 2014.
The Met Office (2016), Summer 2016 summary, accessed on 13 September 2016.
Met Office Hadley Centre (2016) Central England temperature Data, accessed on 04 October 2016.
ONS (2015a) ‘Population estimates for UK, England and Wales, Scotland and Northern Ireland: mid-2015’, accessed on 14 November 2016.
ONS (2015b) ‘Life expectancy at birth and at age 65 by local areas in England and Wales: 2012 to 2014’, accessed on 14 November 2016.
ONS (2016a) ‘Deaths registered in England and Wales (Series DR): 2015’ accessed 14 November 2016.
ONS (2016b) ‘Avoidable mortality in England and Wales: 2014’, accessed on 3 November 2016.
ONS (2016c) ‘Deaths related to drug poisoning in England and Wales: 2015 registrations’, accessed on 31 October 2016.
Public Health England (2011) ‘Surveillance of influenza and other respiratory viruses in the UK: 2010 to 2011 report’ accessed 3 November 2015.
Public Health England (2014a) ‘Seasonal influenza: guidance, data and analysis’, accessed 7 November 2014.
Public Health England (2014b) ‘Sources of UK Flu data- influenza surveillance in the UK’ accessed on 22 October 2014.
Public Health England (2016) ‘Surveillance of influenza and other respiratory viruses in the United Kingdom: winter 2015 to 2016’, accessed on 08 November 2016.
World Health Organisation (2008) ‘ICD-10 International Statistical Classification of Diseases and Related Health Problems’ accessed 31 October 2014.
Wilkinson P, Landon M, Armstrong B, Stevenson S, Pattenden S, McKee M and Fletcher T (2001) ‘Cold comfort: The social and environmental determinants of excess winter deaths in England, 1986 to 1996’, Published for the Joseph Rowntree Foundation by The Policy Press, Bristol. Accessed on 15 October 2013.
Woodhouse PR, Khaw KT and Plummer M (1993) ‘Seasonal variation of blood pressure and its relationship to ambient temperature in an elderly population’. Journal of Hypertension 11(11), 1267 to 74.
15. Quality and methodology
The Excess Winter Mortality in England and Wales Quality and Methodology Information document contains important information on:
- the strengths and limitations of the data and how it compares with related data
- users and uses of the data
- how the output was created
- the quality of the output including the accuracy of the data