Table of contents
- Main points
- Definitions
- Excess winter mortality (EWM) trends in England and Wales
- Excess winter mortality (EWM) and temperature
- Excess winter mortality (EWM) and influenza rates
- Excess winter mortality (EWM) by sex and age
- Excess winter mortality (EWM) in 2014/15 by underlying cause of death
- Excess winter mortality (EWM) by geography
- Causes of excess winter mortality
- Methodological changes
- Policy context
- Uses of excess winter mortality (EWM) data
- Comparisons with the rest of the UK
- References
- Background notes
- Methodology
1. Main points
An estimated 43,900 excess winter deaths occurred in England and Wales in 2014/15; the highest number since 1999/00, with 27% more people dying in the winter months compared with the non-winter months
The majority of deaths occurred among people aged 75 and over; there were an estimated 36,300 excess winter deaths in this age group in 2014/15, compared with 7,700 in people aged under 75
There were more excess winter deaths in females than in males in 2014/15, as in previous years. Male excess winter deaths increased from 7,210 to 18,400, and female deaths from 10,250 to 25,500 between 2013/14 and 2014/15
Respiratory diseases were the underlying cause of death in more than a third of all excess winter deaths in 2014/15
The excess winter mortality index was highest in the South West in 2014/15 and joint lowest in Yorkshire and The Humber, and Wales
2. Definitions
In common with other countries, in England and Wales more people die in the winter than in the summer. This statistical bulletin presents provisional figures for excess winter deaths (EWD, also referred to as excess winter mortality – EWM) in England and Wales for the winter period 2014/15 and final figures for the winter period 2013/14. Historical trends from 1950/51 onwards are also provided for comparison. Figures are presented by sex, age, region and cause of death. Information on temperature and influenza incidence is also given to add context to the mortality figures.
Method for calculating excess winter mortality
Excess deaths
Johnson and Griffiths (2003) (97.4 Kb Pdf) investigated seasonal mortality and reported that historically, above average mortality is typically seen between December and March. Therefore, our standard method defines the winter period as December to March, and compares the number of deaths that occurred in this winter period with the average number of deaths occurring in the preceding August to November and the following April to July:
EWM = winter deaths - average non-winter deaths
This produces the number of excess winter deaths (EWDs), which is then rounded to the nearest 10 for final data and to the nearest 100 for provisional data.
Excess winter mortality (EWM) index
The EWM index is calculated so that comparisons can be made between sexes, age groups and regions, and is calculated as the number of excess winter deaths divided by the average non-winter deaths:
EWM Index = (EWM / average non-winter deaths) x 100
The EWM index is presented with 95% confidence intervals, which are calculated as:
EWM index ± 1.96 x (EWM Index / √ EWM)
The EWM index shows the percentage of extra deaths that occurred in the winter and is reported to 1 decimal place.
More details about how EWM is calculated and how to interpret and use confidence intervals are available in Background notes 2, 3 and 4.
Back to table of contents3. Excess winter mortality (EWM) trends in England and Wales
There were an estimated 43,900 excess winter deaths (EWDs) in England and Wales in 2014/15, representing 27% more deaths in the winter period, compared with the non-winter period. The number of EWDs was 2.5 times higher in 2014/15 than the record low of 17,460 EWDs in 2013/14, and was the highest since 1999/00.
The increase in EWM in 2014/15 appears more pronounced partly as a result of a lower than average number of EWDs in 2013/14 in comparison with a higher than average number of EWDs this year (2014/15). Large annual fluctuations in EWDs are not uncommon, for example recently EWDs increased by almost 50% between the winters of 2007/08 and 2008/09 and also in the late 1990s it more than doubled between 1997/98 and 1998/99. However, EWM in 2014/15 was still notably high.
Historical trends in EWDs in England and Wales occurring between 1950/51 and 2014/15 are presented in Figure 1. A five-year moving average is also presented to smooth out any short-term fluctuations. This shows that a sharp drop in EWDs occurred between 1960/61 and 1965/66, followed by a slight increase and another sharp drop between 1969/70 and 1972/73. The EWM then gradually decreased, albeit with some fluctuations from 1973/74 up until 1996/97. There were relatively high numbers of deaths in the winters of 1998/99 and 1999/2000, but deaths dropped sharply the following winter. This decreasing trend in EWM continued until 2005/06. In 2006/07, the smoothed trend line increased slightly and has remained relatively stable since. It is too soon to say if the sharp increase in EWM in 2014/15 is the beginning of an upward trend.
Figure 1: Number of excess winter deaths and five-year central moving average, England and Wales, 1950/51–2014/15
Source: Office for National Statistics
Notes:
- EWM figures are based on deaths occurring in each period (August through to the following July). Numbers of deaths from January to July 2015 are provisional, and have been adjusted to take account of late registrations (see background note 3 in the statistical bulletin).
- Figures for the latest winter are provisional and are rounded to the nearest 100, figures for all other winters are final and are rounded to the nearest 10.
- Central moving averages were calculated using the winter period of interest, along with the two winter periods before and two periods after.
- Data include non-residents who died in England or Wales.
Download this chart Figure 1: Number of excess winter deaths and five-year central moving average, England and Wales, 1950/51–2014/15
Image .csv .xls4. Excess winter mortality (EWM) and temperature
Number of daily deaths
As in previous winters, the peak in mortality in 2014/15 occurred at the beginning of January; however it was notably higher than in previous years.
The number of daily deaths in 2014/15 was above the five-year average throughout most of the year (on 304 out of 365 days). During the winter period, there were only 2 days where the number of daily deaths was below the five-year average: 2 December and 18 March. Through the non-winter months the number of daily deaths was generally similar to the five-year average, but during the winter daily deaths were far higher.
Around 5 December, the number of daily deaths began to climb noticeably higher than the five-year average. The number of daily deaths peaked on 1 January, and remained about 30% above average until 10 January, and around 10% above average until early March. From this peak on 1 January, the number of daily deaths gradually declined until the beginning of April at which point they reached levels similar to the five-year average. The number of daily deaths was highest above the five-year average on 10 January (38% higher).
Figure 2: Number of daily deaths, and five-year average daily deaths, England and Wales, August 2014 to July 2015
Source: Office for National Statistics
Notes:
- Figures are based on deaths occurring each day. Numbers of deaths from January to July 2015 are provisional, and have been adjusted to take account of late registrations (see Background note 3 in the statistical bulletin).
- Five year averages for each day are calculated using data from the previous five years, excluding the current year.
- Mortality data include non-residents who died in England or Wales.
Download this chart Figure 2: Number of daily deaths, and five-year average daily deaths, England and Wales, August 2014 to July 2015
Image .csv .xlsMean number of daily deaths each month and mean monthly temperatures
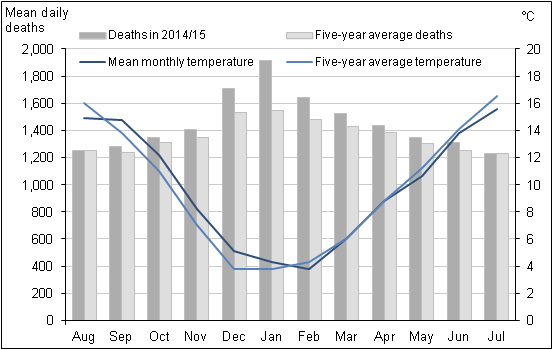
Figure 3 shows that the mean number of daily deaths each month was higher than the five-year average throughout 2014/15, but this difference was smaller in the non-winter months. The usual seasonal peak in mortality in December and January was very pronounced in 2014/15, with mortality levels 12% higher than average in December, 24% higher in January and 11% higher in February. Consistent with the five-year average, the peak in monthly mortality occurred in January in 2015 with an average daily number of deaths of 1,916. The month with the second highest mean number of daily deaths was December with 1,712 deaths. Mean daily deaths were lowest in August and September 2014 and July 2015 (1,248, 1,282 and 1,232 respectively).
Colder temperatures were not the main cause of the increase in winter deaths in 2014/15, as the mean monthly temperature was above average from September through to January and similar to, or slightly below, the average for all other months. Moreover, the average temperature between October and November 2014, dropped from 12.2°C to 8.2°C, but mortality remained similar across both months (1,350 deaths in October 2014 compared to 1,403 deaths in November 2014). Average monthly temperatures were lower in all winter months in 2012/13 than in 2014/15, and yet the mean number of daily deaths each month was higher in 2014/15 than in 2012/13.
Figure 3: Mean number of daily deaths each month and mean monthly temperatures, England and Wales, August 2014 to July 2015
Source: Office for National Statistics, Met Office
Notes:
- The mean number of daily deaths is based on deaths occurring in each month. Numbers of deaths from January to July 2015 are provisional, and have been adjusted to take account of late registrations (see background note 3 in the statistical bulletin).
- Five year averages for each month are calculated using data from the previous five years, excluding the current year.
- Data include non-residents who died in England or Wales.
Download this image Figure 3: Mean number of daily deaths each month and mean monthly temperatures, England and Wales, August 2014 to July 2015
.png (22.5 kB) .xls (37.9 kB)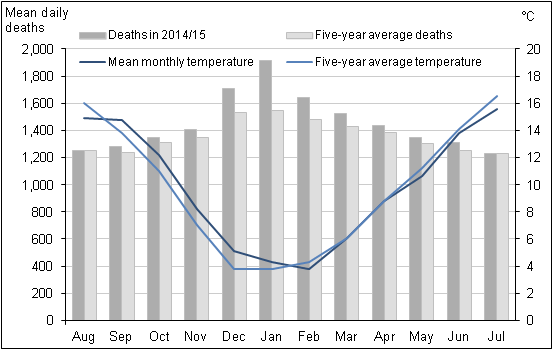
Excess winter mortality (EWM) and average winter temperature
Excess winter deaths (EWDs) in 2014/15 were the highest since 1999/2000, when flu consultation rates were very high. After a mild winter in 2013/14, the winter of 2014/15 was colder by comparison. However the average winter temperature of 4.8°C was not particularly cold compared with the previous 10 years; during this period half of the winters were colder and half were warmer than 2014/15. The average non-winter temperature was similar to previous years (12.4°C), as was the non-winter mortality.
Although it is often thought the main cause of excess winter deaths is temperature, it is not the only factor affecting levels of mortality. Though temperature clearly has a role, the link between average winter temperature and EWDs is very unclear in some years. For example, winter 2009/10 was exceptionally cold, but excess winter mortality (EWM) was similar to years with mild winters. In contrast, the higher number of EWDs in 2012/13 was likely to be due to cold weather, but it was the unusual pattern of a sustained cold from mid-January until early April, rather than just a cold January period, that influenced mortality.
Figure 4: Number of excess winter deaths and average winter temperature, England and Wales, 1999/2000 to 2014/15
Source: Met Office, Office for National Statistics
Notes:
- EWM figures are based on deaths occurring in each period (August through to the following July). Numbers of deaths from January to July 2015 are provisional, and have been adjusted to take account of late registrations (see background note 3 in the statistical bulletin).
- Figures for the latest winter are provisional and are rounded to the nearest 100, figures for all other winters are final and are rounded to the nearest 10.
- Mean winter temperature is calculated using average monthly temperatures from December to March.
- Data include non-residents who died in England or Wales.
Download this chart Figure 4: Number of excess winter deaths and average winter temperature, England and Wales, 1999/2000 to 2014/15
Image .csv .xlsA greater proportion of homes in England now have measures to improve energy efficiency, such as cavity wall insulation, modern central heating and double-glazing compared with 1996. In 2013, 80% of homes had full double glazing, up from 30% in 1996. More than a third (37%) of homes had 200mm or more of loft insulation in 2013, up from 3% in 1996. Approximately 9.6 million dwellings had cavity wall insulation in 2013, up from less than 3 million in 1996. This means homes are becoming more energy efficient (Department for Local Communities and Government, 2015). It may be that the outdoor temperature now has less of an effect on excess winter mortality, as better insulation and energy efficiency means that houses are easier to heat and keep warm, potentially resulting in more stable indoor temperatures. There have been a number of schemes aimed at reducing fuel poverty, which are summarised in the Policy Context section below.
Back to table of contents5. Excess winter mortality (EWM) and influenza rates
Influenza is a respiratory disease (World Health Organisation, 2008), caused by a viral infection affecting the lungs and airways. Influenza infection is associated with potentially life threatening complications, such as bacterial pneumonia. The elderly and those with underlying health conditions are particularly at risk of developing complications (Public Health England, 2014b), which can result in hospitalisation and death (Public Health England, 2014c). Respiratory disease is known to be one of the main causes of excess winter deaths (EWDs); for example in 2014/15, respiratory diseases was listed the underlying cause of death for 36% of all excess winter deaths, with the majority of these deaths occurring in the 75 and over age group. Pneumonia was the underlying cause in 19% of all excess winter deaths in 2014/15.
According to Public Health England, moderate levels of influenza activity occurred in the community in 2014/15, and they occurred earlier in the 2014/15 influenza season than the previous year, with the peak also occurring earlier. The influenza-like-illness (ILI) consultation rate peaked in week 1 at 29.8 consultations per 100,000 population. Deaths peaked a week later, in the week beginning 5 January, which is consistent with the lag effect discussed by the Eurowinter group (1997). The week beginning 29 December and the week beginning 5 January (weeks 1 and 2 of 2015) had 14,428 and 14,632 deaths respectively – 35% and 39% higher than the same weeks in 2013/14.
The predominant influenza virus in winter 2014/15 was influenza A(H3N2). This strain of flu had a particularly noticeable effect on the elderly, resulting in numerous care-home outbreaks and far higher levels of excess mortality than the last notable H3N2 season of 2008/09 (Public Health England, 2015). By comparison, in the previous winter of 2013/14 the predominant influenza virus was influenza A(H1N1), which was particularly virulent in younger people (Public Health England, 2014).
High levels of influenza occurred in 1999/2000 and were associated with a high level of mortality, as illustrated in Figure 5. In 2014/15 influenza-like-illness rates rose above the epidemic threshold in week 50 and remained above or at that threshold until week 14 (Public Health England, 2015). Changes in the way the threshold is calculated mean it is not unusual for the ILI rate to move above the threshold, and ILI-levels in 2014/15 were nowhere near the levels seen in 1999/2000.
Levels of influenza in 2014/15 were higher than recent years, as were peak intensive care numbers, but were lower than 2010/11 which saw very high levels of influenza (Public Health England, 2015). Despite this, EWM was higher in 2014/15 than in 2010/11. In 2010/11 the predominant influenza virus was A(H1N1), as in 2013/14. One reason for the reduced EWM in 2010/11 when compared with 2014/15, is because the predominant strain of influenza in 2014/15 was particularly virulent in older people, an already at-risk group, whilst in 2010/11 the predominant strain of influenza was a particular problem in younger people and had less impact on the elderly (Public Health England, 2014). In addition to this, the influenza vaccine in 2010/11 was around 50% effective (Public Health England, 2011), compared with the 34% effectiveness in 2014/15. Vaccine uptakes were similar in 2014/15 to previous years, though uptake was slightly lower than in previous years in those under 65 in a clinical risk group (Public Health England, 2015).
Figure 5: Weekly deaths from all causes and Royal College of General Practitioners (RCGP) and Public Health Wales (PHW) influenza-like illness (ILI) consultation rates per 100,000 population, England and Wales, 1999 to 2015
Source: Office for National Statistics
Notes:
- Figures are based on deaths occurring each week. Numbers of deaths from January to July 2015 are provisional, and have been adjusted to take account of late registrations (see Background note 3 in the statistical bulletin).
- The method for calculating ILI rates changed for data from week number 201431, so rates from this week onwards are not directly comparable to previous weeks. For more information, see the 'Changes to this bulletin' section of the statistical bulletin.
- Mortality data include non-residents who died in England or Wales.
Download this chart Figure 5: Weekly deaths from all causes and Royal College of General Practitioners (RCGP) and Public Health Wales (PHW) influenza-like illness (ILI) consultation rates per 100,000 population, England and Wales, 1999 to 2015
Image .csv .xls6. Excess winter mortality (EWM) by sex and age
In 2014/15 there were 43,900 excess winter deaths (EWDs). Of this total, 42% were males of the total (18,400 EWDs) and 58% female (25,500 EWDs).
Figure 6 compares the excess winter mortality (EWM) index for males and females grouped by age for the last 3 winters. The EWM index is used to show how many more people died in winter than in the non-winter months, expressed as a percentage. The majority of these deaths for both sexes occurred amongst those aged 75 and over, with females aged 85 and over having the greatest number of EWDs. Female EWDs are generally higher than males, especially in older age groups. A higher proportion of the female population are aged 75 and over (9%, compared with 7% of males in 2014), and women outnumber men 2 to 1 for people aged over 85 (ONS, 2015a). This may wholly, or partially, explain the higher number of EWDs in women.
In 2014/15 EWM increased significantly in all age groups compared with 2013/14. EWM was about 2.5 times higher in both males and females in 2014/15. The EWM index for females increased to 31% compared with 24% for males.
Although overall a similar increase in EWM was seen in males and females in 2014/15, a different pattern emerges when we examine the trends by age. In 2014/15 bigger increases were seen in males aged under 85, compared with females in this age group. In fact, the greatest percentage increase in EWM between 2013/14 and 2014/15 was seen in males aged under 65: the EWM index more than tripled from 4% to 14%, with excess winter deaths increasing from 660 in 2013/14 to 1,900 in 2014/15. In contrast, females in the same age group saw the smallest percentage increase in EWM increasing from 770 to 1,200. Women aged 85 and over had a bigger increase in EWM in 2014/15 than men in this age group. EWM in women aged 85 was 2.8 times higher in 2014/15 with the EWM index increasing to 41%; whereas the equivalent male EWM was 2.3 times higher in 2014/15 (EWM index of 35%).
Figure 6a: Excess winter deaths by sex and age group, England and Wales, 2012/13 to 2014/15
Males
Source: Office for National Statistics
Notes:
- EWM figures are based on deaths occurring in each period (August through to the following July). Numbers of deaths from January to July 2015 are provisional, and have been adjusted to take account of late registrations (see Background notes 2 and 3 in the statistical bulletin).
- Figures for the latest winter are provisional and are rounded to the nearest 100, figures for all other winters are final and are rounded to the nearest 10.
- The lower and upper confidence limits (LCL and UCL) form a confidence interval, which is a measure of the statistical precision of an estimate. More information on the calculation and interpretation of excess winter deaths, the excess winter mortality index and confidence intervals can be found in the Definitions sheet.
- Totals for all ages will not be equal to the sum of the individual age groups due to rounding.
- The excess winter mortality (EWM) index is calculated as excess winter deaths divided by the average non-winter deaths, expressed as a percentage.
- Data include non-residents who died in England or Wales.
Download this chart Figure 6a: Excess winter deaths by sex and age group, England and Wales, 2012/13 to 2014/15
Image .csv .xls
Figure 6b: Excess winter deaths by sex and age group, England and Wales, 2012/13 to 2014/15
Females
Source: Office for National Statistics
Notes:
- EWM figures are based on deaths occurring in each period (August through to the following July). Numbers of deaths from January to July 2015 are provisional, and have been adjusted to take account of late registrations (see Background notes 2 and 3 in the statistical bulletin).
- Figures for the latest winter are provisional and are rounded to the nearest 100, figures for all other winters are final and are rounded to the nearest 10.
- The lower and upper confidence limits (LCL and UCL) form a confidence interval, which is a measure of the statistical precision of an estimate. More information on the calculation and interpretation of excess winter deaths, the excess winter mortality index and confidence intervals can be found in the Definitions sheet.
- Totals for all ages will not be equal to the sum of the individual age groups due to rounding.
- The excess winter mortality (EWM) index is calculated as excess winter deaths divided by the average non-winter deaths, expressed as a percentage.
- Data include non-residents who died in England or Wales.
Download this chart Figure 6b: Excess winter deaths by sex and age group, England and Wales, 2012/13 to 2014/15
Image .csv .xls7. Excess winter mortality (EWM) in 2014/15 by underlying cause of death
In previous bulletins EWM has only been presented by underlying cause death for the previous winter, as the provisional data for the most recent winter is not fully quality assured. However, we investigated this further and decided the data is of sufficient quality to produce reliable estimates of EWM for 3 broad causes (circulatory diseases, respiratory disease and Alzheimer’s disease and dementia) for the most recent winter. These provisional estimates will be revised in next year’s bulletin. EWM for injury and poisoning can still only be produced for the previous winter, due to the long registration delays experienced for these causes, which makes the estimation method unreliable. More information is available in the Quality and Methodology paper (437.8 Kb Pdf).
Respiratory disease is a leading cause of death in England and Wales, (ONS, 2015a), and it also has the largest seasonal effect of all of the causes included in Table 1. In 2014/15, 78% more people died from respiratory diseases in the winter, compared with the non-winter period. Pneumonia accounted for the largest proportion of these deaths. This is significantly higher than in 2013/14, when there were 30% more respiratory disease deaths in the winter compared with the non-winter period. Respiratory diseases also caused the largest number of excess winter deaths in 2014/15 (15,800), accounting for over a third of all EWDs.
Circulatory diseases were also one of the main causes of mortality in 2014 (ONS, 2015a), and they caused almost a quarter of all excess winter deaths in 2014/15 (9,900). There was a moderate seasonal effect – 23% more people died from circulatory diseases in the winter than in the non-winter months, up from 11% in 2013/14. However, the number of circulatory disease deaths remains high throughout the year, so the seasonal effect is not as large as we see with either respiratory diseases or dementia and Alzheimer’s disease.
Dementia and Alzheimer’s disease was one of the leading causes of death in 2014 (ONS, 2015a), and also displays marked seasonal effects. EWM from these causes reached a record high in 2014/15, with 9,100 excess winter deaths. The seasonal effect was more than double that seen for circulatory diseases, with 52% more people dying from dementia or Alzheimer’s disease in the winter than in the non-winter months, up from 22% in 2013/14. An ICD-10 coding change introduced in January 2014 may account for some of this increase, but not all. For more information, see the “Methodological Changes” section. The reasons for the seasonal pattern in deaths from dementia and Alzheimer's disease are not clear. However, it may be related to the greater vulnerability of people with these conditions to respiratory diseases, difficulties with self-care, and falls, all of which may be more important in winter months.
Similar relationships between underlying cause and age can be seen for both males and females. Reference table 1 is a more detailed version of Figure 7 and shows the number of excess winter deaths (EWDs) and the excess winter mortality (EWM) index in England and Wales for the winters of 1991/92 to 2014/15, by sex and age group for circulatory diseases, respiratory diseases, dementia and Alzheimer’s disease and injury and poisoning (up to 2013/14).
Figure 7: Excess winter mortality index by underlying cause of death, England and Wales, 2012/13 to 2014/15
Source: Office for National Statistics
Notes:
- Underlying cause of death is defined using the International Classification of Diseases, Tenth Revision (ICD-10).
- Figures are based on deaths occurring in each period (August through to the following July). Numbers of deaths from January to July 2015 are provisional, and have been adjusted to take account of late registrations (see Background note 3 in the statistical bulletin).
- The excess winter mortality (EWM) index is calculated as excess winter deaths divided by the average non-winter deaths, expressed as a percentage.
- A more detailed version of Figure 7 showing excess winter mortality, broken down by sex and age group can be found in table 1 in this Excel document.
- Figures for England and Wales include deaths of non-residents.
Download this chart Figure 7: Excess winter mortality index by underlying cause of death, England and Wales, 2012/13 to 2014/15
Image .csv .xls8. Excess winter mortality (EWM) by geography
Excess winter mortality (EWM), 2012/13 to 2014/15 by region
Figures 8a and 8b presents the excess winter mortality (EWM) index for English regions and Wales, for winter 2012/13 to 2014/15. More detailed data showing the number of excess winter deaths (EWDs) and the EWM index, broken down by age for regions of England and Wales, from 1991/92 to 2014/15, are available in Reference Table 2.
EWM increased significantly in every English region and Wales in 2014/15, although the size of this increase varied. Unlike with other mortality-related datasets, such as sub-national life expectancy, EWM does not show a clear ‘north/south divide’.
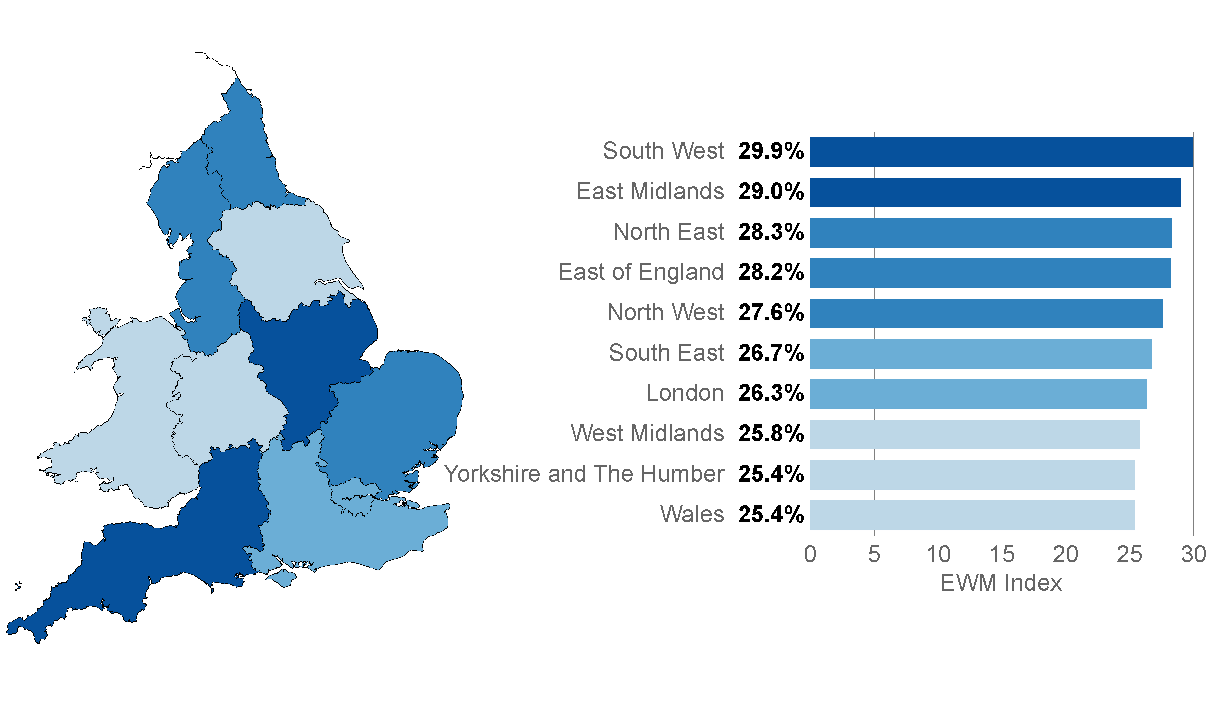
Figure 8a: Excess winter mortality for regions of England and Wales, 2014/15
Source: Office for National Statistics
Notes:
- EWM figures are based on deaths occurring in each period. Numbers of deaths from January to July 2015 are provisional, and have been adjusted to take account of late registrations (see Background notes 2 and 3 in the statistical bulletin).
- Figures for the latest winter are provisional and are rounded to the nearest 100, figures for all other winters are final and are rounded to the nearest 10.
- The lower and upper confidence limits (LCL and UCL) form a confidence interval, which is a measure of the statistical precision of an estimate. More information on the calculation and interpretation of excess winter deaths, the excess winter mortality index and confidence intervals can be found in the Definitions sheet.
- The excess winter mortality (EWM) index is calculated as excess winter deaths divided by the average non-winter deaths, expressed as a percentage.
- Figures for England, English regions and Wales exclude deaths of persons usually resident in each area. Figures for England and Wales combined also include deaths of non-residents.
- Based on boundaries as of August 2015.
Download this image Figure 8a: Excess winter mortality for regions of England and Wales, 2014/15
.png (58.8 kB) .xls (48.1 kB)
Typically, regional EWM is variable with no consistent trends across time. For example, the North East had the lowest level of EWM compared with other regions in 2013/14, but had relatively high EWM in 2014/15.
The regions with highest EWM index in 2014/15 were the South West and the East Midlands, which had 29.9% and 29.0% more deaths in winter compared with the non-winter period. These were both significantly higher than the England and Wales average of 27.2%. This is the third year running that the East Midlands has had one of the highest EWM indices, however, the South West often ranks much lower.
The largest increase in the EWM index between 2013/14 and 2014/15 was seen in the North East, where the EWM index nearly tripled from 9.5% to 28.3%, making it the third highest in England and Wales in 2014/15.
In common with the increasing trends seen across the English regions, the EWM index in Wales increased from 10.3% in 2013/14 to 25.4% in 2014/15, with EWM levels similar to those seen in Yorkshire and the Humber (also 25.4%) and the West Midlands (25.8%).
Figure 8b: Excess winter mortality for regions of England and Wales, 2012/13 to 2014/15
Source: Office for National Statistics
Notes:
- EWM figures are based on deaths occurring in each period. Numbers of deaths from January to July 2015 are provisional, and have been adjusted to take account of late registrations (see Background notes 2 and 3 in the statistical bulletin).
- Figures for the latest winter are provisional and are rounded to the nearest 100, figures for all other winters are final and are rounded to the nearest 10.
- The lower and upper confidence limits (LCL and UCL) form a confidence interval, which is a measure of the statistical precision of an estimate. More information on the calculation and interpretation of excess winter deaths, the excess winter mortality index and confidence intervals can be found in the Definitions sheet.
- The excess winter mortality (EWM) index is calculated as excess winter deaths divided by the average non-winter deaths, expressed as a percentage.
- Figures for England, English regions and Wales exclude deaths of persons usually resident in each area. Figures for England and Wales combined also include deaths of non-residents.
- Based on boundaries as of August 2015.
Download this chart Figure 8b: Excess winter mortality for regions of England and Wales, 2012/13 to 2014/15
Image .csv .xlsExcess winter mortality (EWM) in 2013/14 by local authority
Information presented earlier in this bulletin refers to provisional excess winter mortality (EWM) figures for 2014/15; this section refers to final 2013/14 EWM figures for local authorities. Local area EWM data are not available for the most recent winter (2014/15), as these data are provisional, and the estimation method used to produce national and regional figures is not reliable for small geographic areas.
As with regional EWM figures, there is no consistent pattern in EWM across local authorities in England and Wales over time.
The local authorities with the lowest EWM index in 2013/14 were Fareham in England and Torfaen in Wales. In fact, no EWM occurred in either local authority; in Fareham, there were more deaths in the non-winter months than there were in the winter. This provides a good example of how much individual local authorities vary over time, as in 2012/13, there were 24% more deaths in winter months compared with non-winter months in Fareham.
The local authority with the highest EWM index in England in 2013/14 was City of London, where 65% more deaths occurred in the winter, than in the non-winter period, however the confidence interval is very wide and ranges from 11% to 119%, so should be treated with caution. The second highest EWM index in England in 2013/14 was Chorley with 37% more deaths in the winter than the non-winter. In Wales, Blaenau Gwent had the highest level of EWM, with 26% more deaths in winter compared with the non-winter period.
Back to table of contents9. Causes of excess winter mortality
A study by Healy (2003) showed that excess winter mortality (EWM) varied widely within Europe. The results show that countries with low winter temperatures in Scandinavia and Northern Europe, such as Finland and Germany, had very low rates of EWM. Conversely, countries with very mild winter temperatures in Southern Europe such as Portugal and Spain had very high rates of EWM. England and Wales both have higher than average EWM and exhibit high variation in seasonal mortality. These results were echoed in a more recent study by Fowler et al (2014).
There are many reasons why countries with milder winter climates have such a high level of winter mortality. For example, people who live in countries with warmer winters tend to take fewer precautions against the cold. The Eurowinter group (1997) reported that compared with people living in countries with cold winters, those from warmer countries were less likely to wear warm protective clothing in cold weather.
Countries with milder winters also tend to have homes with poorer thermal efficiency (for example, fewer homes have cavity wall insulation and double glazing), which makes it harder to keep homes warm during the winter (Healy, 2003). It has been shown that low indoor temperature is associated with higher EWM from cardiovascular disease in England (Wilkinson et al., 2001).
Although EWM is associated with low temperatures, conditions directly relating to cold, such as hypothermia, are not the main cause of EWM. The majority of additional winter deaths are caused by cerebrovascular diseases, ischaemic heart disease and respiratory diseases. Although cancer causes more than a quarter of all deaths annually, previous research by Johnson and Griffiths (2003) (97.4 Kb Pdf) found that there was no clear seasonal pattern for these deaths.
The cold can have various physiological effects, which may lead to death in vulnerable people. Woodhouse et al (1993) reported that colder home temperature was associated with increased blood pressure in older people. The Eurowinter group (1997) noted that cold causes haemoconcentration, which leads to thrombosis, and that cold can also lower the immune system’s resistance to respiratory infections. Additionally, the level of influenza circulating in the population increases in winter. In vulnerable groups, for example in the elderly or those with pre-existing health problems, influenza can lead to life-threatening complications, such as bronchitis or secondary bacterial pneumonia (Public Health England, 2014b).
Previous research has shown that although mortality does increase as it gets colder, temperature only explains a small amount of the variance in winter mortality, and high levels of EWM can occur during relatively mild winters Brown et al, 2010 (293 Kb Pdf) . Curwen and Devis (1988) showed that both temperature and levels of influenza were important predictors of excess winter mortality. The relationship between temperature, influenza and winter mortality is complex.
Back to table of contents10. Methodological changes
Changes to this bulletin
A number of small changes have been made to the bulletin since the last publication in November 2014. These include the production of a back series of excess winter mortality figures broken down by underlying cause.
In this year’s bulletin we have calculated the England and Wales influenza-like-illness (ILI) rates from week 31 of 2014 by combining data provided by the Royal College of General Practitioners (RCGP - England ILI incidence and population data) and Public Health Wales (PHW - Wales ILI incidence and population data). In previous bulletins the combined England and Wales ILI rates were provided by the RCGP. We have used the same methods as the RCGP, so this change has had minimal impact on the figures.
Changes to the coding of underlying cause of death
We code cause of death using the World Health Organization's (WHO) International Classification of Diseases, Tenth Revision (ICD-10). Where possible, deaths are automatically coded using specialist software, with the remaining deaths being manually coded. ICD-10 was introduced in England and Wales in January 2001. Since then various amendments to the ICD-10 have been authorised by WHO and we have updated cause coding software to incorporate these changes. Between 2001 and 2010, we used software version 2001.2; between 2011 and 2013, version 2010 was used and on 1 January 2014, we changed the software to a package called IRIS (version 2013). IRIS software version 2013 incorporates all official updates to ICD-10 approved by WHO, which were timetabled for implementation before 2014.
To understand the impact of these changes on mortality statistics, we carried out bridge coding studies in which samples of deaths that had previously been coded using the old software were then independently recoded using the new version of ICD-10 (ONS, 2011 and 2014a).
The move to v2010 in 2011 had a big impact on the assignment of deaths to an underlying cause of “Mental and Behavioural Disorders”. The majority of the change was the result of deaths previously coded as “Diseases of the Circulatory System” (I00–I99) in ICD–10 v2001.2 now being coded as deaths from dementia (F01 and F03) under v2010. The increase in the dementia and alzheimers category was 44%. Deaths with an underlying cause of death coded to “Diseases of the Circulatory System” decreased by 5%, while those coded to “Diseases of the Respiratory System” showed an increase of 2%.
The move to IRIS (version 2013) software in 2014 caused the number of deaths allocated to “Dementia and Alzheimer’s disease” to increase by 6.2%. The main reason for this increase is the change to the coding of chest infections, so deaths which mention both a chest infection and dementia or Alzheimer’s disease are now allocated an underlying cause of dementia or Alzheimer’s disease, whereas in ICD-10 v2010 (NCHS), the chest infection would have been assigned as the underlying cause. Since this coding change involves chest infections, its impact is likely to be slightly more pronounced in the winter months. Deaths coded with an underlying cause of death of circulatory diseases decreased by 0.7% between v2010 and IRIS, and deaths coded with respiratory diseases as an underlying cause of death decreased by 2.5%.
These coding changes will not have affected the overall number of excess winter deaths from all causes; nor will it have had a significant impact on the excess winter mortality index as any impact will be spread fairly evenly throughout the year. However, the coding changes will have affected the number of excess winter deaths for specific causes, with the biggest impact being for dementia and Alzheimer’s disease. This means that figures for 2011 onwards by underlying cause of death will not be directly comparable with figures for 2001 to 2010.
Back to table of contents11. Policy context
In the 2009 annual report from the Chief Medical Officer (CMO) for England, it was noted that, although excess winter deaths (EWDs) have declined over the last 50 years, the number was still too high (Donaldson, 2010). The CMO argued that many of these deaths were preventable and that more needed to be done to protect vulnerable people during cold winter months.
This prompted the government to develop an annual Cold Weather Plan for England, which has been published yearly since November 2011. Public Health England (PHE) published the 2015 edition in October 2015 in partnership with NHS England, the Local Government Association and the Met Office. The Cold Weather Plan aims to prevent avoidable harm to health by alerting people to the negative health effects of cold weather. This should enable them to prepare and respond appropriately, and help to reduce the number of excess winter deaths. The plan sets out a series of actions to be taken by the NHS, social care and other agencies throughout the year, and in response to forecast or actual severe winter weather. It also encourages local communities to support the most vulnerable in their area, such as checking on them during severe weather and offering other support. The Met Office issues cold weather alerts from November to March to support the Cold Weather Plan (Public Health England, 2015). The ‘Keep Warm Keep Well’ booklet provides advice on staying well during cold weather, for example healthy lifestyle, heating, flu vaccinations, and making sure that people know about all the benefits and services to which they are entitled (Public Health England, 2015).
The UK government introduced the “green deal” project, whereby householders can have improvement work carried out on heating and home insulation, paid back through savings in energy bills. This aims to benefit around 230,000 low income families per year (Department of Energy and Climate Change, 2014a). In January 2013 The Energy Companies Obligation was introduced to reduce the UK’s energy consumption and support people living in fuel poverty. It will fund energy efficiency improvements worth around £1.3 billion every year for low-income households and areas, and in properties that are harder to treat (Department of Energy and Climate Change, 2014b).
Another policy aimed at helping the most vulnerable heat their homes is the Warm Home Discount scheme (Department of Energy and Climate Change, 2015). This is a one-off electricity bill discount for people on a low income who meet the eligibility requirements.
In addition, there are a number of other policies aimed at tackling excess winter mortality. These include winter fuel payments (Directgov, 2015), cold weather fuel payments (Directgov, 2015), and the seasonal flu vaccination programme: nasal spray flu vaccines are now available for all children aged 2, 3 and 4 (NHS Choices, 2015).
The Welsh Government also runs schemes to reduce fuel poverty, such as the Welsh Government Warm Homes Nest, which is an all-Wales scheme that offers an advisory service, as well as home energy efficiency improvements for eligible householders. Eligible householders are those on the lowest incomes, living in the most energy inefficient homes (Welsh government, 2014a). This scheme is complemented by the area based “Welsh Government Warm Homes Arbed” scheme which seeks to make energy efficiency improvements to Welsh homes in the most deprived areas (Welsh government, 2014b).
Back to table of contents12. Uses of excess winter mortality (EWM) data
Excess winter mortality (EWM) figures are widely used to inform policy, planning and research in the public sector, in particular to measure the effectiveness of cold weather planning. Local authorities and public health organisations across England and Wales use our data to assess levels of excess winter mortality in their area. In addition, charities use excess winter mortality statistics to support a variety of campaigns.
Back to table of contents13. Comparisons with the rest of the UK
UK figures are not available as we only hold mortality data for England and Wales. National Records of Scotland (NRS) produce an annual winter mortality report. Scotland saw similar trends to those in England and Wales in 2014/15, with winter 2014/15 in Scotland, like England and Wales, having the highest number of excess winter deaths since 1999/2000.
Northern Ireland Statistics and Research Agency (NISRA) produced a report on excess winter mortality (EWM) for 2013/14. The 2014/15 report will be published on 3 December 2015.
Winter mortality figures for Scotland and Northern Ireland are both based on death registrations, whereas England and Wales figures are based on occurrences. In Scotland a death must be registered within 8 days, and fact of death can be registered (with a cause given as unascertained, pending investigations) before the Procurator Fiscal has completed their investigations. Therefore, Scottish mortality data are not subject to the same registration delays as mortality data for England and Wales. Almost all deaths that occurred in the relevant period will be included in the Scottish figures, meaning winter mortality figures from Scotland are comparable with our figures for England and Wales.
For Northern Ireland mortality data, there can be a significant delay between when the death occurred and when it was registered for some causes of death. NISRA have compared EWM figures based on occurrences, and registrations and the difference is quite large in some years. Therefore, EWM figures from Northern Ireland and England and Wales are not directly comparable.
Back to table of contents