Table of contents
- Main points
- Things you need to know about this release
- Drug misuse deaths increase in both males and females
- The majority of drug misuse deaths are accidental poisonings
- People aged 40 to 49 years have the highest rate of drug misuse deaths
- Deaths involving selected substances
- Deaths involving new psychoactive substances continue to increase
- North East had the highest drug misuse mortality rate in England in 2016
- Effect of registration delays on drug misuse deaths
- Drug-related deaths in other countries
- Links to related ONS information
- Quality and methodology
1. Main points
There were 3,744 drug poisoning deaths involving both legal and illegal drugs in England and Wales registered in 2016; this is 70 higher than 2015 (an increase of 2%) and the highest number since comparable statistics began in 1993.
Of these 3,744 deaths, 69% (2,593) were drug misuse deaths.
There has been an increase in the rate of deaths related to drug misuse in Wales from 58.3 deaths per 1 million population in 2015 to 66.9 per 1 million in 2016; deaths in England have remained comparable between 2015 and 2016.
People aged 40 to 49 years had the highest rate of drug misuse deaths in 2016, overtaking those aged 30 to 39 years.
Over half (54%) of all deaths related to drug poisoning in 2016 involved an opiate (mainly heroin and/or morphine).
The highest mortality rate from drug misuse was in the North East with 77.4 deaths per 1 million population, a 13% increase from 2015; the lowest rate (29.1 deaths per 1 million population) was in the East Midlands, which remained stable.
2. Things you need to know about this release
Drug use and drug dependence are known causes of premature mortality, with drug poisoning accounting for 16% of deaths among people in their 20s and 30s in 2016. Drug-related deaths occur in a variety of circumstances, each with different social and policy implications. Consequently, there is considerable political, media and public interest in these figures.
Figures are presented for deaths related to drug poisoning (involving both legal and illegal drugs) and drug misuse (involving controlled drugs) in England and Wales from 1993 onwards. The definition of a drug poisoning death is based on the International Classification of Diseases (ICD) code assigned as the underlying cause of death. A list of the ICD codes included in the definition can be found in the Quality and Methodology Information (QMI) report.
The majority of this release focuses on drug misuse deaths. The definition of a drug misuse death is either: a death where the underlying cause is drug abuse or drug dependence, or a death where the underlying cause is drug poisoning and where any of the substances controlled under the Misuse of Drugs Act 1971 are involved. This definition is used across the UK and more details can be found in the Quality and Methodology Information report.
The figures include accidents and suicides involving drug poisonings, as well as deaths from drug abuse and drug dependence. They do not include other adverse effects of drugs (for example, anaphylactic shock), or other types of accidents (for example, a car crash) where the driver was under the influence of drugs.
Drug poisoning deaths involve a broad spectrum of substances, including legal and illegal drugs, prescription type drugs (either prescribed to the individual or obtained by other means) and over-the-counter medications. Some of these deaths may also be from complications of drug abuse, such as deep vein thrombosis or septicemia from intravenous drug use, rather than an acute drug overdose.
It is important to be aware that over half of all drug poisoning deaths involve more than one drug and/or alcohol, and it is not possible to tell which substance was primarily responsible for the death.
The figures presented show deaths registered each year, rather than deaths occurring each year. Almost all drug-related deaths are certified by a coroner. Due to the length of time it takes a coroner to complete an inquest, around half of drug-related deaths registered in 2016 will have actually occurred prior to 2016. See the “Impact of registration delays on drug-related deaths” section for more information.
Nevertheless, at an England and Wales level, general trends in drug-related deaths are broadly equivalent, regardless of whether the data are analysed by year of occurrence or year of registration. Figures based on registration year for smaller geographical areas (for example, Wales, English regions and local authorities) can be influenced by variations in registration delays and should be treated with caution. Extra information is provided in the commentary where differences in the trends do exist.
Back to table of contents3. Drug misuse deaths increase in both males and females
There were 3,744 drug poisoning deaths (involving both legal and illegal drugs) registered in 2016 in England and Wales.
In line with previous years, most of the drug-related deaths registered in 2016 in England and Wales were males (2,572 male deaths and 1,172 female deaths). As shown in Figure 1, the mortality rate for all drug poisoning deaths for males has increased from 51.5 deaths per 1 million population in 1993 to 91.4 deaths per 1 million population in 2016 (a 78% increase). For females, the mortality rate for all drug poisonings has increased from 34.2 deaths per 1 million population in 1993 to 40.6 deaths per 1 million in 2016 (a 19% increase).
For all persons, the mortality rate for all drug-poisoning deaths did not increase significantly between 2015 and 2016 and remained stable, with 65.8 deaths per 1 million population in 2016 compared with 65.1 deaths per 1 million population in 2015.
Figure 1 shows that the male mortality rate for drug misuse deaths increased sharply from 2012 to 2015. The rate for 2016 was 67.1 deaths per 1 million population compared with a rate of 65.5 per 1 million in 2015; however, despite being the highest rate since records began, this is not a significant increase. The female mortality rate also remained stable with no significant increase between 2015 and 2016, though the rate of 24.2 deaths per 1 million population in 2016 was the highest since records began in 1993.
Figure 1: Age-standardised mortality rates for deaths related to drug misuse, by sex, deaths registered in 1993 to 2016
England and Wales
Source: Office for National Statistics
Notes:
- Age-standardised mortality rates per 1 million population, standardised to the 2013 European Standard Population.
- Cause of death was defined using the International Classification of Diseases, Ninth Revision (ICD-9) for the years 1993 to 2000 and Tenth Revision (ICD-10) from 2001 onwards. More details can be found in the Quality and Methodology Information report.
- Figures are for deaths registered, rather than deaths occurring in each calendar year.
- Figures for England and Wales include deaths of non-residents.
Download this chart Figure 1: Age-standardised mortality rates for deaths related to drug misuse, by sex, deaths registered in 1993 to 2016
Image .csv .xlsOf the total number of drug-related deaths registered in 2016 in England and Wales, 2,593 (69%) were from drug misuse. Deaths from drug misuse account for 74% of all male drug-related deaths and 59% of all female drug-related deaths registered in 2016.
Figure 2: Number of deaths from drug poisoning and drug misuse, by sex, deaths registered in 2016
England and Wales
Source: Office for National Statistics
Notes:
- Cause of death was defined using the International Classification of Diseases, Tenth Revision (ICD-10). More details can be found in the Quality and Methodology Information report.
- Figures are for deaths registered, rather than deaths occurring in 2016.
- Figures for England and Wales include deaths of non-residents.
Download this chart Figure 2: Number of deaths from drug poisoning and drug misuse, by sex, deaths registered in 2016
Image .csv .xlsThe difference in trends between males and females suggests that different factors are involved in deaths related to drug misuse between the sexes. The Crime Survey for England and Wales 2015 to 2016 showed that men are more likely to take drugs than women. Almost 12% of men aged 16 to 59 years had taken an illegal drug in the last year, compared with 5% of women. This partly explains the higher mortality rate for drug misuse in males. However, this cannot be the only explanation, as more than 30% of drug poisoning deaths are not related to drug misuse. There are also differences in the types of controlled substances used by males and females, which may also influence the trends in drug misuse deaths.
Back to table of contents4. The majority of drug misuse deaths are accidental poisonings
For both males and females, the greatest proportion of drug misuse deaths registered in 2016 were from accidental poisonings, with 1,561 male deaths and 501 female deaths (82% and 72% of all drug misuse deaths respectively). In females, accidental poisonings due to drug misuse increased between 2015 and 2016 from 428 deaths to 501 deaths, whereas in males accidental poisoning deaths remained stable in 2016.
Deaths from mental and behavioural disorders due to drug use only account for about 5% to 6% of drug misuse deaths and this has remained stable since 2012. These deaths are essentially deaths from drug dependence or abuse, but they may involve an acute overdose of drugs similar to an accidental poisoning (see the Quality and Methodology Information report for further information on the coding of drug misuse deaths).
The proportion of drug misuse deaths with an underlying cause of suicide (defined as intentional self-poisoning or poisoning of undetermined intent) is higher in females than males; 23% for females compared with 11% for males in 2016. The number of female drug misuse suicides decreased from 175 deaths in 2015 to 161 deaths in 2016, the lowest recorded since 2013. See the Suicides in the UK: 2015 registrations bulletin for more information on how methods of suicide vary between men and women, with women more often opting for poisoning as a less violent mode of dying.
Figure 3: Percentage of drug misuse deaths, by underlying cause and sex, deaths registered in 2016
England and Wales
Source: Office for National Statistics
Notes:
- Cause of death was defined using the International Classification of Diseases, Tenth Revision (ICD-10). More details can be found in the Quality and Methodology Information report.
- There are very few deaths from assault by drugs, so for presentation purposes, these have been combined with mental and behavioural disorders due to drug use.
- Figures are for deaths registered, rather than deaths occurring in each calendar year.
- Figures for England and Wales include deaths of non-residents.
Download this chart Figure 3: Percentage of drug misuse deaths, by underlying cause and sex, deaths registered in 2016
Image .csv .xls5. People aged 40 to 49 years have the highest rate of drug misuse deaths
In 2016, as in previous years, people aged 30 to 49 years had the highest rate of drug misuse deaths – significantly higher than any other age group. This follows a trend of sharp increases in this age group since 2012, with mortality rates of 97.5 and 108.0 in 2016 for those aged 30 to 39 years and 40 to 49 years respectively. The sharp increase in deaths registered in 2016 in people aged 40 to 49 years means that this age group has now overtaken people aged 30 to 39 years and is now the age group with the highest rate of drug misuse deaths.
Figure 4: Age-specific mortality rates for deaths relating to drug misuse, deaths registered 1993 to 2016
England and Wales
Source: Office for National Statistics
Notes:
- Age-standardised mortality rates per 1 million population, standardised to the 2013 European Standard Population.
- Cause of death was defined using the International Classification of Diseases, Ninth Revision (ICD-9) for the years 1993 to 2000 and Tenth Revision (ICD-10) from 2001 onwards. More details can be found in the Quality and Methodology Information report. Deaths were included where the underlying cause was drug related and the specified substance was mentioned on the death certificate.
- Figures are for deaths registered, rather than deaths occurring in each calendar year.
- Figures for England and Wales include deaths of non-residents.
Download this chart Figure 4: Age-specific mortality rates for deaths relating to drug misuse, deaths registered 1993 to 2016
Image .csv .xlsThe mortality rate from drug misuse has also increased in people aged 50 to 69 years since 2012 but remained stable in 2016, whereas the rate in people aged 20 to 29 years has not changed significantly since 2013.
Figure 4 shows that the mortality rate for deaths relating to the youngest and oldest age groups (those aged under 20 years and aged 70 and over) has remained relatively stable in 2016, with 2.2 deaths per 1 million population for those aged under 20 years and 10.7 deaths per 1 million for people aged 70 and over.
Back to table of contents6. Deaths involving selected substances
Table 1 shows a list of selected substances that were mentioned on the death certificate. A list of all substances can be found in the reference table 6a.
Table 1: Number of drug-related deaths where selected substances were mentioned on the death certificate, deaths registered in England and Wales, 2012 to 2016
| Number of deaths | |||||
| 2012 | 2013 | 2014 | 2015 | 2016 | |
|---|---|---|---|---|---|
| All drug poisoning deaths | 2,597 | 2,955 | 3,346 | 3,674 | 3,744 |
| Any opiate4 | 1,290 | 1,592 | 1,786 | 1,989 | 2,038 |
| - Heroin and/or morphine | 579 | 765 | 952 | 1,201 | 1,209 |
| - Methadone | 414 | 429 | 394 | 434 | 413 |
| - Tramadol | 175 | 220 | 240 | 208 | 184 |
| - Oxycodone | 37 | 51 | 51 | 51 | 75 |
| - Fentanyl | 22 | 22 | 40 | 34 | 58 |
| Cocaine | 139 | 169 | 247 | 320 | 371 |
| Any amphetamine | 97 | 120 | 151 | 157 | 160 |
| Any new psychoactive substance | 55 | 63 | 82 | 114 | 123 |
| Any benzodiazepine | 284 | 342 | 372 | 366 | 406 |
| Pregabalin | 4 | 33 | 38 | 90 | 111 |
| Gabapentin | 8 | 9 | 26 | 49 | 59 |
| All antidepressants | 468 | 466 | 517 | 447 | 460 |
| Paracetamol5 | 182 | 226 | 200 | 197 | 219 |
| Propranolol | 39 | 46 | 54 | 55 | 45 |
| Source: Office for National Statistics | |||||
| Notes: | |||||
| 1. Cause of death was defined using the International Classification of Diseases, Tenth Revision (ICD-10) (see the Quality and Methodology Information for more details). | |||||
| 2. Figures are for deaths registered, rather than deaths occurring in 2012 to 2016. | |||||
| 3. Figures for England and Wales include deaths of non-residents. | |||||
| 4. Figures for opioids exclude opioids contained in a paracetamol compound, ie co-codamol, co-dydramol and co-proxamol. | |||||
| 5. Figures exclude dextropropoxyphene mentioned without paracetamol. | |||||
Download this table Table 1: Number of drug-related deaths where selected substances were mentioned on the death certificate, deaths registered in England and Wales, 2012 to 2016
.xls (29.2 kB)
Figure 5: Age-standardised mortality rates for selected substances, deaths registered 1993 to 2016
England and Wales
Source: Office for National Statistics
Notes:
- Age-standardised mortality rates per 1 million population, standardised to the 2013 European Standard Population.
- Cause of death was defined using the International Classification of Diseases, Ninth Revision (ICD-9) for the years 1993 to 2000 and Tenth Revision (ICD-10) from 2001 onwards. More details can be found in the Quality and Methodology Information report. Deaths were included where the underlying cause was drug related and the specified substance was mentioned on the death certificate.
- Figures are for deaths registered, rather than deaths occurring in each calendar year.
- Figures for England and Wales include deaths of non-residents.
Download this chart Figure 5: Age-standardised mortality rates for selected substances, deaths registered 1993 to 2016
Image .csv .xlsIn line with 2015, over half (54%) of all deaths related to drug poisoning in 2016 involved an opiate (mainly heroin and/or morphine).
Heroin and/or morphine deaths remain stable
As can be seen in both Figure 5 and Figure 6, at a national level, deaths involving heroin and/or morphine remained stable in 2016. Figure 6 shows that the number of deaths registered in 2016 involving heroin and/or morphine was 1,209 compared with 1,201 deaths registered in 2015. The number of heroin and/or morphine deaths in males fell for the first time since 2012, with 935 deaths registered in 2016 compared with 957 in 2015. Female deaths involving heroin and/or morphine increased to 274 deaths in 2016 compared with 244 deaths in 2015, an increase of 12% and the highest level recorded since records began.
Figure 5 shows the sharp increase in the rate of heroin and/or morphine deaths from 2012 to 2015 following the “heroin drought”, which occurred in 2010 to 2011 and was followed by increased purity of heroin and associated overdoses. See the Deaths related to drug poisoning in England and Wales: 2015 registrations bulletin for more information on the heroin drought and the effect it had on trends in heroin purity.
However, despite the marked increase seen over the years, the mortality rate for deaths relating to heroin and/or morphine in 2016 remained the same as in 2015, at 21.3 deaths per 1 million population. This trend was also seen in both sexes with the mortality rate for deaths relating to heroin and/or morphine in 2016 for males and females staying stable (33.1 deaths per 1 million population for males and 9.5 deaths per 1 million for females).
In contrast to 2015, increases in the number of deaths involving heroin and/or morphine were not seen across all ages in 2016. The biggest increase was seen in people aged 40 to 49 years; however, the number of deaths remained stable in the remaining age groups (see Reference Table 7 in the downloadable datasets for deaths involving selected substances broken down by age for more detail).
Figure 6: Number of drug-related deaths where heroin and/or morphine were mentioned on the death certificate, by sex, deaths registered 2006 to 2016
England and Wales
Source: Office for National Statistics
Notes:
- Cause of death was defined using the International Classification of Diseases, Ninth Revision (ICD-9) for the years 1993 to 2000 and Tenth Revision (ICD-10) from 2001 onwards. More details can be found in the Quality and Methodology Information report. Deaths were included where the underlying cause was drug related and the specified substance was mentioned on the death certificate.
- Figures are for deaths registered, rather than deaths occurring in each calendar year.
- Figures for England and Wales include deaths of non-residents.
Download this chart Figure 6: Number of drug-related deaths where heroin and/or morphine were mentioned on the death certificate, by sex, deaths registered 2006 to 2016
Image .csv .xlsPublic Health England’s (PHE’s) Adult Substance Misuse report, published in 2016, states that the number of people in treatment for opiate misuse has been declining in recent years and has decreased again from 152,964 in 2014 to 2015 to 149,807 in 2015 to 2016. The number of opiate users aged 40 and over starting treatment has shown an upward trend and PHE note in their report that “a large proportion of heroin/opiate users in treatment in 2015 to 2016 will have started using heroin in the epidemics of the 1980s and 1990s and are now over 40 years of age, having been using heroin for a significantly long period of time.” The ageing cohort of heroin users often have a range of complex physical illnesses as a result of long-term drug use, which may make them particularly vulnerable to death from drug misuse.
As well as the long-term health and psychosocial problems associated with heroin dependence, there is also a significant risk of users dying from a heroin overdose. A drug called naloxone can be used to reverse the life-threatening effects of a heroin overdose, such as depressed breathing. In “take-home naloxone” programmes, naloxone and training is provided to people who use drugs and people close to them, to enable them to administer naloxone in an emergency overdose situation. In October 2015, following advice from the Advisory Council on the Misuse of Drugs (ACMD), the government eased the restrictions on who can be supplied with naloxone, paving the way for local authorities to make take-home naloxone more widely available to drug users and their families and in facilities where drug users tend to gather (for example, hostels).
According to a 2017 survey by the Local Government Association, 90% of local authorities now make available take-home naloxone, mainly through drug-treatment services. This change in legislation that resulted in the majority of local authorities providing take-home naloxone may be a contributing factor for the number of heroin-related deaths remaining stable in 2016.
Tramadol-related deaths decrease to lowest level since 2012
The number of drug-related deaths involving tramadol (a synthetic opioid analgesic) fell again from 208 deaths registered in 2015 to 184 deaths in 2016, a decrease of 12% and the lowest level recorded since 2012. Tramadol was controlled under the Misuse of Drugs Act 1971 as a class C substance in June 2014, and this, along with a decrease in the number of prescriptions for tramadol dispensed in the community may explain the downward trend in tramadol-related deaths.
Deaths involving cocaine continue to rise
There were 371 deaths involving cocaine in 2016, a 16% increase from the 320 deaths registered in 2015. Cocaine-related mortality rates have been increasing year-on-year and reached a record high of 6.4 deaths per 1 million population; although this increase in rate was not significantly different from the rate of 5.6 deaths per 1 million population in 2015.
The majority of cocaine-related deaths occur in men aged 30 to 49 years and increases in male cocaine-related deaths were observed in those age groups in 2016. However, the number of cocaine-related deaths remained relatively stable for men across the remaining age groups and women across all age groups.
Evidence to distinguish the form of cocaine taken (crack or powder) is rarely provided on death certificates; therefore the figures for cocaine will include some deaths where cocaine was taken in the form of crack cocaine.
The Home Office Crime Survey for England and Wales 2015 to 2016 suggests that powder cocaine is the second most commonly used drug (after cannabis) with 2.2% of adults aged 16 to 59 years using cocaine in 2015 to 2016. Despite the increase in cocaine-related deaths registered in 2016, this is a similar usage proportion to 2014 to 2015. The National Crime Agency (2017) reports that there was a significant increase in both crack and powder cocaine purity at all levels in 2016, including user-level, which may partly explain the increase in deaths relating to cocaine.
Deaths involving fentanyl increase
There were 58 deaths involving fentanyl in 2016, a large increase from the 34 deaths registered in 2015. Fentanyl is a powerful synthetic opioid analgesic used to treat or manage severe pain. After the recent fentanyl crisis in America and Canada, which saw significant increases in the number of deaths from fentanyl overdoses, Public Health England issued a warning to heroin users and health officials regarding the contamination of heroin with synthetic opiates, especially fentanyl due to its potency.
Oxycodone-related deaths increase
There were 75 deaths involving oxycodone in 2016, the first increase after deaths had remained stable at 51 for the past 3 years. Oxycodone is an opioid pain medication used to treat moderate to severe pain. Prescriptions for oxycodone have seen an upward trend year-on-year since 2006 according to NHS Digital.
Deaths involving paracetamol increase in 2016
There were 219 deaths involving paracetamol and its compounds in 2016 compared with 197 deaths in 2015, an increase of 11%. Of these deaths, 72% involved paracetamol not from a compound and the remaining involved a paracetamol compound, mostly co-codamol (paracetamol and codeine).
Propranolol deaths decrease to lowest level since 2012
Propranolol is a beta blocker that is used to treat a range of conditions such as hypertension, angina, migraine and anxiety. Deaths involving propranolol had been increasing since 2009 and reached a peak of 55 deaths in 2015 but have decreased to 45 deaths in 2016, the lowest recorded since 2012.
In contrast to the decrease in the number of propranolol-related deaths seen in 2016, between 2015 and 2016, according to NHS Digital prescriptions for propranolol have risen.
Back to table of contents7. Deaths involving new psychoactive substances continue to increase
New psychoactive substances (NPS) contain chemicals that produce similar psychoactive effects to “traditional” illegal drugs like cocaine, cannabis and ecstasy. They started to become more popular on the UK drugs scene around 2008 to 2009, with synthetic stimulants such as benzylpiperazine (BZP) and mephedrone, and synthetic cannabinoids (such as “spice”), among the first to gain popularity. NPS are sometimes referred to as “legal highs”, but the majority are controlled under the Misuse of Drugs Act 1971, so are no longer legal.
The mortality rate from deaths involving NPS is very low compared with heroin and/or morphine (2.1 deaths per 1 million population compared with 21.3 per 1 million respectively). However, deaths involving NPS have increased sharply over the past 5 years, with 123 deaths registered in 2016 (up from 114 deaths registered in 2015 and an 8% increase).
Moreover, 39 of the NPS-related deaths in 2016 involved NPS drugs that were not controlled under the Misuse of Drugs Act at the time of death. The government introduced the Psychoactive Substances Act in 2016, which established a blanket ban on the importation, production or supply of most psychoactive substances. However, it is likely to be several years before our data shows whether this ban has had any effect on deaths involving NPS.
Deaths involving mephedrone decrease whilst deaths involving synthetic cannabinoids increase in 2016
Reference table 8 gives the number of deaths involving specific types of NPS. Deaths involving mephedrone decreased from 44 deaths in 2015 to 15 deaths in 2016, the lowest recorded since 2012. Public Health England’s 2016 Adult Substance Misuse report shows that the number of people presenting to drug treatment services for mephedrone misuse decreased from 2,024 in 2014 to 2015 to 1,647 in 2015 to 2016.
In addition, the Home Office Crime Survey for England and Wales 2015 to 2016 states that mephedrone use fell in those aged 16 to 59 years, largely driven by a fall in use among young adults aged 16 to 24 years.
There is a more detailed discussion of the relationship between mephedrone use and mephedrone deaths in our special article on Deaths involving legal highs in England and Wales.
There has been growing concern in recent years about the harms caused and violence linked to the use of synthetic cannabinoids, such as “spice”, particularly in prisons, as detailed in the HM Chief Inspector of Prisons for England and Wales annual 2015 to 2016 report. Our data shows there being only a small number of deaths mentioning synthetic cannabinoids.
There is no officially agreed list of substances that are categorised as NPS, but we include the following types of substances:
gamma-hydroxybutyrate (GHB) and its precursor gamma-butyrolactone (GBL)
piperazines
cathinones such as mephedrone
benzofurans
prescription-type drugs, for example, benzodiazepine analogues
All drugs included in our definition for the purposes of this bulletin are listed in the “Definition” tab of the reference tables. Additional NPS will be added to the list in future years, as and when they are identified in the drug-related deaths data. We welcome comments on the drugs included in this category.
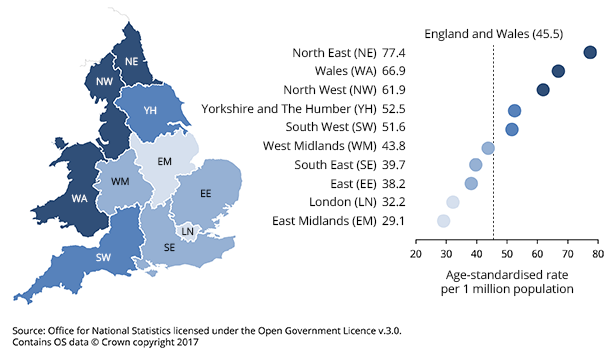
Back to table of contents8. North East had the highest drug misuse mortality rate in England in 2016
Although none of the geographical trends observed in 2016 were statistically significant, in England, the mortality rate from drug misuse has been increasing year-on-year since 2012. In 2016, the rate increased by 3% compared with 2015 from 42.9 deaths per 1 million population to 44.1 deaths per 1 million population (an increase to 2,383 deaths).
The mortality rate for drug misuse in Wales continued to increase from 58.3 deaths per 1 million population in 2015 to 66.9 deaths per 1 million in 2016, with Wales now having a higher rate of deaths from drug misuse than eight of the regions of England (Figure 7). Since 2014, the number of drug misuse deaths in Wales has increased from a rate of 39.0 deaths per 1 million population to 66.9 deaths per 1 million, a significant increase. This is driven by the number of deaths increasing from 113 in 2014 to 192 in 2016.
Figure 7: Age-standardised mortality rate for deaths related to drug misuse, by country and region, registered in 2016
Source: Office for National Statistics
Notes:
- Age-standardised mortality rates per 1 million population, standardised to the 2013 European Standard Population.
- Cause of death was defined using the International Classification of Diseases, Ninth Revision (ICD-9) for the years 1993 to 2000 and Tenth Revision (ICD-10) from 2001 onwards. More details can be found in the Quality and Methodology Information report.
- Figures are for deaths registered, rather than deaths occurring in each calendar year.
- Deaths of persons usually resident in each country and region, based on boundaries as of May 2017.
Download this image Figure 7: Age-standardised mortality rate for deaths related to drug misuse, by country and region, registered in 2016
.png (82.5 kB) .xls (43.5 kB)
9. Effect of registration delays on drug misuse deaths
In England and Wales, almost all drug-related deaths are certified by a coroner following an inquest. The death cannot be registered until the inquest is completed, which can take many months or even years, and we are not notified that a death has occurred until it is registered.
In common with most other mortality statistics, figures for drug-related deaths are presented for deaths registered in a particular calendar year, rather than deaths occurring each year. This enables figures to be published in a timelier manner, but can make the trends more difficult to interpret, especially for smaller geographical areas.
Out of the 2,593 deaths related to drug misuse registered in 2016, just under half (1,221) occurred in years prior to 2016.
Figure 8: Average registration delay for deaths relating to drug misuse, by country, deaths registered 1993 to 2016
England and Wales
Source: Office for National Statistics
Notes:
- The registration delay is calculated as the difference between the date each death occurred and the date it was registered, measured in days. The average delay is represented using the median.
- Cause of death was defined using the International Classification of Diseases, Ninth Revision (ICD-9) for the years 1993 to 2000 and Tenth Revision (ICD-10) from 2001 onwards. More details can be found in the Quality and Methodology Information report.
- Figures are for deaths registered, rather than deaths occurring in each calendar year.
- Figures are for persons usually resident in England and Wales, based on boundaries as of May 2017.
Download this chart Figure 8: Average registration delay for deaths relating to drug misuse, by country, deaths registered 1993 to 2016
Image .csv .xlsFigure 8 shows that the average (median) registration delay for deaths relating to drug misuse differs between England and Wales, with England showing a smoother pattern compared to Wales (due to the larger population and greater number of drug misuse deaths). After rising steadily over the years and peaking in 2013, registration delays in England for deaths relating to drug misuse began to fall and have stayed stable with an average delay of 158 days in 2016.
In Wales, registration delays peaked in 2006 but then generally decreased sharply until 2014. This was followed by an increase and average registration delays for deaths related to drug misuse in Wales are now in line with England’s figures, with an average registration delay of 160 days in 2016. These fluctuations in registration delays in Wales have made it difficult to interpret trends in drug misuse deaths in recent years as, unlike in England, the trend based on registration year is inconsistent with the trend based on occurrence year (see Figures 9 and 10).
Figure 9: Number of deaths from drug misuse by registration year and occurrence year, 1993 to 2015
England
Source: Office for National Statistics
Notes:
- Cause of death was defined using the International Classification of Diseases, Ninth Revision (ICD-9) for the years 1993 to 2000 and Tenth Revision (ICD-10) from 2001 onwards. More details can be found in the Quality and Methodology Information report.
- Figures only include deaths that were registered by 31 December 2016. Due to the length of time it takes to complete a coroner’s inquest, it can take months or even years for a drug-related death to be registered, so figures for deaths occurring in 2015 will be an underestimate.
- Deaths of persons usually resident in England, based on boundaries as of May 2017.
Download this chart Figure 9: Number of deaths from drug misuse by registration year and occurrence year, 1993 to 2015
Image .csv .xls
Figure 10: Number of deaths from drug misuse by registration year and occurrence year, 1993 to 2015
Wales
Source: Office for National Statistics
Notes:
- Cause of death was defined using the International Classification of Diseases, Ninth Revision (ICD-9) for the years 1993 to 2000 and Tenth Revision (ICD-10) from 2001 onwards. More details can be found in the Quality and Methodology Information report.
- Figures only include deaths that were registered by 31 December 2016. Due to the length of time it takes to complete a coroner’s inquest, it can take months or even years for a drug-related death to be registered, so figures for deaths occurring in 2015 will be an underestimate.
- Deaths of persons usually resident in Wales, based on boundaries as of May 2017.
Download this chart Figure 10: Number of deaths from drug misuse by registration year and occurrence year, 1993 to 2015
Image .csv .xlsFigure 10 shows that, for Wales, trends in drug misuse deaths by registration year and occurrence year began to differ substantially from 2010 onwards. In 2014, the trend based on registration year suggested a fairly large decrease in drug misuse deaths, but when the data were analysed by occurrence year, deaths were actually increasing in 2014. However, in 2015 the difference between deaths based on registration year and occurrence year in both England and Wales levelled out. Deaths in 2016 are not shown in Figures 9 and 10, as occurrences data are too incomplete for 2016. Once we have the late registrations, we would expect that occurrences data will show that drug misuse deaths continued to rise in 2016.
Back to table of contents12. Quality and methodology
Statistics on drug-related deaths are used by a range of public bodies, such as Public Health England (PHE), the Department of Health (DH), the Home Office, Public Health Wales and the Welsh Government, to evaluate the effectiveness of various strategies in reducing drug-related deaths. They are also used by The European Monitoring Centre for Drugs and Drug Addiction (EMCDDA) to compare trends in drug-related deaths across Europe.
The Deaths relating to drug poisoning Quality and Methodology Information report contains important information on:
- the strengths and limitations of the data and how it compares with related data
- uses and users of the data
- how the output was created
- the quality of the output including the accuracy of the data
- policy context and uses of the data
- comparability between countries of the UK
Cause of death is coded using the World Health Organisation’s (WHO) International Classification of Diseases (ICD). All deaths where the underlying cause is drug-related are included on a special database and additional processing is carried out to identify the specific substances involved in the death. Further details about the drug poisoning database, including the ICD codes used to define a drug-related death can be found in the Quality and Methodology Information report.
Age-standardised mortality rates were calculated using the number of drug-related deaths registered in each year as the numerator and the mid-year population estimate for that year as the denominator. Please see the Quality and Methodology Information report for more details about the calculation of confidence intervals and the interpretation of age-standardised rates.
In common with most other mortality statistics, figures for drug-related deaths are presented for deaths registered in a particular calendar year, rather than deaths occurring each year. Due to the length of time it takes to complete a coroner’s inquest, there can be a considerable delay between when the death occurred and when it was registered. See the “Effect of registration delays on drug misuse deaths statistics” section for more information.
The User guide to mortality statistics provides further information on the collection, production and quality of the underlying mortality data on which drug-related death statistics are based.
The Revisions policy for mortality statistics is available on our website.