Table of contents
- Main points
- Things you need to know about this release
- Statistician’s comment
- Deaths of homeless people have increased by 24% over five years
- There were more than five times as many male deaths compared with female deaths
- Over half of all deaths of homeless people in 2017 were due to three main factors
- Drug-related deaths of homeless people increased by 52 per cent over five years
- There is little evidence of a seasonal pattern in deaths of homeless people
- Deaths of homeless people were highest in London and the North West
- Wider context to this release
- Previous research on deaths of homeless people
- Quality and methodology
1. Main points
There were an estimated 597 deaths of homeless people in England and Wales in 2017, a figure that has increased by 24% over the last five years.
Men made up 84% of deaths of homeless people in 2017.
The mean age at death of homeless people was 44 years for men, 42 years for women and 44 years for all persons between 2013 and 2017; in comparison, in the general population of England and Wales in 2017, the mean age at death was 76 years for men and 81 years for women.
Over half of all deaths of homeless people in 2017 were due to drug poisoning, liver disease or suicide; drug poisoning alone made up 32% of the total.
London and the North West of England had the highest mortality of homeless people, both in numbers of deaths and per million population of the region.
2. Things you need to know about this release
These figures are produced as Experimental Statistics, which are in the testing phase and not yet fully developed. Experimental Statistics are new and still subject to testing in terms of their volatility and ability to meet customer needs. They have yet to be assessed against the rigorous quality standards of National Statistics. Comments and suggestions to improve the quality of this output and make it more useful to users are invited, and can be sent via email to mortality@ons.gov.uk.
These are the first official estimates of the number of deaths of homeless people in England and Wales. Figures are given for deaths registered in the years 2013 to 2017, with selected breakdowns by age and sex, cause of death, time of year, and geographical area. These figures are intended to be updated annually.
Deaths of homeless people were identified from the death registration records held by Office for National Statistics (ONS), and a statistical method called capture-recapture modelling was applied to estimate the most likely number of additional registrations not identified as homeless people. The figures reported here are the total estimated numbers, except where specifically described as being based on identified records only. The method used provides a robust but conservative estimate, so the real numbers may still be higher.
Definitions of homelessness exist for different purposes and with variations across the UK for legal and policy reasons. The Government Statistical Service (GSS) Harmonisation Team have explored the feasibility of harmonising definitions of homelessness for official statistics. A report on this work, which will outline recommendations to improve understanding of the comparability of UK homelessness statistics, will be published on the GSS website in early 2019.
The meaning of homelessness in this release is not based on a pre-existing definition but follows from the scope for identification of affected individuals in the death registration data. The records identified are mainly people sleeping rough, or using emergency accommodation such as homeless shelters and direct access hostels, at or around the time of death.
The methods used to identify cases are explained in the Quality and methodology section.
Rough sleeping statistics for England are produced annually by the Ministry of Housing, Communities and Local Government (MHCLG). The latest rough sleeping statistics were published on 25 January 2018. The publication provides information on the single night snapshot of rough sleeping that is taken annually in England using street counts and intelligence-driven estimates. The Welsh Government also collect data on homelessness. However, the figures on deaths contained in this bulletin cannot be directly compared with the rough sleeping statistics as we have used a wider definition of homelessness and also these new statistics collect data for the year as a whole rather than taking a single snapshot in time.
The figures presented show deaths registered each year, rather than deaths occurring each year. A substantial proportion (approximately 12% for the five-year period 2013 to 2017) of deaths of homeless people are certified by a coroner. This means that, due to the length of time it can take for an inquest to be completed, some of the deaths registered in (for example) 2017 will have occurred in earlier years, while some deaths that occurred in 2017 will not yet be included in the figures. These differences are likely to have relatively little impact at England and Wales level but can have more influence on figures for smaller geographical areas such as local authorities. See the latest report on the impact of registration delays on mortality statistics for more information.
We are grateful for advice and assistance in the development of these Experimental Statistics from The Bureau of Investigative Journalism, the Combined Homelessness and Information Network (CHAIN), the Homeless Impact Centre, Homelessness and Troubled Families team at the Ministry for Housing, Communities and Local Government, Planning and Housing Research – Greater Manchester Combined Authority, University College London – Institute of Health Informatics, and the Welsh Government. However, ONS itself independently produces these statistics, including determining the focus, content, commentary, illustration and interpretation of the measures presented and the comments provided from other organisations are purely advisory.
Back to table of contents3. Statistician’s comment
“Every year hundreds of people die while homeless. These are some of the most vulnerable members of our society so it was vital that we produced estimates of sufficient quality to properly shine a light on this critical issue. Today we have been able to do just that. We estimate that in 2017 there were 597 deaths of homeless people in England and Wales, a rise of 24% since 2013.
“Our findings show a pattern of deaths among homeless people that is strikingly different from the general population. For example, homeless people tend to die younger and from different causes. The average age of death last year was 44 years, with 84% of all deaths being men. More than half were related to drug poisoning, suicide, or alcohol, causes that made up only 3% of overall deaths last year.”
Ben Humberstone, Head of Health and Life Events, Office for National Statistics
Back to table of contents4. Deaths of homeless people have increased by 24% over five years
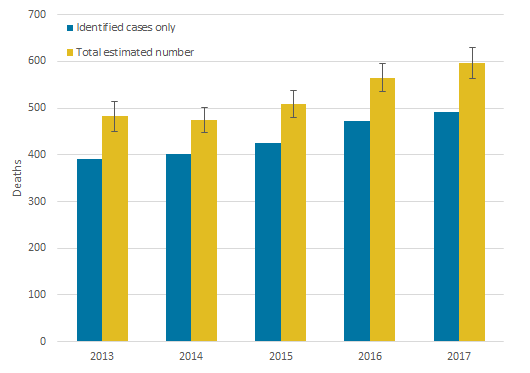
There were an estimated 597 deaths of homeless people in England and Wales in 2017, of which 491 were definitely identified in the death registration data. This is an increase of 115 deaths (24%) compared with the estimate of 482 deaths for 2013, the earliest year that we have reported for. The number of identified cases within the total estimate has increased by 99 (25%) since 2013. Of the 491 cases definitely identified in the death registration data for 2017, 480 were in England.
This difference between the increase in estimated and identified numbers may be due to an improvement in recording. However, the standard error (a measure of statistical uncertainty) for 2013 is slightly higher than for the following years, suggesting that the estimation for 2013 may be slightly less reliable.
Figure 1 shows a consistent increase over time in deaths of people identified as homeless, and an increase over time in the total estimate from 2014 onwards.
Figure 1: Deaths of homeless people (identified cases only and total estimated number) registered in 2013 to 2017
England and Wales
Source: Office for National Statistics – Death registrations
Notes:
Estimated numbers show error bars indicating 95% confidence interval of the estimate.
Figures are for deaths registered, rather than deaths occurring in each calendar year.
Figures for England and Wales may include deaths of non-residents.
The total estimated includes the identified cases plus the additional modelled cases.
Download this image Figure 1: Deaths of homeless people (identified cases only and total estimated number) registered in 2013 to 2017
.png (6.1 kB) .xlsx (19.4 kB)
5. There were more than five times as many male deaths compared with female deaths
The estimated number of deaths of homeless men in 2017 was 503, or 84% of the total, compared with 94 women.
Figure 2 shows the breakdown by sex and five-year age group. Based on the available data, no deaths were included below the age of 15 years, while an upper age cut-off of 75 years was applied to avoid accidental inclusion of elderly people in some institutional settings.
The most common age group was 45 to 49 years for men, and 35 to 39 years for women. In 2017, the mean age of death for men was 44 years and the women’s mean age of death was 42 years. The overall mean age of death for all persons was 44 years. In comparison, in the general population of England and Wales in 2015 to 2017 the mean age at death was 76 years for men and 81 years for women. Mean age at death is not the same as life expectancy, and further information on the mean age at death calculation can be found in section 15.7 of the User guide to mortality statistics.
Figure 2: Deaths of homeless people (estimated), by sex and age group, 2017
England and Wales
Source: Office for National Statistics – Death registrations
Notes:
Figures are for deaths registered, rather than deaths occurring in the calendar year.
Figures for England and Wales may include deaths of non-residents.
Download this chart Figure 2: Deaths of homeless people (estimated), by sex and age group, 2017
Image .csv .xls6. Over half of all deaths of homeless people in 2017 were due to three main factors
Over half of all deaths of homeless people in 2017 were due to three factors: accidents (including drug poisoning) accounted for 40%, suicides accounted for 13% and diseases of the liver accounted for 9%, as shown in Figure 3. This picture is consistent with findings in academic studies of the health and mortality of homeless individuals.
In comparison, the leading causes of death for all those aged 15 to 74 years in 2017 were ischaemic heart diseases, lung cancer and chronic lower respiratory diseases, accounting for 12%, 9% and 6% of deaths respectively.
Figure 3: Deaths of homeless people (estimated) by underlying cause of death, persons, 2017
England and Wales
Source: Office for National Statistics – Death registrations
Notes:
Underlying cause of death is allocated using the International Classification of Diseases Tenth Revision (ICD-10). The codes used for each of the listed causes are shown in the accompanying data tables.
Figures are for deaths registered, rather than deaths occurring in the calendar year.
Figures for England and Wales may include deaths of non-residents.
Download this chart Figure 3: Deaths of homeless people (estimated) by underlying cause of death, persons, 2017
Image .csv .xls7. Drug-related deaths of homeless people increased by 52 per cent over five years
In 2017, 190 estimated deaths of homeless people were due to drug poisoning, that is, 32% of the total number. Alcohol-specific causes (62 deaths) and suicide (78 deaths) accounted for 10% and 13% respectively of the deaths. Office for National Statistics (ONS) publishes annual mortality bulletins using specific definitions of alcohol-specific deaths, deaths related to drug poisoning, and suicides. For comparison, these three categories (drug poisoning, alcohol-specific causes and suicide) accounted for 0.7%, 1.2% and 0.9% respectively of all deaths in the general population in 2017.
This means that homeless people accounted for 5.0% of all drug poisoning deaths, 1.0% of alcohol specific deaths and 1.6% of suicides in England and Wales in 2017.
Figure 4: Deaths of homeless people (identified) by selected cause of death category, persons, 2013 to 2017
England and Wales
Source: Office for National Statistics – Death registrations
Notes:
Underlying cause of death is allocated using the International Classification of Diseases Tenth Revision (ICD-10). The codes used for each of the listed causes are shown in the accompanying data tables.
Figures are for deaths registered, rather than deaths occurring in the calendar year.
Figures for England and Wales may include deaths of non-residents.
Deaths due to suicide where drug poisoning was involved have been included in both "suicides" and in "drug poisonings"
Download this chart Figure 4: Deaths of homeless people (identified) by selected cause of death category, persons, 2013 to 2017
Image .csv .xlsThere was a substantial increase over time in drug poisoning deaths of homeless people, from 125 (26% of the total) in 2013, to 190 (32% of the total) in 2017. Deaths from alcohol-specific causes also increased, while deaths due to suicide fell slightly over the five-year period.
Looking at drug poisoning deaths in more detail, Table 1 shows the substances mentioned on the death certificates for those deaths categorised as due to drug poisoning in 2017. These numbers are based only on the identified records and not the estimated numbers, so that no assumptions are made about the drugs involved in deaths that cannot be analysed in detail. More than one substance can be mentioned in connection with each death, and in some cases alcohol or other factors may also be mentioned. The great majority of the drug poisoning deaths involved an opiate (115 deaths out of 151, 76%), most often heroin or morphine. Of the total drug poisoning deaths, 57 also mentioned alcohol on the death certificate.
| Substance | Deaths | |
|---|---|---|
| Any opiate | 115 | |
| Of which: | ||
| Heroin and morphine | 78 | |
| Methadone | 24 | |
| Tramadol | 4 | |
| Codeine (1) | 3 | |
| Dihydrocodeine (1) | 2 | |
| Cocaine | 15 | |
| Amphetamine | 3 | |
| Cannabis | 1 | |
| Benzodiazepine | 21 |
Download this table Table 1: Drug poisoning deaths of homeless people (identified) by substances mentioned, persons, 2017
.xls .csv8. There is little evidence of a seasonal pattern in deaths of homeless people
Deaths of homeless people lacked a clear seasonal pattern when analysed by month of death. The level of excess winter mortality found in the general population was not apparent. Excess winter mortality is the number of winter deaths minus the average of non-winter deaths.
Further analysis is required to determine whether the variations over time in deaths of homeless people relate to weather, or to other factors such as the availability and purity of opiates leading to unexpected drug poisonings. The opening of temporary homeless shelters and services in winter may have a protective effect.
Figure 5 shows the average estimated number of deaths for each calendar month taking the five-year period as a whole, along with the highest and lowest number in the period for each month. The mean estimated number of deaths per month over the whole period was 44.
Figure 5: Deaths of homeless people (estimated) by month of occurrence, persons, 2013 to 2017
England and Wales
Source: Office for National Statistics – Death registrations
Notes:
Figures by month may not sum to the total for the year due to rounding.
Figures are for deaths occurring, rather than deaths registered in the calendar year or month. Figure for deaths occurring in the period but registered in 2018 are not yet available.
Figures for England and Wales may include deaths of non-residents.
Download this chart Figure 5: Deaths of homeless people (estimated) by month of occurrence, persons, 2013 to 2017
Image .csv .xlsBecause of small numbers below regional level, figures for individual local authorities are not given in this bulletin.
Back to table of contents9. Deaths of homeless people were highest in London and the North West
London and the North West had by far the largest numbers of deaths of homeless people in 2017 out of the English regions, with 136 and 119 estimated deaths respectively. London had more than one-fifth (23%) of the estimated total number of homeless deaths in England and Wales. In contrast, Wales had fewer deaths than any of the regions of England.
Figure 5 shows, as well as the estimated numbers of deaths, the number per million total population of each area, to allow for the very different sizes of different regions. The difference in rank order among the areas is largely similar regardless of which measure is used. For example, London and the North West change places with each other when comparing deaths per million (15.4 and 16.4 respectively) but remain the two areas with the highest mortality by a large margin.
Please note that these figures per million are not related to the number of homeless people in an area and are not age-standardised: they should not be compared with published mortality rates.
Figure 6: Deaths of homeless people (estimated) by area, persons, 2017
Wales and regions of England
Source: Office for National Statistics – Death registrations
Notes:
Wal - Wales, NE - North East, NW - North West, Y&TH - Yorkshire and The Humber, E Mid - East Midlands, W Mid - West Midlands, E - East of England, LDN - London, SE - South East, SW - South West.
Figures are for deaths registered, rather than deaths occurring in the calendar year.
Area boundaries correct at November 2017.
Download this chart Figure 6: Deaths of homeless people (estimated) by area, persons, 2017
Image .csv .xlsNumbers of estimated deaths of homeless people in 2017 and figures per million total population are shown in Table 2 for the combined authorities (city regions) in England and London. The highest mortality was in the Greater Manchester Combined Authority (CA), with 50 deaths (17.8 per million population). West Midlands (CA) and Liverpool City Region (CA) had the second- and third-largest numbers.
| Area | Deaths | Per million |
|---|---|---|
| Cambridgeshire and Peterborough | 6 | 7.2 |
| Greater Manchester | 50 | 17.8 |
| Liverpool City Region | 32 | 20.5 |
| North East | 26 | 12.9 |
| Sheffield City Region | 9 | 6.1 |
| Tees Valley | 6 | 9.0 |
| West Midlands | 34 | 11.8 |
| West of England | 19 | 21.0 |
| West Yorkshire | 13 | 5.8 |
| London Region (shown for comparison) | 136 | 15.4 |
Download this table Table 2: Deaths of homeless people (estimated) by area, persons, 2017
.xls .csv10. Wider context to this release
Homelessness is an important problem affecting some of the most vulnerable people in society, but which is difficult to measure as well as to solve. The government’s Rough Sleeping Strategy for England set new aims, including that deaths or serious harm of people who sleep rough should be rigorously investigated, while the Welsh Rough Sleeping Action Plan called for better monitoring and measuring of the extent of rough sleeping. The UK Statistics Authority published a review of housing and planning statistics as a whole in November 2017.
No official figures on deaths of homeless people have been produced until now. The problem of creating these estimates is two-fold: firstly, that homelessness has many definitions, and secondly, that there is no specific way of recording homelessness at death registration. The different types of homelessness range from people who sleep rough to those who are awaiting rehousing by a local authority, from short-term residents of night shelters and hostels to those who are “sofa surfing” in the houses of friends or family.
Different definitions of homelessness exist for different purposes – the Ministry of Housing, Communities and Local Government (MHCLG) publishes important information on numbers of homeless people in England, while the Welsh Government produces relevant data for Wales. MHCLG published the first outputs of the new Homelessness Case Level Information Classification (H-CLIC) data collection, as Experimental Statistics, on 13 December 2018.
A Government Statistical Service (GSS) feasibility report on harmonisation of homelessness definitions across the UK is due to be published in early 2019. A number of developments are being undertaken to improve the cohesion, quality, harmonisation, accessibility and user engagement of homelessness and housing statistics. For more information, see the GSS housing and planning statistics web page.
A limitation of the data is that there is no specific way for the fact that a deceased person was homeless to be recorded at the time of death registration. We intend to work with the General Register Office, who publish standards and guidance for local registrars, to promote clear and consistent recording of these circumstances, while respecting the sensitivities of the next-of-kin where they are involved.
Back to table of contents11. Previous research on deaths of homeless people
Previous UK research on deaths of homeless people has focused mainly on London or other specific cities, and has used a variety of methods. Nevertheless, past findings show some clear similarities to our figures. Reports for the charity Crisis by Keyes and Kennedy in 1992 and Grenier in 1996 studied coroners’ records, the former for central London only and the latter extending a similar approach to London, Manchester and Bristol, and found an average age of death between 42 and 47 years. Shaw and colleagues estimated in a paper in 1999 that the death rates of hostel residents were seven times greater, and those of people sleeping rough 25 times greater, than the general population.
A later study for Crisis entitled Homelessness Kills, in 2012, estimated the mortality of homeless people in England for the period 2001 to 2009 using death registration data held by Office for National Statistics (ONS), by matching the recorded postcodes against known addresses of homeless projects. The study found 1,731 deaths in the nine-year period, an average of 192 deaths per year. This cannot be directly compared with our figures for 2013 to 2017, which are based on more comprehensive searches of the data and an additional element of statistical modelling. Points of interest in the Crisis study were that 90% of those identified were male, nearly one-third were in London, and the average age of death was 47 years for men and 43 years for women. Drug and alcohol poisoning were among the most common causes of death.
The Health and Homelessness in Scotland study for the Scottish Government, published in 2018, covered all households who were assessed as homeless or threatened with homelessness in Scotland between June 2001 and November 2016, and used a case-control design to compare the health and mortality outcomes of the cohort with other population groups. Although this is a much wider definition of homelessness than was used for our estimates, it is notable that the highest relative mortality risk was in the 31 to 40 age group, while drug poisoning conditions accounted for 22.8% of male deaths and 18.0% of female deaths in the group.
Research carried out in Glasgow and published in 2009 found that over five years of observation, 1.7% of the general population and 7.2% of the homeless cohort died. Also, homelessness had differential effects on cause-specific mortality. Among patients who had been hospitalised for drug poisoning conditions, the homeless cohort experienced a sevenfold increase in risk of death from drugs compared with the general population. The research was a retrospective five-year study of two fixed cohorts, homeless adults and an age- and sex-matched random sample of the local non-homeless population in Greater Glasgow National Health Service Board area for comparison.
The Bureau of Investigative Journalism set up a crowdsourced database of deaths of homeless people, rather than relying on official records. They estimated in October 2018 that there had been at least 449 deaths of homeless people in the UK, in the 12 months between October 2017 and October 2018.
Previous research with a wider international context, Morbidity and mortality in homeless individuals, prisoners, sex workers, and individuals with substance use disorders in high-income countries: a systematic review and meta-analysis, was published in November 2017. This showed that mortality estimates were highest for deaths due to injury, poisoning, and other external causes.
Back to table of contents12. Quality and methodology
Production of these figures
The figures in this release were produced following a two-stage process. First, the complete death registration records held by Office for National Statistics (ONS), for deaths registered in the calendar years 2013 to 2017, were analysed using multiple search strategies to identify all those deaths where there was evidence that the deceased was homeless at or around the time of death. Then, the results of the searches were used in a statistical modelling technique known as capture-recapture to estimate a total figure, which allows for the likelihood of more deaths of homeless people being present in the data but not identified.
Five search strategies were used, which are detailed in this section.
The recorded place of residence contained any of a list of text expressions such as “no fixed abode”, “homeless” and “night shelter” or the name or address of a known homeless hostel or project. An extensive list of addresses was compiled from publicly available sources. While this list was necessarily incomplete, the statistical model was found to be robust against even a substantial number of omissions.
Similarly, the recorded place of death containing any of a list of text expressions such as “no fixed abode”, “homeless” and “night shelter” or the name or address of a known homeless hostel or project.
The death had been investigated by a coroner, and the details received by ONS after the inquest included any of the text expressions or addresses outlined previously. The information provided by coroners is broader and may be more precise than for deaths that do not require an inquest.
The record contained a “communal establishment code”, which specified a homeless hostel or shelter. These codes are assigned by ONS during the initial processing of a death registration, based on a periodically updated list of known postcodes of institutions of all kinds, ranging from hospitals to prisons.
The death occurred in hospital or in a hostel or similar location, and the recorded postcode of the place of residence was identical to the postcode of the place of death. This search ensured the inclusion of homeless people who had been found in need of medical attention in the street and subsequently died in hospital, or certain other possible scenarios.
The records identified by these searches were checked individually to prevent the incorrect inclusion of deaths, such as a person who lived in a hostel that catered for a non-homeless client group. No definite homeless deaths were identified below the age of 15 years, which was taken as the lower age cut-off. An upper age cut-off of 75 years was applied: this was important to exclude deaths of elderly people in a care home or after a long hospital stay, for whom in some cases no residential address had been recorded.
The estimation was carried out using the widely used Rcapture package in the R programming language, for which there is published documentation available. The calculations estimate the most probable size of an unknown closed population based on multiple captures (searches), using Poisson loglinear regression models and an iteratively reweighed least squares algorithm, which is simple and numerically stable. Based on the nature of the data and the diagnostic and goodness-of-fit statistics produced by the package, the Chao model was selected out of several alternatives. This is a robust but conservative (lower bound) model, so that the figures produced should be taken as the lowest probable estimates.
Following initial investigation of the methods, two sensitivity analysis were carried out.
The statistical model was rerun using a method of randomly removing from 50 to 200 out of approximately 600 specific addresses from the list of addresses, to gauge the impact of the incompleteness of the available lists. The results of four iterations showed that removing a substantial proportion of the addresses made no more than 2% difference to the final estimate.
The model was rerun removing each of the separate lists (searches) one at a time. Again, the results were found to be relatively stable. The model was also run with and without two independent data sources in addition to the death registration records, namely the national list of deaths compiled by The Bureau of Investigative Journalism and a dataset provided in confidence by the CHAIN service in London. Both of these produced higher but less robust estimates, due largely to the difficulty of accurately matching the records (which often contained minimal identifying details) to the death registrations.
Limitations
Local registrars do not follow any consistent practice in recording deaths of homeless people. Furthermore, it is possible that the fact that the deceased was homeless might be omitted either due to incomplete information given to the registrar, or out of consideration for the preferences of the family. It is not known whether there is any systematic difference between areas or change over time in the pattern of recording. We intend to work with the General Register Office, who publish standards and guidance for local registrars, to promote clear and consistent recording of these circumstances, while respecting the sensitivities of the next-of-kin where they are involved.
There is no single, comprehensive list available of all homeless hostels and emergency shelters. We will work with stakeholders to seek to improve the lists used in our searches. However, the model is an estimation based on matching between lists, which accounts for incomplete data, so this is not considered a major problem.
The lack of a count of the homeless population that meet our definition means that we were unable to produce rates of death within the homeless population itself. Instead, we have generated crude rates through the use of the general population at national, regional and combined authority level.
It was found while checking the records initially identified as homeless that some were elderly people who had died in an institutional setting, such as in a care home or after a long hospital stay, where for unknown reasons no residential address was recorded. To avoid the inclusion of such cases in these figures, an upper age limit of 74 years was applied. This means that a small number of genuine deaths of homeless people aged 75 years or over might have been excluded.
Like any statistical model there is the potential for error. However, we are confident we have managed to minimise this by checking the records identified as homeless people individually, and by application of a well understood statistical model with expert peer review of our results. Further details of the statistical methodology will be made available in due course, including publication of user guides and quality documentation according to National Statistics standards.
Small numbers at local level limit the breakdowns that can be published because of the need to protect confidentiality. It should also be noted that the margin of error in the estimation and the possibility of geographical differences in recording mean that the estimates are less reliable at subnational, and especially more local levels.
Further documentation on ONS mortality statistics
Comprehensive information on the production, quality and uses of ONS mortality statistics can be found at:
Mortality statistics in England and Wales Quality and Methodology Information
Alcohol-specific deaths in the UK Quality and Methodology Information
Deaths related to drug poisonings in the UK Quality and Methodology Information
Deaths related to drug poisoning in England and Wales: 2017 registrations