Table of contents
1. Main points
- Provisional analysis, for the period 2 March to 15 May 2020 compares the risk of death involving the coronavirus (COVID-19) according to a person’s disability status as recorded in the 2011 Census; people are counted as disabled if they said their daily activities were “limited a little” or “limited a lot” by a health problem or disability in this data source.
- Males whose activities were “limited a lot” at the 2011 Census had an all ages standardised rate of death involving COVID-19 of 199.7 deaths per 100,000; for females, the rate was 141.1 deaths per 100,000.
- The equivalent rates for males and females who were not disabled in 2011 were 70.2 and 35.6 deaths per 100,000 respectively.
- After adjusting for region, population density, socio-demographic and household characteristics, the relative difference in mortality rates between those "limited a lot" and those not disabled was 2.4 times higher for females and 1.9 times higher for males.
- Our research was based on linking deaths to the 2011 census, the most timely data available, including people aged 9 years and over; we used a regression model to adjust for specific characteristics for people in private households at the time of the Census; we aim to undertake further analysis that takes into account other characteristics such as pre-existing health conditions.
2. Introduction
This article presents provisional analyses of deaths involving the coronavirus (COVID-19) by self-reported disability status, as reported in the 2011 Census in England and Wales. It includes deaths that occurred between 2 March and 15 May 2020, which were registered by 29 May 2020. As disability status is not recorded on the death certificate, this information was retrieved through record linkage of death registrations to the 2011 Census along with other socio-demographic factors. While data from the 2011 Census are now nine years old, they are still the best currently available for large-scale analyses.
Despite this, and because of changes in disability status, it is likely that the number of people who are recorded as having an activity-limiting condition is now an underestimate, because those not limited in 2011 may have developed a long-term health condition over the past nine years that limits their activities or any existing health condition may have worsened in severity causing them to become limited. While transitions out of activity limitation are also possible, this is a less likely effect bearing in mind that reported disability tends to increase with age. As such, these contrasts should be treated as conservative estimates of differences.
Analyses have been restricted to those aged nine years and over because children aged under nine years would not have been born and therefore included in the 2011 Census. Immigrants entering the country since the 2011 Census are also excluded. More details on the data used can be found in the technical appendix.
Disability is one of the protected characteristics under the Equality Act 2010. The population prevalence of disability in 2011 among those resident in private households, as measured by the 2011 Census, was 17%. More recent figures from the Family Resources Survey 2018 to 2019 reported the prevalence of disability as 11.6 million people in England (21% of the population) and 0.8 million people in Wales (25% of the population). Among the study population of usual residents in private households who survived until 2 March 2020, the population prevalence of disability was 16.4%.
Embed code
The 2011 Census question asked:
“Are your day-to-day activities limited because of a health problem or disability which has lasted, or is expected to last, at least 12 months? Include problems related to old age?”
- Yes, limited a lot
- Yes, limited a little
- No
Those responding that their day-to-day activities were “limited a lot” or “limited a little” were classified as disabled for the purposes of this analysis. Currently, we do not have data sources that will allow us to analyse mortality statistics by learning disabilities or any other specific type of disability.
Back to table of contents3. Disability status breakdown of COVID-19 deaths by age and sex
Table 1 shows the number of deaths involving the coronavirus (COVID-19) and their percentage distribution across disability categories among the study population.
| Disability status | Number of COVID-19 deaths | Percentage of COVID-19 deaths | Number of all deaths | Percentage of all deaths |
|---|---|---|---|---|
| Limited a lot | 11,489 | 30.3% | 40,349 | 28.7% |
| Limited a little | 10,958 | 28.9% | 40,478 | 28.8% |
| Not limited | 15,509 | 40.9% | 59,723 | 42.5% |
| Total | 37,956 | 100.0% | 140,550 | 100.0% |
Download this table Table 1: Deaths involving COVID-19 by disability status: England and Wales, occurring between 2 March to 15 May 2020
.xls .csvBreaking the deaths down further by age and sex, we see that deaths involving COVID-19 follow the pattern reported in previous Office for National Statistics (ONS) COVID-19 releases, of being more numerous for males and in people aged 65 years and over compared with those aged under 65 years (Table 2).
| Disability Status | Males | Females | ||
|---|---|---|---|---|
| Aged 9 to 64 years | Aged 65 years and over | Aged 9 to 64 years | Aged 65 years and over | |
| Limited a lot | 575 | 4,947 | 474 | 5,493 |
| Limited a little | 349 | 5,448 | 224 | 4,937 |
| Not limited | 1,444 | 8,293 | 679 | 5,093 |
| Total | 2,368 | 18,688 | 1,377 | 15,523 |
Download this table Table 2: Deaths involving COVID-19 by age, sex and disability status: England and Wales, occurring between 2 March to 15 May 2020
.xls .csv4. Age-standardised mortality rates of death involving COVID-19 by disability status in 2011
Table 3 presents deaths involving the coronavirus (COVID-19) age-standardised mortality rates (ASMRs)¹ among males and females aged 9 years and over per 100,000 of the population at risk. Figures 1 and 2 show the patterns by sex and disability among those aged 9 to 64 years and 65 years and over respectively.
| Disability | Males | Females | ||||
|---|---|---|---|---|---|---|
| Rate | Lower 95% confidence limit | Upper 95% confidence limit | Rate | Lower 95% confidence limit | Upper 95% confidence limit | |
| Limited a lot | 199.7 * | 193.65 | 205.75 | 141.11* | 135.95 | 146.28 |
| Limited a little | 125.07 * | 121.21 | 128.94 | 68.95* | 66.51 | 71.4 |
| Not Limited | 70.2 | 68.73 | 71.67 | 35.64 | 34.7 | 36.57 |
Download this table Table 3: Age-standardised rates for deaths involving COVID-19 per 100,000 population with 95 percent confidence intervals by sex and disability status: England and Wales
.xls .csvThese results confirm that both males and females who were either “limited a lot” or “limited a little” in 2011 had a statistically significantly higher rate of death involving COVID-19 than those who were not disabled.
In Figure 1, we present ASMRs for deaths involving COVID-19 among males and females aged 9 to 64 years. In Figure 2, we present ASMRs for those aged 65 years and over, to control for differences in population age structure.
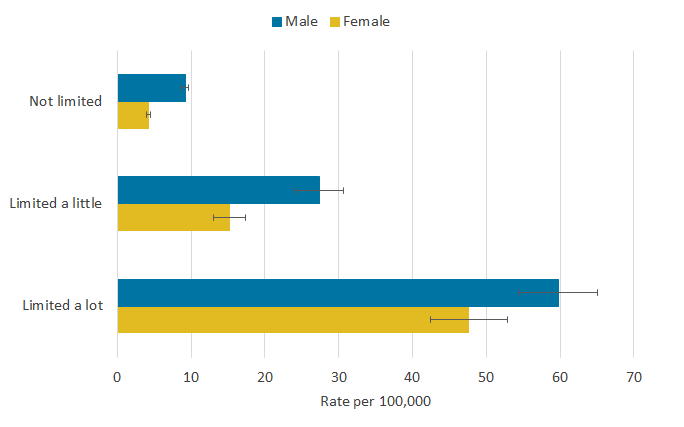
Figure 1: Among those aged 9 to 64 years, the relative gaps between those disabled and not disabled were largest
Age-standardised mortality rates for deaths involving COVID-19, by disability and sex, in those aged 9 to 64 years, England and Wales, 2 March to 15 May 2020
Source: Office for National Statistics – Coronavirus (COVID-19) related deaths by disability status
Notes:
- Office for National Statistics (ONS) figures based on death registrations up to 29 May 2020 that occurred between 2 March and 15 May 2020 that could be linked to the 2011 Census for the coronavirus (COVID-19) rate of death.
- Deaths were defined using the International Classification of Diseases, 10th Revision (ICD-10). Deaths involving COVID-19 include those with an underlying cause, or any mention, of ICD-10 codes U07.1 (COVID-19, virus identified) or U07.2 (COVID-19, virus not identified).
- Age-standardised mortality rates (ASMRs) of COVID-19-related death can be interpreted as deaths per 100,000 population during the period of investigation.
- Non-overlapping error bars denote a statistically significant difference in rates of death.
- Disability status was defined using the self-reported answers to the 2011 Census question: “Are your day-to-day activities limited because of a health problem or disability which has lasted, or is expected to last, at least 12 months? - Include problems related to old age” (Yes, limited a lot; Yes, limited a little; and No).
Download this image Figure 1: Among those aged 9 to 64 years, the relative gaps between those disabled and not disabled were largest
.png (9.1 kB) .xlsx (26.8 kB)
The relative gaps between those disabled and not disabled were largest among those aged 9 to 64 years. Males whose activities were limited a lot in 2011 had a rate of death involving COVID-19 6.5 times greater than those not disabled, while for females it was 11.3 times (Figure 1). Females in this age range had statistically significantly lower rates of deaths across all three disability status categories. The lowest rate was among females aged 9 to 64 years identifying as not disabled, at 4.2 deaths per 100,000.
Figure 2: Among those aged 65 years and over, males and females “limited a lot” in daily activities in 2011 had a higher mortality rate than those who were not disabled
Age-standardised mortality rates for deaths involving COVID-19, by disability and sex, in those aged 65 years and over, England and Wales, 2 March to 15 May 2020

Source: Office for National Statistics – Coronavirus (COVID-19) related deaths by disability status
Notes:
- Office for National Statistics (ONS) figures based on death registrations up to 29 May 2020 that occurred between 2 March and 15 May 2020 that could be linked to the 2011 Census for the coronavirus (COVID-19) rate of death.
- Deaths were defined using the International Classification of Diseases, 10th Revision (ICD-10). Deaths involving COVID-19 include those with an underlying cause, or any mention, of ICD-10 codes U07.1 (COVID-19, virus identified) or U07.2 (COVID-19, virus not identified).
- Age-standardised mortality rates (ASMRs) of COVID-19-related death can be interpreted as deaths per 100,000 population during the period of investigation.
- Non-overlapping error bars denote a statistically significant difference in rates of death.
- Disability status was defined using the self-reported answers to the 2011 Census question: “Are your day-to-day activities limited because of a health problem or disability which has lasted, or is expected to last, at least 12 months? - Include problems related to old age” (Yes, limited a lot; Yes, limited a little; and No).
Download this image Figure 2: Among those aged 65 years and over, males and females “limited a lot” in daily activities in 2011 had a higher mortality rate than those who were not disabled
.png (10.9 kB) .xlsx (27.1 kB)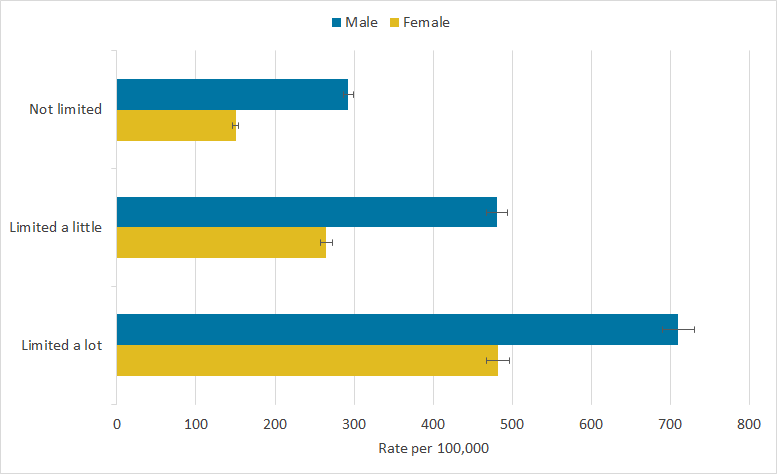
Among those aged 65 years and over, males and females “limited a lot” in daily activities in 2011 had a statistically significant substantially higher mortality rate than those who were not disabled, with rates reducing as the extent of disability reduced (Figure 2). Men whose day-to-day activities were “limited a lot” at the time of the 2011 Census had the highest ASMR, at 710 deaths per 100,000. This is 2.4 times higher than that of non-disabled men. Even within the “limited a lot” category, there was a sizable variation between younger and older ages. For example, men aged 65 years and over were almost 12 times more likely to die than men aged 9 to 64 years, whose mortality rate was significantly lower at 59.8 per 100,000 (figure 1).
Despite this, the ratios of the rates between non-disabled and disabled groups were smaller in the older age group (65 years and over) than the younger (9 to 64 years). Men aged 65 years and over, whose daily activities were “limited a lot”, were 2.4 times more likely and women were 3.2 times more likely to die than their counterparts with no disability. Whereas, in the younger age group, the rate ratio was much higher, with the most disabled men and women being 6.5 and 11.3 times more likely to die than the non-disabled population in that age group.
The female estimates follow the same pattern to that of males; however, across all age and disability groups, females had statistically significantly lower mortality rates than males. The highest female rate was among women aged 65 years and over and who were “limited a lot” at the 2011 Census, at 481.9 deaths per 100,000. This is 3.2 times higher than that of women in the same age group who were not disabled in 2011.
Notes for: Age-standardised mortality rates of death involving COVID-19 by disability status in 2011
- ASMRs enable populations with different age structures to be compared validly. Disability is more common in older populations; therefore, it is necessary to adjust for population structure.
5. Disability status differences in deaths involving COVID-19, adjusted for socio-demographic factors
Differences in the risk of death involving the coronavirus (COVID-19) may be driven by factors related to the risk of being infected, susceptibility to more severe outcomes once infected and ability to survive once infected by the virus. Factors affecting the risk of infection are likely to include geographic location and population density, living arrangements, socio-economic profile and working conditions. Differences in these characteristics, and what they may imply for current circumstances, may also be associated with the risk of death once infected. More information on how these factors vary across disability status in the 2011 Census can be found in the technical appendix. It is important to note that this analysis has been undertaken at the population level and will not relate to all people’s individual circumstance and backgrounds.
We used Cox proportional hazards regression models to estimate whether the risk of death involving COVID-19 is greater among the disabled population than the non-disabled population (as classified at Census Day 2011), after taking into account a number of geographic, demographic, socio-economic, living arrangement and exposure measures derived from the 2011 Census. The statistical models are explained in the technical appendix. It is important to adjust for these factors to enable us to quantify the excess risk specifically associated with disability. The modelling analyses are based on the population enumerated in private households in 2011. Those resident in communal establishments in 2011 were excluded because these enumerations did not contain socio-demographic information used in the modelling.
In Figure 3, we show how the risk of death involving COVID-19 varied by disability status for males and females. We report the hazard ratios for each disability status relative to the non-disabled group, after adjusting for age and for the full range of characteristics described. The hazard ratio is a measure of how much greater or lesser was the rate of death involving COVID-19 in the two disabled groups, those whose day-to-day activity was “limited a little” and “limited a lot”, compared with non-disabled people (no limitation to day-to-day activities) used as the reference group. A hazard ratio greater than one indicates a greater rate of death involving COVID-19 than the reference group, while a hazard ratio less than one indicates a lower rate of COVID-19 mortality than the reference group. In this analysis, using those not disabled as the reference group, hazard ratios greater than one denote an increased risk of death among disabled people.
The risk of death generally, and specifically death involving COVID-19, is closely related to age. After adjusting for age, males and females from both disabled groups were at greater risk of death involving COVID-19 compared with those with no disability. Males whose day-to-day activities were “limited a lot” were 2.5 times more likely to die, while those whose daily activities were “limited a little” were 1.8 times more likely to die, compared with the risk of death involving COVID-19 among those who were not disabled. The corresponding hazard ratios for females were 3.2 and 1.9, respectively.
Figure 3: Hazard ratios of death involving COVID-19 by disability status and sex, England and Wales, 2nd March to 15th May 2020
Embed code
Notes:
- Cox proportional hazards models adjusting for age and the square of age. Fully adjusted models also include region, population density, area deprivation, household composition, socio-economic position, highest qualification held, household tenure, multigenerational household flags and occupation indicators (including key workers and exposure to others) in 2011.
- Office for National Statistics (ONS) figures based on death registrations up to 29 May 2020 that occurred between 2 March and 15 May 2020 that could be linked to the 2011 Census for the coronavirus (COVID-19) rate of death.
- Deaths were defined using the International Classification of Diseases, 10th Revision (ICD -10). Deaths involving COVID-19 include those with an underlying cause, or any mention, of ICD-10 codes U07.1 (COVID-19, virus identified) or U07.2 (COVID-19, virus not identified).
- Risk of death between 2 March and 15 May 2020.
- Hazard ratios are compared to the reference category of no disability.
- Disability status was defined using the self-reported answers to the 2011 Census question: “Are your day-to-day activities limited because of a health problem or disability which has lasted, or is expected to last, at least 12 months? - Include problems related to old age” (Yes, limited a lot; Yes, limited a little; and No).
The fully adjusted model illustrates the results after further adjusting for region, population density, area deprivation, household composition, socio-economic position, highest qualification held, household tenure, multigenerational household and occupation (including key workers and exposure to others) in 2011. Therefore, the fully adjusted results show relative differences in risk between non-disabled and disabled groups that are specific to disability status and are not associated with any of the factors listed by which members of the groups might differ.
Adjusting for these factors substantially reduces the estimated risk of death involving COVID-19 for disabled people relative to the non-disabled group. More information on how the hazard ratios change when adjusting for different sets of characteristics can be found in the technical appendix. After full adjustment, the rate of death involving COVID-19 was still 1.6 and 1.9 times greater for males whose day-to-day activities were “limited a little” or “limited a lot” respectively, compared with those who were not disabled. The corresponding hazard ratios for females were 1.6 and 2.4, respectively.
This means a substantial part of the difference in COVID-19 mortality between disabled and non-disabled groups is explained by the different circumstances in which members of those groups are known to live, such as domains of socio-economic disadvantage. However, these factors do not explain the entirety of the difference, suggesting that other causes are still to be identified.
Individuals from the different disability groups may differ in terms of socio-economic characteristics or health outcomes not included in our model; these differences may relate directly or indirectly to the limitations on activity experienced by disabled people.
Our adjustment for demographic and socio-economic profile has limitations since the characteristics we use were retrieved from the 2011 Census. Therefore, these may not accurately reflect the study population’s current circumstances in 2020. In particular, the disability status of individuals is likely to change over this period, with some people who identified as non-disabled at the time of the 2011 Census moving into disability since then (with the opposite also being possible). The heterogeneity of the “non-disabled group” in 2011 regarding current disability status is likely to underestimate the true difference in risk of dying from COVID-19 between disabled and non-disabled people.
Some disabled people may be more likely to suffer from pre-existing health conditions that are associated with worse outcomes among those infected by COVID-19, which we will aim to take account of in future analyses. The percentage of people in the study population who died prior to March 2020 is also greater for people who identified as disabled in the 2011 Census (21.8% and 39.8% of those whose day-to-day activities are “limited a little” or “limited a lot” respectively) compared with those who identified as non-disabled (2.9%), and it is possible that disabled people who survived until March 2020 have different characteristics to those who died before then.
Back to table of contents6. Glossary
Age-standardised mortality rates
Age-standardised mortality rates (ASMRs) are used to allow comparisons between populations that may contain different proportions of people of different ages. The 2013 European Standard Population is used to standardise rates.
Cox proportional hazards regression model
The Cox proportional hazards regression model is a multiple regression procedure that measures the association between a time-to-event outcome and a characteristic of interest such as disability, while adjusting for other characteristics expected to also be associated with the outcome.
Hazard ratio
A hazard ratio is a measure of the relative differences in the instantaneous rate of mortality between groups. A hazard ratio greater than one indicates the rate of mortality is higher, and likewise less than one lower, in the population group under study compared with a reference group.
Coronaviruses
The World Health Organization (WHO) defines coronaviruses as “a large family of viruses that are known to cause illness ranging from the common cold to more severe diseases such as Middle East Respiratory Syndrome (MERS) and Severe Acute Respiratory Syndrome (SARS)”. Between 2001 and 2018, there were 12 deaths in England and Wales due to a coronavirus infection, with a further 13 deaths mentioning the virus as a contributory factor on the death certificate.
Coronavirus (COVID-19)
COVID-19 refers to the “coronavirus disease 2019” and is a disease that can affect the lungs and airways. It is caused by a type of coronavirus. Further information is available from the WHO.
Disability
To define disability in this publication, we refer to the self-reported answers to the 2011 Census question, “Are your day-to-day activities limited because of a health problem or disability which has lasted, or is expected to last, at least 12 months? - Include problems related to old age” (Yes, limited a lot or yes, limited a little or no). This is slightly different to the current Government Statistical Service (GSS) harmonised "core" definition: this identifies as "disabled" a person who self-reports having a physical or mental health condition or illness that has lasted or is expected to last 12 months or more that reduces their ability to carry-out day-to-day activities.
The GSS definition is designed to reflect the definitions that appear in legal terms in the Disability Discrimination Act 1995 and the subsequent Equality Act 2010.
Back to table of contents