Table of contents
- Main points
- Introduction
- Childlessness definition
- Key figures
- What is cohort fertility?
- Average family size
- Childlessness
- Teenage childbearing
- Number of children
- The changing age pattern of fertility
- Further releases on live births in 2013 in England and Wales published on 4 December 2014:
- Uses of births statistics
- Further information
- Data sources and changes to data
- Background notes
1. Main points
The average completed family size for women born in 1968, and reaching age 45 in 2013, was 1.92 children per woman. This compares with their mothers’ generation, represented by women born in 1941, who had on average 2.34 children
Two children was the most common family size for women born in both 1941 and 1968
The level of childlessness among women born in 1968 (18%) is higher than for women born in 1941 (11%). One in ten women born in 1968 had four or more children, compared with nearly one in five women born in 1941
Women born in 1983 – the most recent cohort to reach age 30 - have had slightly fewer children on average (1.02) by their 30th birthday than women born in 1968 who had 1.15 children by the same age
2. Introduction
This release previously called ‘Cohort Fertility’ has been renamed as “Childbearing for women born in different years” and presents statistics on childbearing among women in England and Wales. These figures are presented by the year of birth of mother – for groups of women born in the same year - rather than by the year of birth of child. The estimates have been updated with 2013 births, the latest data available, which means that completed family size for women born in 1968 (women reaching age 45 in 2013) is presented for the first time. Although the release is now called “Childbearing for women born in different years” we shall be using the word “cohort” at places within the text for simplicity. A cohort in this statistical bulletin is a technical word to describe a group of women born in the same year.
This statistical bulletin provides supporting commentary for the release, which includes data tables on:
Average number of live-born children by age and year of birth of woman, 1920-1998
Proportion of women who have had at least one live birth, by age and year of birth of woman, 1920-1998. The proportion of women who have not had children (see childlessness definition) is also shown in this table
Percentage distribution of women of childbearing age by number of live-born children, by age and year of birth of woman, 1920-1994
Age-specific fertility rates by age and year of birth of woman, 1920-1998
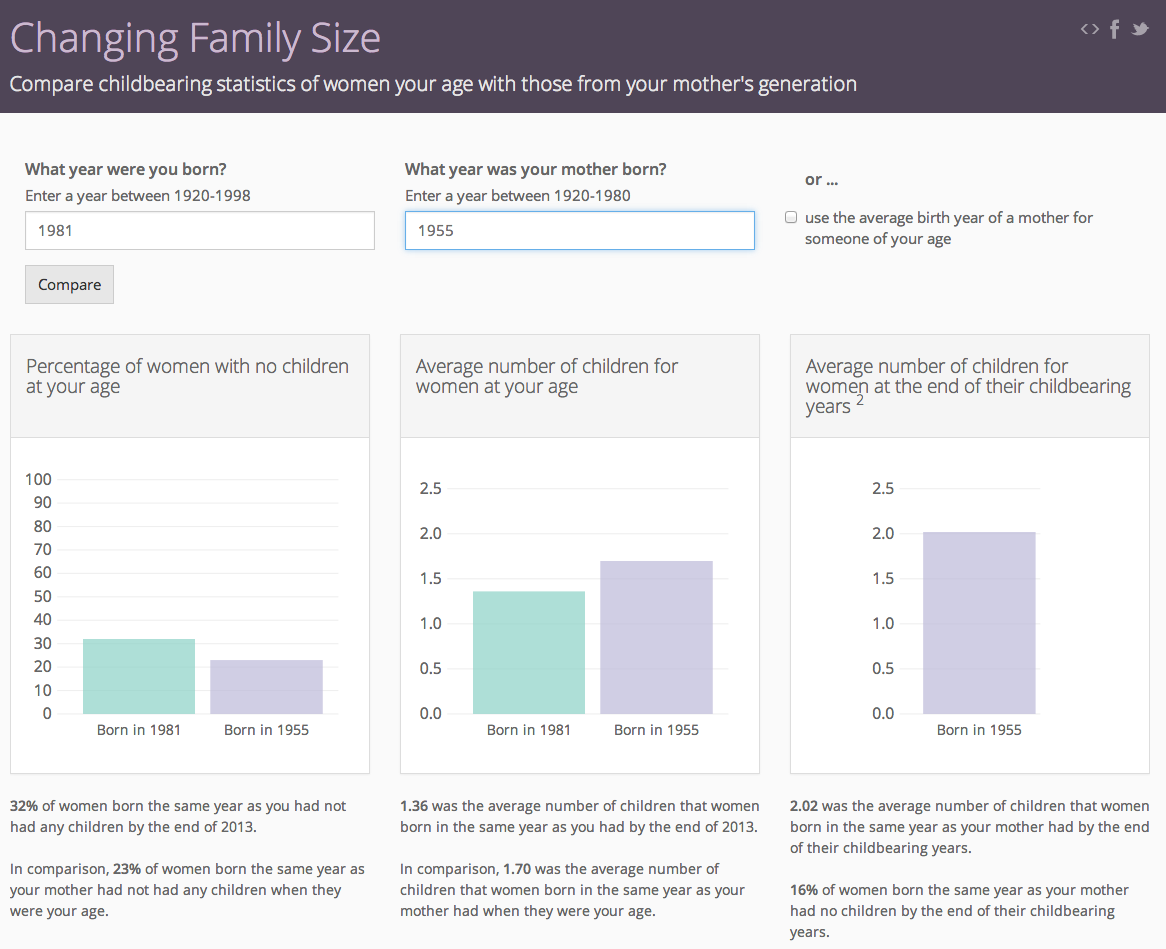
This new interactive web page Changing family size lets you compare childbearing patterns for your cohort, to those of other cohorts to examine how childbearing has changed over time. This is a non-functional reproduction of the page.

The methods used to create these estimates by cohort / birth year of women require the use of data collected from women at birth registration on the number of previous children they have had. At present this information is not collected for men. Without this information it is not possible to produce an estimate of the proportion of men who have not fathered a child.
Even if full information on previous births was collected for men, due to the method used to compile these estimates, there would be a long delay before any comparable statistics could be produced using these cohort methods. In addition approximately 6% of births are registered without information on the father and these births further affect our ability to generate statistics for male fertility.
Male fertility rates for 2013 are published on the same day as this release, and this release includes some methodological details on how we deal with sole registrations.
Back to table of contents3. Childlessness definition
Childlessness is defined as the condition of being without children. There are two distinguishable types of childlessness, voluntary and involuntary. The difference between the two is mostly self-defined. Voluntary childlessness, also described as childfree, child-free, childless by choice or childfree by choice1, relates to women who have chosen not to have children. Involuntary childlessness relates to women who are without a child because of circumstance or biology rather than choice.
The Office for National Statistics publishes data on all childless women, whether by circumstance or by choice. This is in line with the United Nations definition of childlessness2.
Notes for childlessness definition
Back to table of contents4. Key figures
Table A shows the average family size and estimated family size distribution for women who have completed their childbearing years in 2013, and of the cohort assumed to be their mothers. The 1941 cohort is assumed to be their mothers' generation because the average age of mothers giving birth in 1968 was 27 years, and so women of that age were assumed to be born in 1941.
This comparison of the most recent cohort to have finished their childbearing with their mothers' cohort lets us examine change over time. The completed family size of the 1968 cohort is much smaller than for the 1941 cohort, and the proportion of women remaining childless is substantially higher for the 1968 cohort.
Table A: Average family size and estimated family size distribution for women who have completed their childbearing, by year of birth of woman, selected cohorts
| England and Wales | |||||||
| Year of birth of woman2 | Average completed family size | Number of live-born children (%)1 | |||||
| 0 | 1 | 2 | 3 | 4+ | Total3 | ||
| 1941 | 2.34 | 11 | 13 | 37 | 22 | 17 | 100 |
| 1968 | 1.92 | 18 | 17 | 37 | 18 | 10 | 100 |
| Source: Office for National Statistics | |||||||
| Notes: | |||||||
| 1. Percentage of women with 0, 1, 2, 3 or 4+ children who have completed their families | |||||||
| 2. The 1968 cohort is the latest group assumed to have completed their childbearing. The 1941 cohort is assumed to be their mothers' generation because the average age of mothers giving birth in 1968 was 27 years, and women of that age were born in 1941 | |||||||
| 3. Figures may not add exactly due to rounding | |||||||
Download this table Table A: Average family size and estimated family size distribution for women who have completed their childbearing, by year of birth of woman, selected cohorts
.xls (54.8 kB)5. What is cohort fertility?
A cohort is a group of people having experienced during the same period a particular event (birth or marriage, for example). In this bulletin birth is the event considered; therefore the cohort will be called a birth cohort, e.g. the 1983 female birth cohort will refer to all women born during the year 1983 in England and Wales.
Cohort fertility analyses explore whether current generations of women of childbearing age are reaching, exceeding or falling short of the fertility levels of previous generations. This bulletin contains statistics on changes in average family size for past and present cohorts, levels of childlessness for different cohorts of women, and the proportions of women having one, two or more children.
The key cohort presented here is women born in 1968, who were aged 45 in 2013. This is the most recent cohort that is assumed to have completed their childbearing1. This statistical bulletin compares the completed family size of women born in 1968 with that of their mothers’ generation; the average age of mothers giving birth in 1968 was 27 years, and women of that age were assumed to be born in 1941.
Women born in 1983, who have reached age 30 in 2013, are also used as a comparison group, as age 302 may be considered the mid-point of childbearing age which starts from age 15 and to age 45. This bulletin compares the achieved fertility of the 1983 cohort by this age with that of previous cohorts by the same age.
Notes for what is cohort fertility?
- A woman is assumed to have completed her childbearing by the last day she is aged 45, that is by her 46th birthday (exact age 46). Completed fertility includes fertility rates up to and including age 45. See background note 4 for a more technical explanation
- The ages of women are presented in 'exact years'. Therefore figures should be interpreted as the average number of children a woman has had up to that birthday. So childbearing up to exact age 30 includes cumulative fertility through her lifetime up to the day before her 30th birthday. Any childbearing in the 12 months from her 29th birthday onwards will be included in fertility up to exact age 30. See background note 4 for a more technical explanation
6. Average family size
Figure 1 shows the average number of live-born children (completed family size) for women who are assumed to have completed their childbearing. This is a cumulative measure derived from summing the fertility rates of female birth cohorts at each age from 15 to 45 and over. The most recent cohort to complete their childbearing (women born in 1968) had on average 1.92 children, a slight rise from the previous three cohorts (1965-7). Average completed family size peaked at 2.42 children for women born in 1935, and has been falling since. Women belonging to the 1958 cohort were the first estimated to have an average completed family size of fewer than two children over their childbearing lifetime. This decrease in the average family size is mainly due to rising levels of childlessness, which is discussed further in the next section.
Figure 1: Average number of live-born children by age 30 and completed family size, by year of birth of woman
England and Wales

Source: Office for National Statistics
Notes:
- Table 1 in the reference tables and Figure 1 (above) show cumulative fertility. For example, Figure 1 shows that women born in 1983 had given birth to 1.02 children on average by their 30th birthday (this includes fertility up to and including age 29)
- Includes births after 45th birthday, achieved up to the end of 2013 by women born in 1968 and earlier years
Download this image Figure 1: Average number of live-born children by age 30 and completed family size, by year of birth of woman
.png (17.4 kB) .xls (36.4 kB)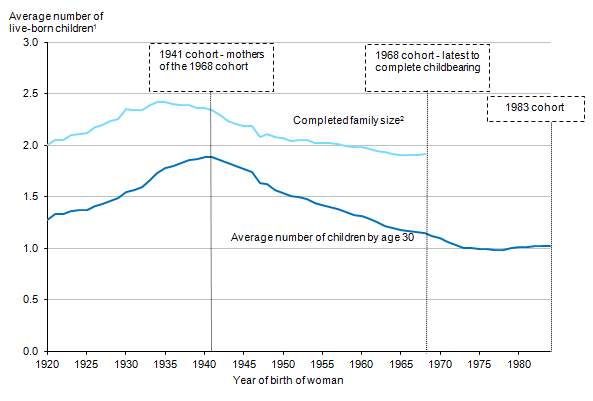
Figure 1 also shows the average number of live-born children for women by their 30th birthday.
The average number of children women have had up to their 30th birthday can give an indication of more recent trends in family size. Figure 1 shows a slight upturn in average family size by the 30th birthday for the most recent cohorts, from 0.99 children for the 1975 cohort to 1.02 for the 1983 cohort. This is mainly because women born in 1983 had higher fertility rates in their late twenties than those born in 1975. There is no single explanation for this increase, but possible reasons include the changes in support for families introduced by the previous government (Such as tax credits and maternity/paternity leave)1 and the increasing proportion of women aged 25-29 who were born outside the UK (with fertility above the UK born average)2.
Overall, women born in the 1960s and 1970s have had fewer children by age 30 than previous generations. The 1968 cohort had 1.15 children on average by their 30th birthday, compared with 1.89 by the same age for their mother’s generation, the 1941 cohort. This reflects their postponement of childbearing to older ages, for reasons including:
increased participation in higher education (see section note 3)
delayed marriage and partnership formation (see section note 1)
the desire to establish a career, get on the housing ladder and ensure financial stability before starting a family (see section note 1)
Notes for average family size
Jefferies, J (2008), Fertility assumptions for the 2006-based national population projections (297 Kb Pdf), Population Trends, no 131, pp 18-27
Zumpe, J, Dormon, O, and Jefferies, J (2012) Childbearing among UK born and non-UK born women living in the UK. Office for National Statistics
Dormon, O (2014) Childbearing of UK and non-UK born women living in the UK, 2011 Census data. Office for National StatisticsNi Bhrolchain, M, Beaujouan, E (2012) Fertility postponement is largely due to rising educational enrolment, Population Studies, Volume 66, issue 3, pp. 311-327
7. Childlessness
Childlessness is estimated as the proportion of women who have not had a live birth by a specific age.
Figure 2: Percentage of women remaining childless by their 30th birthday and completion of childbearing, by year of birth of woman
England and Wales

Source: Office for National Statistics
Notes:
- The percentage of women remaining childless by their 30th birthday or by age 45 is calculated as 1 minus the proportion of women who have had at least one live birth by age, multiplied by 100
- This calculation takes into account all first live births from a woman's teenage years through to the last day she is 29 (the day before her 30th birthday) or the last day she is 45 (the day before her 46th birthday)
Download this image Figure 2: Percentage of women remaining childless by their 30th birthday and completion of childbearing, by year of birth of woman
.png (17.2 kB) .xls (46.1 kB)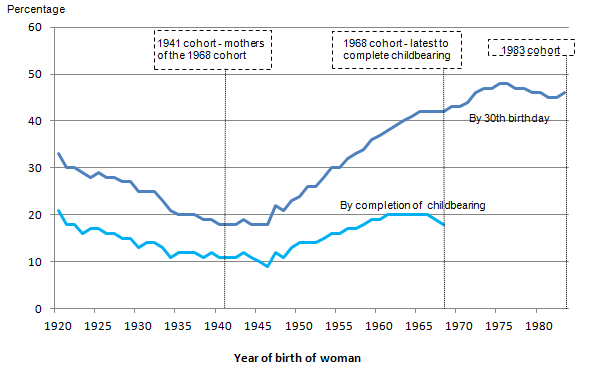
Figure 2 shows that the level of childlessness at age 45 for women born in 1968 is relatively high at 18%, but slightly lower than for the 1967 cohort (19%) and the previous six cohorts, which had 20% childlessness each. Around one in five women born in 1968 remained childless by the end of their childbearing years compared with one in nine women born in 1941. However, late 1960s levels are not new; they are comparable to early 1920s levels. A wide range of explanations relating to circumstances and choices have been put forward for the increasing childlessness seen in recent cohorts. These include the decline in the proportion of women married, changes in the perceived costs and benefits of childrearing versus work and leisure activities, greater social acceptability of the childfree lifestyle and the postponement of decisions about whether to have children until it may be biologically too late1.
On their 30th birthday, 46% of the 1983 cohort were childless, a higher proportion than for the 1968 cohort at the same age (42%). This highlights the trend that women have been increasingly delaying having children to older ages. However, Figure 2 shows that while the proportion of women childless by age 30 increased slightly for women born in 1983, prior to that it had been falling for successive cohorts born from 1975 to 1982 (when 48% of women had not yet had a live birth by age 30). However, it is too early to say whether this new upward trend will continue.
Notes for childlessness
For reasons for increasing childlessness, see for example:
- O'Leary, L, Natamba, E, Jefferies, J and Wilson, B (2010) Fertility and partnership status in the last two decades, Population Trends 140, page 5-35- (95.5 Kb Pdf)
- Simpson, R (2009) Delayed childbearing and childlessness in Britain, in Stillwell, J, Kneale, D and Coast, E (eds.) Fertility, Living Arrangements, Care and Mobility: Understanding Population Trends and Processes Volume 1, Springer, Dordrecht, pp. 23-40
- Kneale, D, Joshi, H (2008) Postponement and childlessness: Evidence from two British cohorts volume 19, article 58, (2008) http://www.demographic-research.org/Volumes/Vol19/58/
- Basten, S (2009). Voluntary childlessness and being Childfree. The Future of Human Reproduction: Working Paper #5
- Berrington, A.M. (2004). Perpetual postponers? Women's, men's and couple's fertility intentions and subsequent fertility behaviour. Population Trends 117: 9-19. (137.7 Kb Pdf)
8. Teenage childbearing
Figure 3: Percentage of women who have had a child by their 20th birthday, by year of birth of woman
England and Wales
Source: Office for National Statistics
Notes:
- This calculation takes into account all first live births from a woman's teenage years through to the last day she is 19 (the day before her 20th birthday)
Download this chart Figure 3: Percentage of women who have had a child by their 20th birthday, by year of birth of woman
Image .csv .xlsConception statistics include all pregnancies of women usually resident in England and Wales which lead to either a live birth, still birth or an abortion under the 1967 Act. The most recent figures on under 18 conception rates for England and Wales show that in 2012 the rate was 27.9 conceptions per thousand women aged 15 to 17, which is the lowest level since records began in 1969 (a decrease of 40.8% since then)1. Teenage conception and birth rates are used widely as outcome indicators in the sexual health context1.
Notes for teenage childbearing
More details on teenage conceptions can be found in the annual ONS conceptions release:
www.ons.gov.uk/ons/rel/vsob1/conception-statistics--england-and-wales/2012/sty-conception-rates.html
www.ons.gov.uk/ons/rel/vsob1/conception-statistics--england-and-+wales/index.html
9. Number of children
Figure 4: Estimated family size distribution for women born between 1920 and 1968 who are assumed to have completed their childbearing
England and Wales
Source: Office for National Statistics
Download this chart Figure 4: Estimated family size distribution for women born between 1920 and 1968 who are assumed to have completed their childbearing
Image .csv .xlsThe traditional two-child family remains the most common family type in England and Wales, with 37% of women born in 1968 having two children (Figure 4, Table B). Families with none or three children are equally second most common at 18% each of the total for the 1968 cohort. The proportion of families with one child has increased over time to 17%, a level last seen for the 1932 cohort.
Table B: Average family size and estimated family size distribution for women who are assumed to have completed their childbearing, by year of birth of woman, 1920 to 1968
| England and Wales | |||||||
| Year of birth of woman | Average Family Size | Number of live-born children (%)1 | |||||
| Childless | 1 | 2 | 3 | 4+ | Total2 | ||
| 1920 | 2.00 | 21 | 21 | 27 | 16 | 15 | 100 |
| 1925 | 2.12 | 17 | 22 | 28 | 17 | 16 | 100 |
| 1930 | 2.35 | 13 | 18 | 30 | 19 | 20 | 100 |
| 1935 | 2.42 | 12 | 15 | 32 | 21 | 20 | 100 |
| 1940 | 2.36 | 11 | 13 | 36 | 22 | 18 | 100 |
| 1945 | 2.19 | 10 | 14 | 43 | 21 | 12 | 100 |
| 1950 | 2.07 | 14 | 13 | 44 | 20 | 10 | 100 |
| 1955 | 2.02 | 16 | 13 | 41 | 19 | 11 | 100 |
| 1960 | 1.98 | 19 | 12 | 38 | 20 | 11 | 100 |
| 1965 | 1.91 | 20 | 13 | 38 | 19 | 10 | 100 |
| 1968 | 1.92 | 18 | 17 | 37 | 18 | 10 | 100 |
| Source: Office for National Statistics | |||||||
| Notes: | |||||||
| 1. Percentage of women with 0, 1, 2, 3 or, 4+ children who have completed their childbearing | |||||||
| 2. Figures may not add exactly due to rounding | |||||||
Download this table Table B: Average family size and estimated family size distribution for women who are assumed to have completed their childbearing, by year of birth of woman, 1920 to 1968
.xls (55.8 kB)Table B shows the family sizes of women who are assumed to have completed their childbearing. The latest cohort to complete their childbearing were those women born in 1968, who were aged 45 in 2013. Of this cohort roughly 18% remained childless. This compares with the 1945 cohort where only approximately 10% of women remained childless.
17% of women completing their childbearing in 2013 had one child, continuing a rise over the last few years from 13% in the 1965 cohort. This is a fairly substantial increase in the proportion of women with one child. One child families were more common among women born in the 1920s and 1930s, where as many as 22% had one child. Of the cohorts of women born in the 1940s, 10 to 14 per cent had one child by the age of 45, slightly lower levels than for women completing childbearing in 2013.
Two children has remained the most popular family size. After peaking around 1950, with 44% of women having two children, it stabilised at 38% for cohorts born through the 1960s before declining slightly to 37% for the 1967 and 1968 cohorts.
A woman born in 1940 was more likely to have one, three or, ‘four or more’ children than not to have any. Only one in ten women born in 1968 had four or more children, compared with nearly one in five in the 1940 cohort (Table B).
Back to table of contents10. The changing age pattern of fertility
The fertility rates of selected cohorts at particular age milestones highlight how the age distribution of women giving birth has changed over time. As an example, the two vertical lines on Figure 5 allow a comparison of the age profile of fertility in the 1968 cohort (who have completed their childbearing), their mothers’ generation (cohort of 1941) and that of the 1983 cohort to date. The fertility rates for women at ages 20, 25, 30, 35 and 40 have been chosen for illustration here (Figure 5), but equally any age or selection of ages could be charted.
Figure 5: Age-specific fertility rates at selected ages, by year of birth of woman, 1935 to 1993
England and Wales

Source: Office for National Statistics
Notes:
- Age-specific fertility rates are a measure of fertility specific to the age of the mother, and are useful for comparing the reproductive behaviour of women at different ages. They are calculated by dividing the number of live births in a year to mothers of each age group by the number of females in the mid-year population of that age. Rates can be expressed per 1,000 women in the age group
Download this image Figure 5: Age-specific fertility rates at selected ages, by year of birth of woman, 1935 to 1993
.png (22.1 kB) .xls (29.7 kB)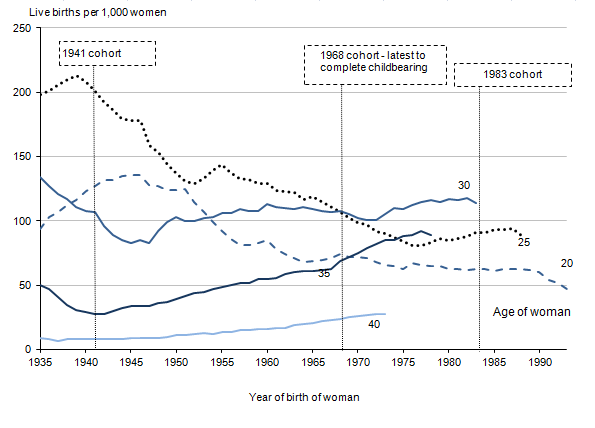
For the 1968 cohort the highest fertility rate of those shown was at the age of 30, closely followed by age 25. Lower levels of fertility were recorded at ages 20 and 35, while the number of live births per 1,000 women at the age of 40 was lower still. On average the 1968 cohort reached 1.92 children per woman. In comparison with the 1941 cohort, the 1968 cohort had much lower fertility at ages 20 and 25, though at age 30 fertility rates were similar. At older ages, the 1968 generation had higher fertility, as shown at ages 35 and 40 (Figure 5). However, this recuperation at older ages was not sufficient to catch up with the larger completed family size of the 1941 cohort who had 2.34 children per woman on average.
Age-specific fertility rates for the 1983 cohort are currently only available up to the age of 30. For this cohort, fertility rates at age 30 were a little higher than for the 1968 cohort but decreased slightly from the level experienced by the 1982 cohort. In contrast, fertility rates at age 20 were slightly lower than seen in the 1968 cohort, while at the age of 25 they were much lower for the 1983 cohort than for the 1968 cohort.
Fertility at age 25 hit a low for women born in 1977 before rising slightly among cohorts born between 1978 and 1987. Women born in 1983 had 15% fewer live births per 1,000 women at age 25 than women born in 1968.
If recent trends in childbearing at older ages continue, the 1983 cohort would be expected to have an older average age at childbearing than the 1968 cohort.
Back to table of contents11. Further releases on live births in 2013 in England and Wales published on 4 December 2014:
Characteristics of Mother 2 – this package presents live birth statistics (numbers and rates) within and outside marriage/civil partnership. It also provides data on first live births by marriage/civil partnership duration, and live births within marriage/civil partnership by age of mother and number of previous live-born children
Further Parental Characteristics – this package presents age-specific fertility rates for men, the average age of fathers, and paternities within and outside marriage/civil partnership. This package also presents data on birth registrations in England and Wales by National Statistics Socio-economic Classification (NS-SEC), where a household level classification is used taking the most advantaged NS-SEC in the household. More detail on this combined approach to NS-SEC can be found on the ONS website. These data were previously published as a separate package “Live Births by Socio-economic Status of Father, England and Wales”
Key findings from these releases
In 2013, 38% of live births were first births, 36% were second births and 16% were third births
The standardised mean age of all fathers at the birth of their child has increased by nearly two years over the last two decades from 31.1 years in 1993 to 32.9 in 2013 (see background notes 6 and 7). The standardised mean age of mother increased by a similar amount over the same period, from 28.0 in 1993 to 30.0 in 2013
For men, the 30-34 age group had the highest fertility rate in 2013 (107.5), the same age group that had the highest fertility rate for women (109.4). Previously, men in their mid-to-late twenties had the highest fertility rate but were overtaken in 1993 by men in their early thirties. The same trend occurred among women a decade later, with the fertility of women in their early thirties overtaking that of women in their mid-to-late twenties in 2004
Babies born within marriage/civil partnership are more likely to have an older father. Nearly two-thirds (62%) of babies born within marriage/civil partnership in 2013 had fathers aged 30-39. For babies born outside marriage/civil partnership 37% had fathers aged 30-39 while 52% had fathers aged under 30
In 2013, households employed in intermediate and routine occupations had a mean age of mother at birth under 30 years while households employed in higher managerial, administrative and professional occupations had a mean age of mother over 30 years
12. Uses of births statistics
The Office for National Statistics uses birth statistics to:
produce mid-year population estimates and population projections, both national and subnational
quality assure census estimates
report on social and demographic trends
Other key users of birth statistics include the Department for Education and the Department of Health, academics, demographers, health researchers, lobby groups, international organisations and the media.
Cohort fertility statistics and estimates of fertility by family size are used by ONS for producing the fertility component of population projections and for reporting on social and demographic trends. They are also of key interest to academics researching changing family building patterns over time.
The Department for Work and Pensions uses information on family size for modelling future lone parents, pensions and benefits.
Estimates of childlessness are of interest to policymakers concerned with the support and care available to people at older ages. Estimates of family size are of use to special interest groups such as organisations and networks supporting large families and for people who are, or who have, an only child.
Back to table of contents