Table of contents
- Main points
- Statistician’s comment
- Things you need to know about this release
- More people are aged 90 and over than ever, but they are still a small proportion of the population
- Centenarians are increasing fastest, but their numbers are still relatively small
- The oldest old are getting older
- Growth of the 90 and over population
- History may repeat itself
- More women than men aged 90 and over, but growth is faster for men
- All UK countries are ageing, but some faster than others
- Links to related statistics
- Quality and methodology
- Methodology
1. Main points
- The population aged 90 and over has grown more rapidly than most younger ages in recent years but it remains a small part of the total UK population
- Historical birth patterns which resulted in rapid ageing and growth of the population aged 90 and over in recent years have now largely played out, and ageing and growth have returned to a longer-term average
- The proportion of men in the population aged 90 and over continues to rise
- An estimated 14,910 people were aged 100 and over (centenarians) in the UK in 2016, or 2 for every 10,000 people; this is a rise from 14,520 in 2015
2. Statistician’s comment
“The population aged 90 and over grew rapidly in recent years, but this was largely driven by people who were born during the post World War 1 baby boom reaching age 90 and progressing through the oldest ages, causing both population growth and ageing within this age group. As these people have now largely progressed through the oldest population, growth and ageing of the 90 and over population have slowed. Despite the growth in this population, people aged 90 and over still make up less than 1% of the total UK population”
Ngaire Coombs, Demographic Analysis Unit, Office for National Statistics
Back to table of contents3. Things you need to know about this release
These are annual mid-year estimates by sex and single year of age for people aged 90 to 104 and for the 105 and over age group. Figures for 2002 to 2015 update the figures previously published in September 2016 for England, Wales and for the UK. Corresponding estimates for Scotland and for Northern Ireland for 2002 to 2016 are also published today by National Records of Scotland (NRS) and the Northern Ireland Statistics and Research Agency (NISRA) respectively.
To provide users with a consistent set of estimates by single year of age up to age 105 and over, the Estimates of the very old (including centenarians) series is constrained to the age 90 and over totals in the mid-year population estimates.
Back to table of contents4. More people are aged 90 and over than ever, but they are still a small proportion of the population
There were 571,245 people aged 90 and over living in the UK in 2016. This was the highest estimate ever. Figure 1 shows the population has been rising continuously for the last few decades, with the only exception in 2008. The dip in the population aged 90 and over in 2008 reflects low birth numbers 90 years previously, during World War 1, followed by higher numbers of births immediately after the war (see Figure 4 for more details).
Figure 1: People aged 90 and over
UK, 1986 to 2016
Source: Office for National Statistics, National Records of Scotland, Northern Ireland Statistics and Research Agency
Download this chart Figure 1: People aged 90 and over
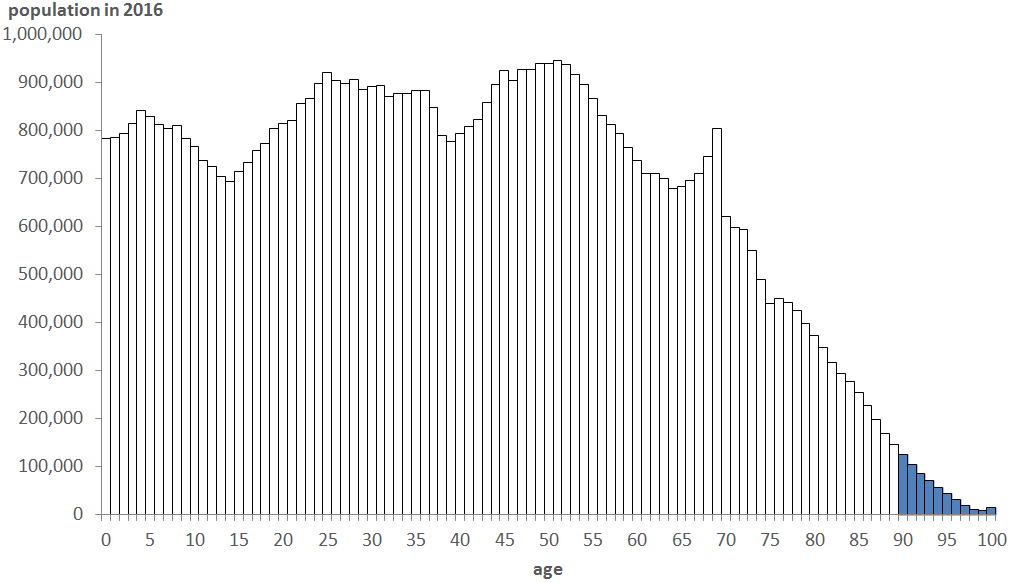
Image .csv .xlsStill, the population aged 90 and over is a very small part of the population. Figure 2 shows the number of people in the UK for every year of age, in 2016. The shaded tail on the right-hand side represent ages 90 and over. Together they make up less than 1 in 100 of the total population.
Figure 2: UK population age structure in 2016
UK
Source: Office for National Statistics, National Records of Scotland, Northern Ireland Statistics and Research Agency
Download this image Figure 2: UK population age structure in 2016
.png (29.7 kB) .xlsx (12.9 kB)
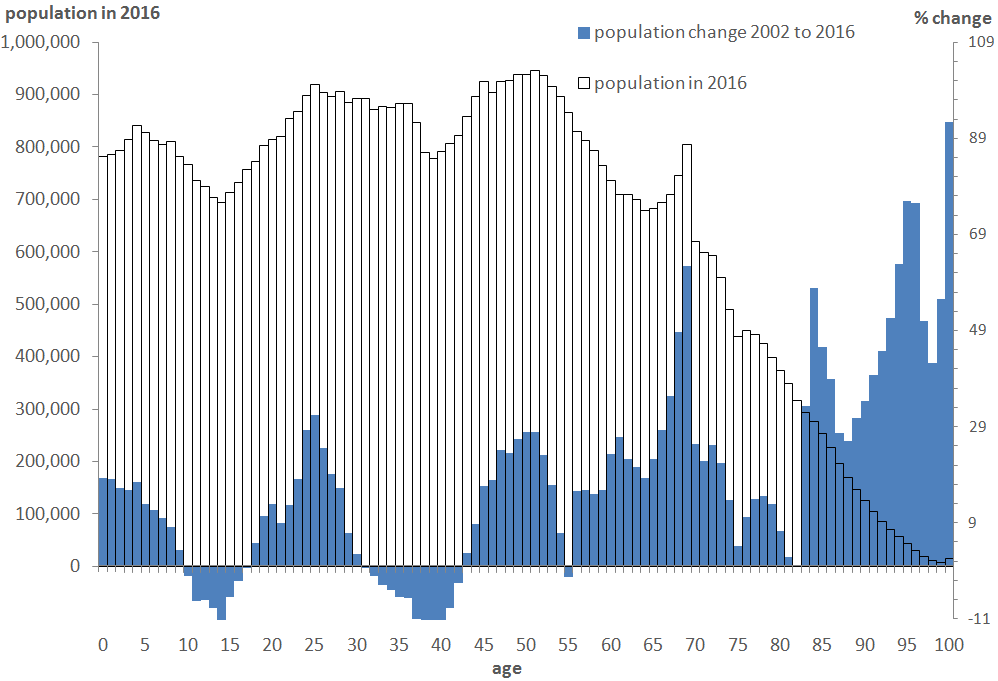
However, the population aged 90 and over has been growing more quickly than most younger ages.
Figure 3 overlays the previous figure with population growth at different ages between 2002 and 2016.1 In general, older ages have grown faster than younger ages resulting in an older overall population age structure.
Figure 3: UK population age structure in 2016, and percentage change between 2002 and 2016
UK
Source: Office for National Statistics, National Records of Scotland, Northern Ireland Statistics and Research Agency
Download this image Figure 3: UK population age structure in 2016, and percentage change between 2002 and 2016
.png (24.4 kB) .xlsx (14.1 kB)
The main driver of population ageing in recent decades has been improving mortality at all ages, but particularly at older ages. Improvements in survival to older ages are due to a combination of factors such as improved medical treatments, housing and living standards, nutrition, and changes in the population’s smoking habits. However, improvements in life expectancy in the UK have slowed in recent years (for more information see the National life tables, UK: 2014 to 2016 statistical bulletin).
Notes for: More people are aged 90 and over than ever, but they are still a small proportion of the population
- Care should be taken when interpreting percentage changes in small populations.
5. Centenarians are increasing fastest, but their numbers are still relatively small
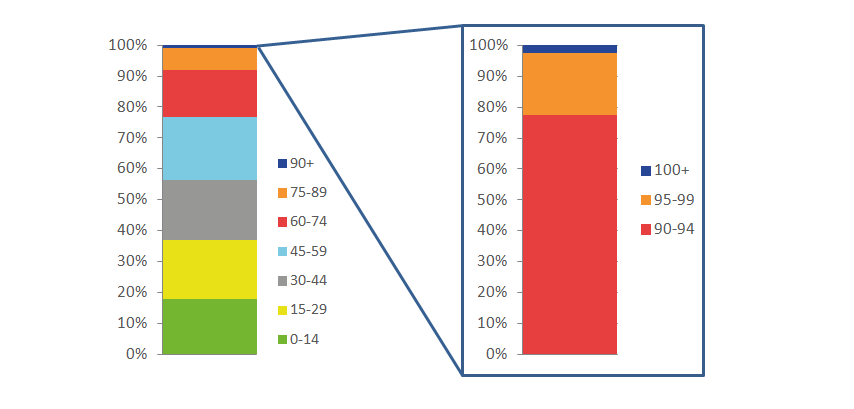
Figure 4: Population age structure at all ages, and at ages 90 and over
UK, 2016
Source: Office for National Statistics, National Records of Scotland, Northern Ireland Statistics and Research Agency
Download this image Figure 4: Population age structure at all ages, and at ages 90 and over
.png (18.4 kB) .xlsx (10.6 kB)
Figure 4 shows that, in 2016, almost four in five of the population aged 90 and over living in the UK (77.6%) were aged under 95; while 19.8% were aged between 95 and 99 and 2.6% were centenarians (those aged 100 and over).
Centenarians make up a very small proportion of the total UK population (0.02% in 2016), but their numbers have grown rapidly. Figure 3 shows centenarian numbers increased at a faster rate than any other age group over the period 2002 to 2016 with numbers almost doubling from 7,750 to 14,910 over the period. In fact, over the past 30 years numbers have more than quadrupled from 3,642 centenarians in 1986.
Most centenarians are women with five female centenarians for every male centenarian in 2016.
Back to table of contents6. The oldest old are getting older
Figure 5 shows the proportions of the 90 and over population by single year of age over the period 2002 to 2016. Proportions decrease with age; in other words, in every year there are higher proportions of 90-year-olds than 91-year-olds, and higher proportions of 91-year-olds than 92-year-olds and so on.
The youngest ages, 90 to 92, make up over half of the 90 and over population over the entire period. But we also see that in 2016 compared with 2002, these younger ages make up a little less of the 90 and over population, and the older ages a little more. In other words, the population aged 90 and over has become older.
The distinctive wave-like pattern reflects birth patterns around World War 1 (1914 to 1918). There were unusually few people born during the war and relatively more people born immediately afterwards. People born during 1914, the first year of the war, who survived to age 90 entered the population aged 90 and over in 2004. The smaller number of wartime births decreased the proportion of those aged 90 in the population (between 2004 and 2008), and then the post-war increase in births boosted the proportion aged 90, before it again decreased. The same pattern can be observed in the other ages in turn.
As a result, the structure of the 90 and over population firstly became older, then younger, and then older again in quick succession. As the population moved from being younger to older again, rapid ageing occurred.
A detailed analysis can be found in the report The impact of the First World War on the 90 and over population of the UK.
So although the 90 and over population is gradually becoming older over time, recent structural changes and rapid ageing were largely due to historical birth patterns. These effects have now largely played out and the ageing of the 90 and over population has slowed.
Figure 5: People aged 90 to 99 as a percentage of all people aged 90 and over
UK, 2002 to 2016

Source: Office for National Statistics, National Records of Scotland, Northern Ireland Statistics and Research Agency
Notes:
- The years of birth are approximate. For instance a person aged 90 in 2010 could have been born in 1919 or 1920; for simplicity, however, such persons are regarded as having been born in 1920.
- Population estimates are mid-year; total births are for calendar years.
Download this image Figure 5: People aged 90 to 99 as a percentage of all people aged 90 and over
.png (29.0 kB) .xlsx (11.5 kB)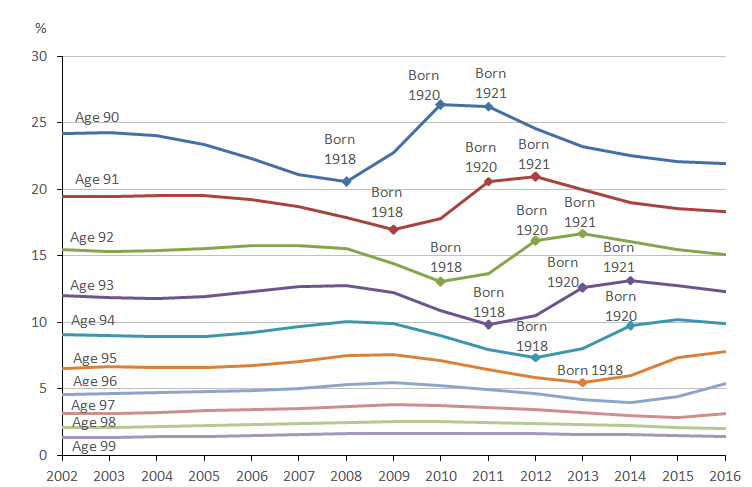
7. Growth of the 90 and over population
The population aged 90 and over may not grow as quickly as it has in the recent past. Figure 6 illustrates this point. While it looks similar to Figure 5, Figure 6 shows estimates of the oldest population by single age years rather than proportions.
At every age the number of people decline as the World War 1 birth years enter the population, and then grow strongly as those born in the large post-war boom enter the population, before growth stabilises.
So while the total population aged 90 and over grew rapidly over recent years, much of this growth seems to derive from the post World War 1 peak birth years. This effect has now largely played out.
In summary, both the population structure and the speed of population growth of those aged 90 and over may be returning to a longer-time average.
Figure 6: Number of people aged 90 to 99
UK, 2002 to 2016

Source: Office for National Statistics, National Records of Scotland, Northern Ireland Statistics and Research Agency
Download this image Figure 6: Number of people aged 90 to 99
.png (32.4 kB) .xlsx (22.5 kB)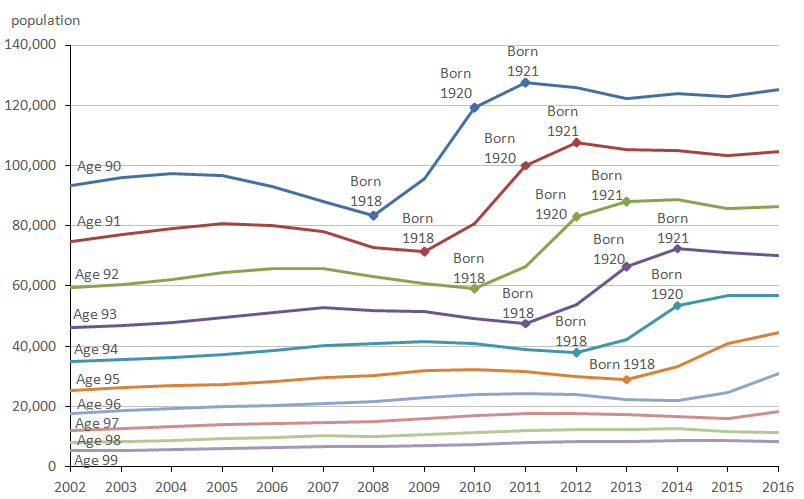
8. History may repeat itself
The World War 1 birth patterns described in the previous section are also apparent in the population pyramid shown in Figure 7. The large pyramid on the left displays the population structure from age 60 in both 2002 and 2016, and the inset pyramid on the right zooms in on ages 90 and over.
There is a tapering at ages 83 and 84 in 2002, reflecting low birth numbers at the end of World War 1, followed by relatively large groups of people aged 80 and 81 born in the post World War 1 baby boom. After the post-war peak in births the number of people born each year reduced to below World War 1 levels. This is illustrated in another article, Trends in births and deaths over the last century. These birth patterns, however, are not apparent in the population pyramid. This could possibly be explained by medical and public health advances following World War 1 resulting in a larger proportion of people born in these smaller birth years surviving to older ages.
Looking further ahead, the population pyramid also shows the population that will feed into the oldest old in the future. There was also an increase in births after World War 2; people aged around 70 years old in 2016. When these people enter the 90 and over population in 20 years time they will have a similar effect as people born immediately after World War 1.
Figure 7: Population pyramid, ages 60 and over
UK, 2002 and 2016

Source: Office for National Statistics, National Records of Scotland, Northern Ireland Statistics and Research Agency
Download this image Figure 7: Population pyramid, ages 60 and over
.png (54.9 kB) .xlsx (25.0 kB)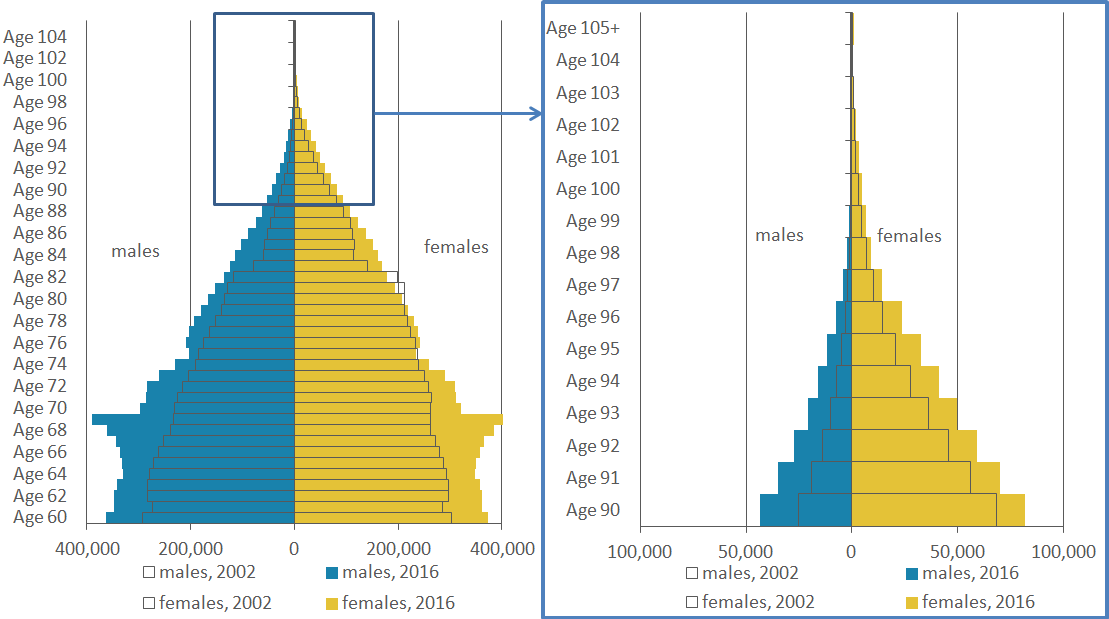
9. More women than men aged 90 and over, but growth is faster for men
Figure 7 also shows population growth and ageing by sex. The inlay shows that at all ages 90 and over there are more women than men, reflecting women’s higher life expectancy, and this is increasingly so at higher ages. However, relative to their smaller population, the number of men has grown faster than the number of women at all ages. For example, for every 100 men aged 90 in 2002 there were 73 more in 2016, compared with an additional 20 women for every 100 women aged 90 in 2002.
While women outnumber men at all 90 and over ages, the difference has narrowed. Figure 8 shows the number of women for every man by age group over the period 2002 to 2016. For all age groups the ratio of women to men has decreased and the decrease is more marked with age. In 2002 there were three women aged 90 to 94 for every man of that age, five women aged 95 to 99 and eight women aged 100 to 104. By 2016 these figures had fallen to two, three and five respectively. At age 105 and over, while there were still eight women for every man, this was three fewer than in 2002. Still, in every age group there are at least twice as many women as men.
Figure 8: Number of women per man, selected age groups
UK, 2002 to 2016
Source: Office for National Statistics, National Records of Scotland, Northern Ireland Statistics and Research Agency
Download this chart Figure 8: Number of women per man, selected age groups
Image .csv .xls10. All UK countries are ageing, but some faster than others
In 2016, Wales had the highest proportion of those aged 90 and over in the population at 951 per 100,000, followed by England at 883, Scotland at 760, and Northern Ireland with the lowest at 684 (Figure 9).
The proportion of the population aged 90 and over increased in every UK country between 1986 and 2016, but there were differences in the speed of increase. Northern Ireland had the slowest growth and Wales had the fastest. As a result, there are now far bigger differences between UK countries in the proportion of the oldest population. In 1986, the gap between the UK country with the most people aged 90 and over and the country with the fewest was only 77 per 100,000 (365 in England compared with 288 in Northern Ireland). By 2016 this gap had increased to 267 per 100,000 (951 in Wales compared with 684 in Northern Ireland).
Figure 9: Number of people aged 90 and over per 100,000 population, by country
UK countries, 1986 to 2016
Source: Office for National Statistics, National Records of Scotland, Northern Ireland Statistics and Research Agency
Download this chart Figure 9: Number of people aged 90 and over per 100,000 population, by country
Image .csv .xls12. Quality and methodology
In 2011 the estimates were assessed by the UK Statistics Authority and have since been published as National Statistics. The estimates were re-assessed in 2016 and their National Statistics status was retained.
Estimates for the UK, England and for Wales are produced by Office for National Statistics (ONS) while estimates for Scotland and Northern Ireland are produced by the National Records of Scotland (NRS) and the Northern Ireland Statistics and Research Agency (NISRA) respectively. Although the estimates for each country are produced using a comparable methodology, a comparison paper has been published to explain any differences.
The Population estimates of the very old (including centenarians) Quality and Methodology Information report contains important information on:
- the strengths and limitations of the data and how it compares with related data
- uses and users of the data
- how the output was created
- the quality of the output including the accuracy of the data
We have published a review of the methodology for producing Estimates of the very old.
Back to table of contentsContact details for this Statistical bulletin
You might also be interested in:
- The impact of the First World War on the 90 and over population of the UK: 2015
- Accuracy of official high-age population estimates, in England and Wales: an evaluation
- Trends in births and deaths over the last century
- How has life expectancy changed over time?
- Estimates of the Very Old (including Centenarians) - QMI
- Comparison paper: 90 and over single year of age and sex population estimates produced by ONS, NRS and NISRA