1. Main points
Net long-term international migration = +330,000 (up 94,000 from YE March 2014), in the year ending (YE) March 2015
Immigration = 636,000 (up 84,000), in the year ending (YE) March 2015
Emigration = 307,000 (down 9,000), in the year ending (YE) March 2015
The net migration figure was a statistically significant increase from 236,000 in YE March 2014 and is the highest net migration on record
Net migration of EU citizens showed a statistically significant increase to 183,000 (up 53,000 from YE March 2014). The increase in non-EU net migration to 196,000 (up 39,000) was also statistically significant and is a result of an increase in immigration (not statistically significant) and a decrease in emigration (statistically significant)
The increase in long-term international immigration included a statistically significant increase for EU citizens to 269,000 (up 56,000), the highest recorded level for this group; and an increase for non-EU nationals to 284,000 (up 23,000) (not statistically significant)
53,000 Romanian and Bulgarian (EU2) citizens immigrated to the UK in YE March 2015, a statistically significant increase and almost double the 28,000 in the previous 12 months
290,000 people immigrated for work in YE March 2015, a statistically significant increase of 65,000 from 225,000 in YE March 2014 continuing the upward trend
There were statistically significant increases of immigration for work for both EU citizens (from 134,000 to 162,000 in YE March 2015) and non-EU citizens (from 48,000 to 64,000). The increase for British citizens was not statistically significant. Of the 53,000 - -- EU2 citizens immigrating to the UK, 42,000 were coming for work, a statistically significant increase of 20,000
61% of EU citizens immigrating for work had a definite job to go to, whereas 39% were intending to look for a job rather than taking up an offer of employment
Latest employment statistics show estimated employment of EU nationals (excluding British) living in the UK was 250,000 higher in April to June 2015 compared with the same quarter last year and non-EU nationals in employment increased by 7,000. Over the same period, British nationals in employment also increased (by 84,000), therefore three-quarters of the growth in employment over the last year was accounted for by foreign nationals. (These growth figures represent the net change in the number of people in employment, not the proportion of new jobs that have been filled by non-UK workers.)
In YE June 2015, work-related visas granted (main applicants) rose by 8,862 (or 8%) to 121,964, including a 5,177 (11%) increase for skilled work (Tier 2) visas
Long-term immigration for study increased from 176,000 to 188,000 in YE March 2015 (not statistically significant). Over the same period, visa applications to study at a UK university (main applicants) rose to 166,481
There were 25,771 asylum applications (main applicants) in YE June 2015, an increase of 10% compared with the previous 12 months (23,515). The number of applications remains low relative to the peak number of applications in 2002 (84,132)
The largest number of applications for asylum came from nationals of Eritrea (3,568), followed by Pakistan (2,302) and Syria (2,204). A total of 11,600 people were granted asylum or an alternative form of protection
2. About the MSQR
If you are new to migration statistics, you might find it helpful to read our international migration statistics first time user guide.
The Migration Statistics Quarterly Report (MSQR) is a summary of the latest quarterly release of official international migration statistics. This edition covers those released on 27 August 2015 and includes links to other migration products released on that date. The latest ONS estimates refer to the year ending March 2015, though other estimates’ periods may differ as stated. A summary version of this report is available on our website. The MSQR series brings together statistics on migration published by the Office for National Statistics (ONS), the Home Office and the Department for Work and Pensions (DWP).
ONS migration statistics use the UN recommended definition of a long-term international migrant: “A person who moves to a country other than that of his or her usual residence for a period of at least a year (12 months), so that the country of destination effectively becomes his or her new country of usual residence.” Figures relating to visas are produced by the Home Office and include long-term and short-term migrants and their dependants; The Department for Work and Pensions National Insurance number allocations to adult overseas nationals also include long-term and short-term migrants. The estimates in the MSQR do not identify illegal migrants.
Long-Term International Migration (LTIM) estimates are mainly based on data from the International Passenger Survey (IPS), with adjustments made for asylum seekers, non-asylum enforced removals, visitor and migrant switchers and flows to and from Northern Ireland. This report uses LTIM estimates where available. However, for some categorisations it is not possible to estimate the full LTIM statistic. In such cases IPS statistics are presented. In these cases the IPS totals will not match LTIM totals, but will give a good measure of magnitude and direction of change.
There is considerable interest in migration statistics both nationally and internationally, and they are a fundamental component of our mid-year population estimates. These are used for planning and service delivery, resource allocation and managing the economy. Additionally, migration statistics are used to monitor progress against a government-stated ambition of delivering annual net migration in the tens of thousands, not the hundreds of thousands1.
For further information on how our migration statistics are used, along with information on their fitness for purpose, please see the quality and methodology information for long-term international migration (LTIM) releases and the accuracy of migration estimates section.
New for this release:
As part of ongoing work to improve our bulletins, we have made some changes to the MSQR to improve readability and make it more accessible. Expert users will continue to be able to delve into the data for themselves through the Excel tables. Some of the charts presented in this document have been updated accordingly and text commentary has been reduced where charts or table downloads present the data more readily. The colours in several charts have now been updated to be colour-blind accessible and greyscale compliant.
The Local Area Migration Indicators (LAMI) Suite is published alongside this release, presenting indicators of migration at local authority level. This annual output has been updated with the latest available estimates. Further improvements to this product include the unrounding of population and internal and international migration estimates as well as the addition of data on births to non-UK born mothers. The MSQR does not provide commentary on the LAMI. An interactive quiz providing an introduction to the LAMI and data on population by country of birth will be released by ONS on 28th August 2015 to supplement the LAMI Suite. The quiz will be available on the ONS Visual website.
Two reports accompany this quarter’s MSQR, on population by country of birth that is, the resident population of the UK including non UK-born and non-British nationals, based on the Annual Population Survey (see Glossary). One report covers the latest year of data, and the other looks at the effect of reweighting the survey data following the 2011 Census.
Estimates from the IPS for 2014 are now finalised, therefore for 2014 the final IPS data have been used to produce LTIM and the IPS tables. However, LTIM 2014 estimates remain provisional for this release due to the other components used in LTIM remaining provisional until the November 2015 publication. Comparisons between these figures and any from previous releases may show differences as a result of the finalisation of the IPS component of the estimates.
Throughout the report, all changes referred to are from the year ending March 2014 to the year ending March 2015, unless otherwise stated.
Notes for about MSQR
- Conservative Manifesto 2015 – for immigration see page 29.
3. Net migration to the UK
Net migration is the difference between immigration and emigration.
- The net migration estimate for the year ending (YE) March 2015 is 330,000 and has a 95% confidence interval of +/-42,000, a statistically significant increase from the estimate of 236,000 (+/-37,000) in YE March 2014 and higher than the previous peak of 320,000 in YE June 2005 (From here on, any reference to change, such as increase or decrease, refers to YE March 2015 compared with YE March 2014, unless otherwise stated.)
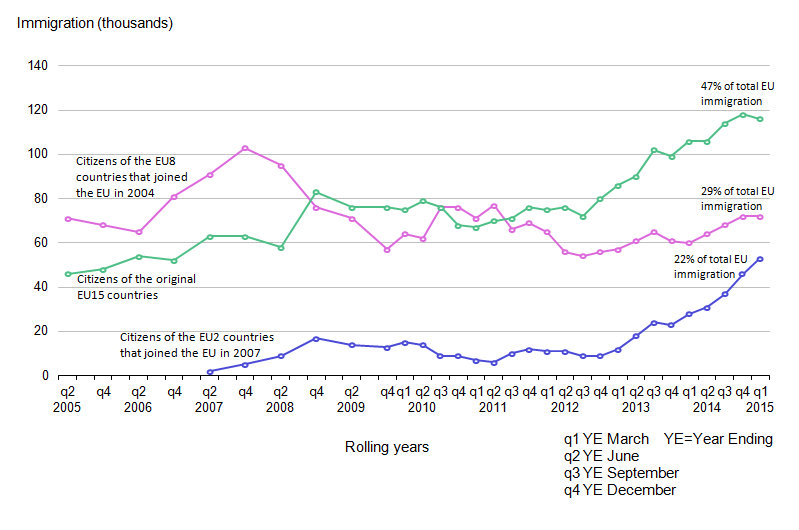
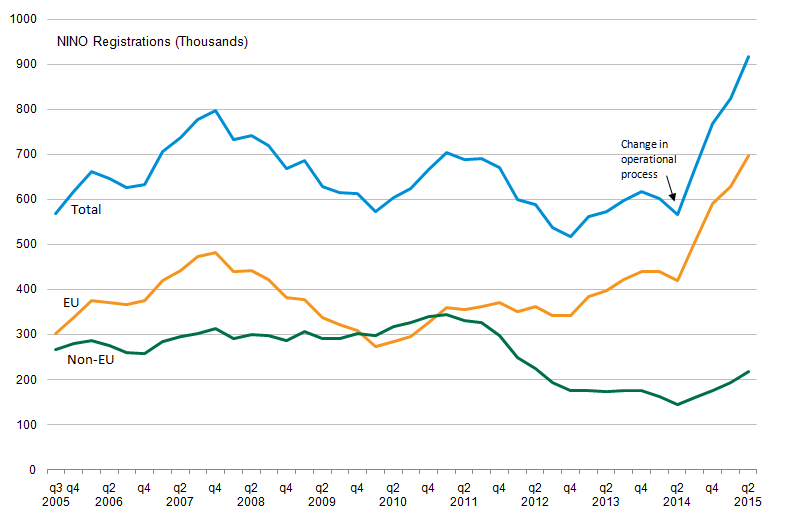
This continues the generally increasing trend in net migration since the recent low of 154,000 in YE September 2012. Figure 1 shows rolling annual estimates from YE June 2005 onwards illustrating that the provisional net migration estimate is higher than the emigration estimate for the first time, a result of immigration being more than twice as high as emigration.
Figure 1: Long-Term International Migration
United Kingdom, 2005 to 2015 (YE March 2015)

Source: Office for National Statistics
Notes:
- Figures for years ending in 2014 and 2015 are provisional. In this chart provisional estimates are represented by a cross.
- Net migration estimates up to 2011 have been revised in light of the 2011 Census. Immigration and emigration estimates have not been revised and are therefore not consistent with the revised net migration estimates. The revised estimates are only available for the years ending June and December each year.
Download this image Figure 1: Long-Term International Migration
.png (24.0 kB) .xls (31.7 kB)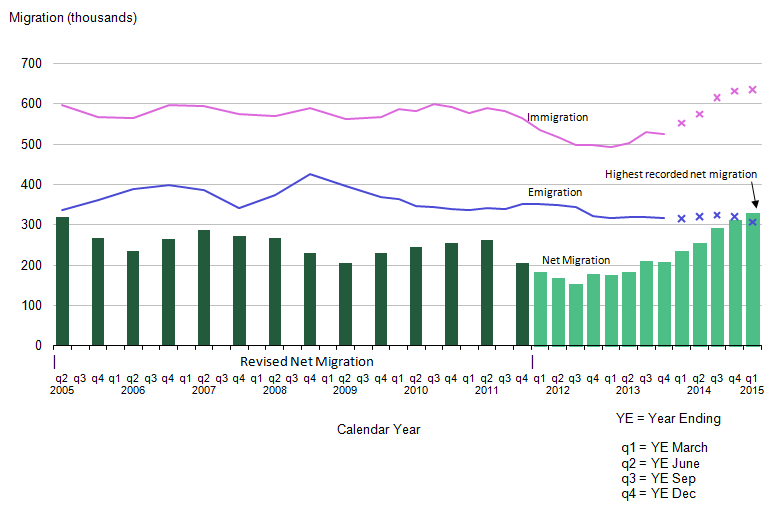
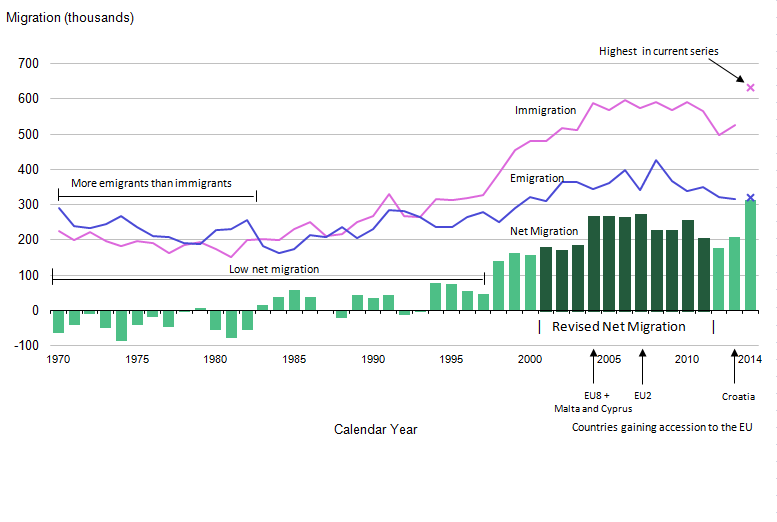
Figure 2: Long-Term International Migration
United Kingdom, 1970 to 2014 (annual totals)
Source: Long-term International Migration, International Passenger Survey (IPS) - Office for National Statistics
Notes:
- Net migration estimates for the period 2001 to 2011 have been revised in light of the 2011 Census. Immigration and emigration estimates have not been revised and are therefore not consistent with the revised net migration estimates.
- Figures for 2014 are provisional and are represented by a cross. All other figures are final calendar year estimates of LTIM.
- Data pre-1991 are IPS data only. LTIM data are shown from 1991 onwards.
- Although Malta and Cyprus also acceded in 2004, they are not included in the EU8.
Download this image Figure 2: Long-Term International Migration
.png (26.9 kB) .xls (32.3 kB)
An interactive version of Figure 2 up to 2013 with additional commentary is available on the Neighbourhood Statistics website.
Table 1 shows the headline figures for YE March 2014 and YE March 2015 with their corresponding confidence intervals. Statistically significant changes are denoted with an asterisk
Table 1: Latest changes in migration, YE March 2014 and YE March 2015
| United Kingdom | |||||
| Thousands | |||||
| YE Mar 2014 | 95% CI | YE Mar 2015 | 95% CI | Difference | |
| Net migration | 236 | +/-37 | 330 | +/-42 | 94* |
| Immigration | 552 | +/-31 | 636 | +/-37 | 84* |
| Emigration | 316 | +/-20 | 307 | +/-21 | -9 |
| Source: Office for National Statistics | |||||
| Notes: | |||||
| 1. Figures are rounded to the nearest thousand. | |||||
| 2. Further information on confidence intervals can be found in the MSQR Information for Users. | |||||
| 3. The difference has been calculated by subtracting the YE Mar 2014 estimate from the YE Mar 2015 estimate. Where the confidence interval for the difference does not contain zero, we can say that the difference is statistically significant. This means that the difference is likely to reflect a real change in migration flows. There are statistically significant differences for immigration and net migration but not for emigration. | |||||
| 4. YE = Year Ending. | |||||
| 5. CI = Confidence Interval. | |||||
| 6. Statistically significant change at the 5% level is indicated by an asterisk. | |||||
Download this table Table 1: Latest changes in migration, YE March 2014 and YE March 2015
.xls (28.2 kB)The most recent increase in net migration has been driven by higher levels of immigration (the highest in the series) coupled with a small non-statistically significant decrease in emigration.
In December 2013, in collaboration with the Home Office, ONS published a report on the history of immigration to the UK based on the 2011 Census, which provides further evidence of the drivers behind historical migration to the UK.
Table 2 illustrates EU and non-EU citizens (please see EU section in the glossry) net migration for YE March 2014 and YE March 2015 with their corresponding confidence intervals. Statistically significant changes are denoted with an asterisk.
The majority of the change in net migration over the past year was due to EU citizens.
Table 2: Latest changes in EU and non-EU citizens net migration, YE March 2014 and YE March 2015
| United Kingdom | |||||
| Thousands | |||||
| YE Mar 2014 | 95% CI | YE Mar 2015 | 95% CI | Difference | |
| British | -51 | +/-16 | -49 | +/-19 | 2 |
| EU | 130 | +/-26 | 183 | +/-28 | 53* |
| EU15 | 62 | +/-19 | 78 | +/-19 | 16 |
| EU8 | 40 | +/-14 | 50 | +/-17 | 10 |
| EU2 | : | : | : | : | : |
| Non-EU | 157 | +/-20 | 196 | +/-25 | 39* |
| Source: Office for National Statistics | |||||
| Notes: | |||||
| 1. Figures are rounded to the nearest thousand. | |||||
| 2. Further information on confidence intervals can be found in the MSQR Information for Users. | |||||
| 3. The difference has been calculated by subtracting the YE Mar 2014 estimate from the YE Mar 2015 estimate. Where the confidence interval for the difference does not contain zero, we can say that the difference is statistically significant. This means that the difference is likely to reflect a real change in migration flows. There are statistically significant differences for immigration and net migration but not for emigration. | |||||
| 4. YE = Year Ending. | |||||
| 5. CI = Confidence Interval. | |||||
| 6. Statistically significant change at the 5% level is indicated by an asterisk. | |||||
Download this table Table 2: Latest changes in EU and non-EU citizens net migration, YE March 2014 and YE March 2015
.xls (28.7 kB)
Figure 3: Long-Term International net migration by citizenship
United Kingdom, 1975 to 2015 (year ending March 2015)

Source: Long-term International Migration - Office for National Statistics
Notes:
- Figures for 2014 and 2015 are provisional and quarterly. All other figures are final calendar year estimates of LTIM. Provisional rolling quarterly estimates are represented in this chart by a cross.
- This chart is not consistent with the total revised net migration estimates as shown in Figures 1 and 2. This also means that estimates for the period 2001 to 2011 are not fully comparable with those for later periods.
- Note that the data for 2014 and 2015 reflect quarterly year ending data whereas before 2014 the data are calendar year data.
Download this image Figure 3: Long-Term International net migration by citizenship
.png (30.4 kB) .xls (32.3 kB)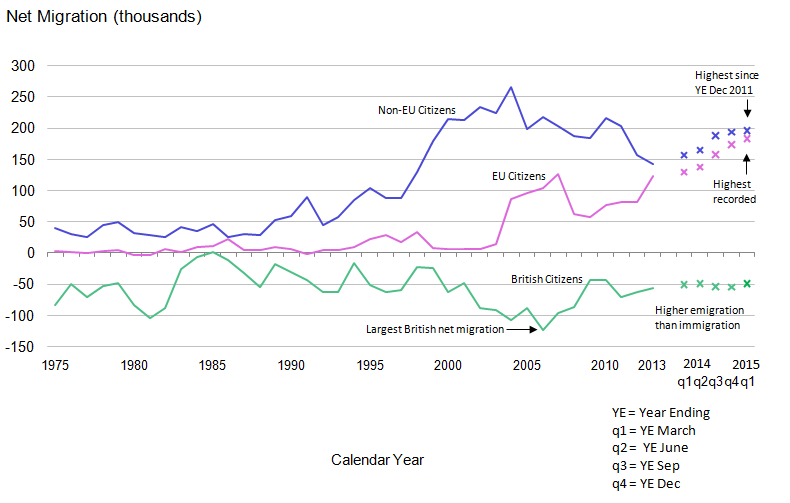
International Passenger Survey (IPS) estimates indicate that the increase in EU net migration has been driven by a statistically significant increase in immigration from the EU2 countries resulting in the net migration of EU2 almost doubling from 25,000 to 49,0001; as well as increases (not statistically significant) from other EU areas.
There was also a statistically significant increase in non-EU net migration, from 157,000 to 196,000, a result of an increase in immigration (not statistically significant) and a statistically significant decrease in emigration. IPS estimates show that there was a statistically significant increase in net migration from South Asia (from 26,000 to 43,000)2.
Notes for Net migration to the UK
- Throughout the report, users are encouraged to review our published tables and note the confidence intervals around our estimates. These confidence intervals give an indication of the accuracy of the estimates and the extent to which comparisons can be drawn between them.
- In addition to the conventional citizenship and country groupings, IPS estimates are now output to new groupings following a consultation in 2014.
4. Immigration to the UK
- The latest immigration estimate for the year ending (YE) March 2015 is 636,000, with a confidence interval of +/-37,000, a statistically significant increase from 552,000 (+/-31,000) in YE March 2014 (As before, from here on, any reference to change, such as increase or decrease, refers to this same time period comparison, unless otherwise stated.)
The latest immigration figure of 636,000 is the highest in the published series but users should be aware that no revisions were made to separate immigration and emigration estimates at the time the net migration estimates were revised. ONS analysis of the differences between the Census and population estimates suggest immigration figures could have been higher in the mid-2000s as a result of migration from Eastern Europe.
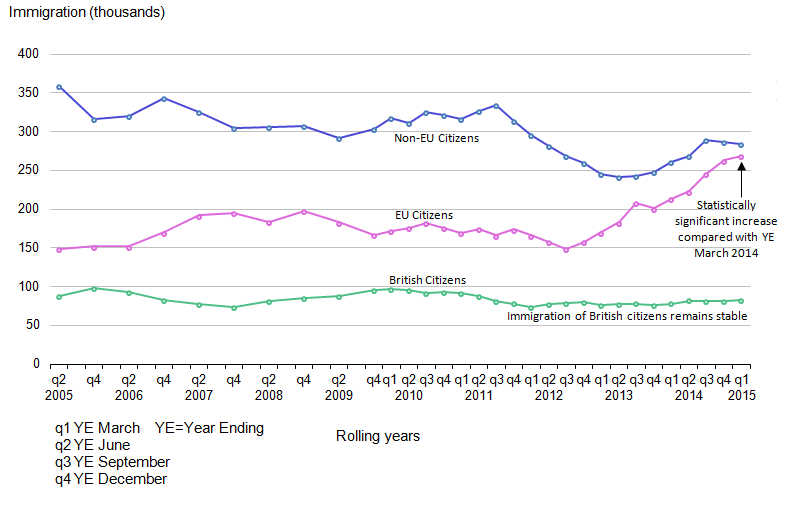
In YE March 2015, immigration of EU citizens saw a statistically significant increase from 213,0001 to 269,000 (Figure 4).
Non-EU immigration showed a non-statistically significant increase from 261,000 in YE March 2014 to 284,000 in YE March 2015.
Figure 4: Immigration to the UK, by citizenship
2005 to 2015 (year ending March 2015)
Source: Long-term International Migration - Office for National Statistics
Notes:
- Figures for 2014 and 2015 are provisional.
- This chart is not consistent with the total revised net migration estimates as shown in Figures 1 and 2.
Download this image Figure 4: Immigration to the UK, by citizenship
.png (28.8 kB) .xls (31.2 kB)
EU citizens
Immigration of EU citizens was estimated to be 269,000 in YE March 2015, a statistically significant increase from 213,000 (Long Term International Migration (LTIM) data), and the highest recorded level for this group (Figure 4). Figure 5 uses IPS data (not LTIM) to show how EU immigration is broken-down proportionately by the 3 main EU groups.
Figure 5: EU immigration to the UK
2005 to 2015 (year ending March 2015)
Source: International Passenger Survey (IPS) - Office for National Statistics
Notes:
- Figures for 2015 are provisional.
Download this image Figure 5: EU immigration to the UK
.png (32.3 kB) .xls (31.7 kB)
The IPS data mirror the LTIM data and show a statistically significant increase in immigration from the EU, from 197,000 to 245,000. This is the highest IPS estimate of immigration for EU citizens since the survey began2. For the latest year, this has been primarily driven by a statistically significant increase in EU2 immigration, from 28,000 to 53,000, as well as increases (not statistically significant) from other EU areas. EU2 citizens now account for 22% of total EU immigration.
Bulgaria and Romania (EU2) joined the EU on 1 January 2007. Migrants coming to the UK from these countries were initially subject to transitional employment restrictions, which placed limits on the kind of employment they could undertake. These restrictions ended on 1 January 2014, and this release shows 1 full year of finalised IPS data, and 1 quarter of provisional IPS data since this removal of the restrictions. The estimate of EU2 citizens immigrating for work-related reasons has shown a statistically significant increase from 22,000 in YE March 2014 to 42,000 in YE March 2015. The EU2 immigration trend shows a continuing upward direction.
IPS data for the EU8 and EU15 countries showed no statistically significant changes in YE March 2015, but both showed increases in immigration (from 60,000 to 72,000, and from 106,000 to 116,000 respectively) which contributed to the overall increase in EU immigration.
Since the YE September 2012, there has been similar growth in EU15 nationals and EU2 nationals arriving as long-term migrants in the UK, whereas the rise in EU8 nationals has been much smaller. These changes could reflect stronger growth in the UK labour market over this period and the potential relative strength of the Eastern European economies at present compared to some countries in southern Europe.
Non-EU citizens
Immigration of non-EU citizens increased from 261,000 to 284,000 (LTIM figures). This was not statistically significant and non-EU citizens continue to account for a larger share of immigration, compared to EU nationals.
There was a statistically significant increase in immigration of Commonwealth (see Glossary) citizens (from 104,000 to 128,000), including a statistically significant increase in Old Commonwealth citizens (from 26,000 to 38,000). New Commonwealth citizen immigration has also increased from 78,000 to 90,000 but this is not statistically significant.
Immigration from the Other Foreign citizenship group has remained stable (from 157,000 to 156,000).
Immigration estimates of non-EU citizens had showed a decline between YE September 2011 and YE June 2013. This decline was largely due to lower immigration of Asian citizens, in particular for study. Visa statistics suggest this was related to the sharp decline in study in the further education sector. IPS estimates indicate that from YE March 2014 to YE March 2015 there was a statistically significant increase for citizens of South Asia (from 46,000 to 59,000).
British citizens
Long-Term International Migration estimates show that in YE March 2015, the estimated number of British citizens immigrating to the UK was 83,000. This figure is similar to the 78,000 British citizens estimated to have immigrated to the UK in YE March 2014. IPS estimates show that British citizens are immigrating for:
- work-related reasons (46,000)
- going home to live (16,000)
- accompanying/joining others (9,000)
- formal study (6,000)
Entry clearance visas
Nationality information on migrants that are subject to immigration controls, coming from non-EU countries, is provided by data on entry clearance visas.
Figure 6: Entry clearance visas granted (excluding visitor and transit visas) to the UK, top 10 countries, year ending June 2015
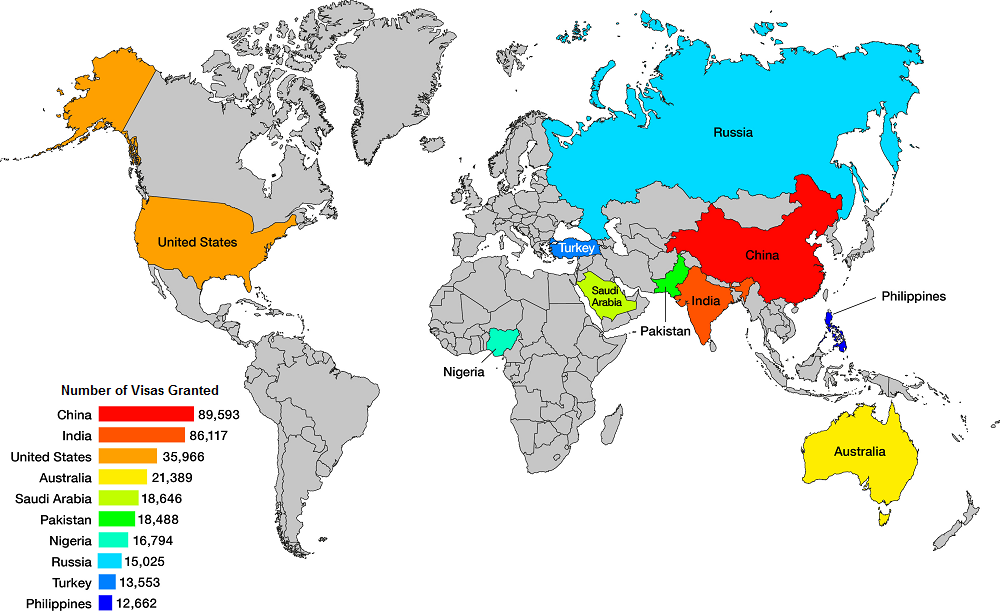
Source: Home Office, Immigration Statistics April to June 2015
Notes:
- China excludes Hong Kong.
- The image shows the number of entry clearance visas granted, excluding visitor and transit visas, for the top 10 nationalities in the year ending June 2015. The data are available in Home Office Quarterly Immigration Statistics within the visa topic section.
Download this image Figure 6: Entry clearance visas granted (excluding visitor and transit visas) to the UK, top 10 countries, year ending June 2015
.png (285.1 kB) .xls (278.5 kB)
Figure 6 shows the top 10 nationalities granted visas (excluding visitor and transit visas) in YE June 2015. Those with an Asian nationality have accounted for the majority of visas. Asian nationals accounted for 297,671 (55%) of the 538,663 visas granted in the YE June 2015, with China and India accounting for 17% and 16% of the total respectively.
The number of visas granted in YE June 2015, excluding visitor and transit visas (538,663), was very similar to YE June 2014 (538,504). Increases for China (up 8,641 or +11%) and India (up 4,025 or +5%) were offset by falls for Libya (down 6,188 or –64%) and Russia (down 5,413 or –26%).
There are a range of potential reasons why IPS figures may be different from figures for visas granted or passenger arrivals and hence why the trends in the different series may not match, including:
- sampling variation in the IPS
- differences between intentions and visa length
- timing differences between when visas are granted and when an individual actually travels
- visa and admissions data includes dependents, and both short-term and long-term migrants
Although the above figures exclude visitor and transit visas, they will include some individuals who do not plan to move to the UK for a year or more, as well as dependants. There is evidence that recent increases up to 2013 in visas granted reflect higher numbers of short-term visas. The Home Office published a research note which indicated that the increase from 2012 to 2013 in total visas granted, excluding visit and transit visas, was accounted for by higher numbers of short-term (less than 1 year) visas. Nevertheless, recent trends in visas granted have also provided a good leading indicator for trends in long-term non-EU immigration.
For more information see the Home Office Immigration Statistics April to June 2015 bulletin. In addition, ONS published an annual report on Short-Term International Migration, 21 May 2015.
Immigration to the UK by main reason
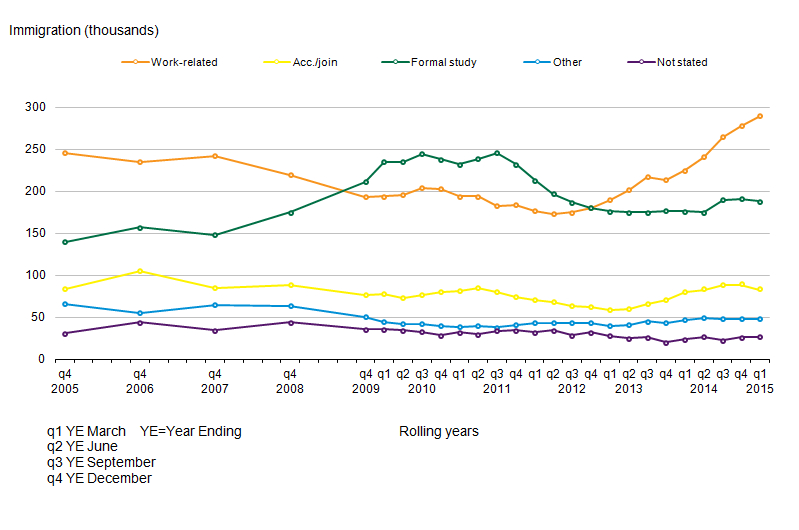
The following sections describe the main reason for migration for long-term immigrants to the UK. Approximately three-quarters of immigrants to the UK are people migrating to work or study (Figure 7).
Figure 7: Long-Term International Migration estimates of immigration to the UK, by main reason for migration
2005 to 2015 (year ending March 2015)
Source: Long-term International Migration - Office for National Statistics
Notes:
- Figures for 2014 and 2015 are provisional.
- Up to YE Dec 09, estimates are only available annually.
- Acc./join means accompanying or joining.
Download this image Figure 7: Long-Term International Migration estimates of immigration to the UK, by main reason for migration
.png (29.6 kB) .xls (34.8 kB)
Of those whose main reason for migration was work-related, the majority (59%) were EU citizens; whereas of those whose main reason for migration was study, the majority (72%) were non-EU citizens. Changes in flows of people migrating for these reasons are affected by the differing rights of EU and non-EU citizens to migrate to the UK and by the impact of government policy.
Home Office visa statistics show that most of the 538,663 visas granted (excluding visitors and transit visas) to non-EEA nationals in the YE June 2015 were for study (216,769, excluding student visitors) or for work (168,544). In addition, 64,181 student visitor and 35,245 family-related visas were granted. IPS long-term immigration estimates for work and formal study amongst non-EU nationals broadly follow the same long-term trends as visas granted for work and study. However, IPS estimates will be lower than the visa figures because the IPS estimates exclude those individuals who intend to stay for less than 1 year.
Furthermore, the dependants of those granted a visa to work or study are included in the work and study visas figures, whereas the reason for migration for such individuals, in most cases, are likely to be recorded as accompanying or joining others by the IPS.
IPS statistics and visa statistics represent flows of people, only a proportion of whom will remain for longer periods. A recent Home Office research report The reason for migration and labour market characteristics of UK residents born abroad (September 2014) used data from the Labour Force Survey to provide estimates of the number of residents born abroad by the reason for original migration. One finding of this research was that the distribution of original reasons given by non UK-born residents of the UK was very different from that produced when looking at the migration flows reported in the IPS. For example, the proportion of people who came for family purposes or as a dependant took greater significance, because it is more likely for people who come for relationship reasons to stay longer or permanently. Similarly, although many foreign students are temporary, the analysis confirmed findings in other studies that a proportion of foreign students do stay on as residents.
Immigration for work
For long-term international migration flows the most commonly stated reason for immigration to the UK is work (Figure 7). LTIM estimates showed a statistically significant increase from 225,000 to 290,000, the highest estimate in the series (but users should be aware that no revisions were made to separate immigration and emigration estimates at the time the net migration estimates were revised - ONS analysis of the differences between the Census and population estimates suggest immigration figures could have been higher in the mid-2000s as a result of migration from Eastern Europe).
IPS estimates show statistically significant increases for both EU and non-EU citizens immigrating for work-related reasons. Around 59% of immigrants arriving for work were EU citizens, 23% were non-EU citizens and a further 17% were British citizens.
IPS estimates show that 162,000 EU citizens arrived for work in YE March 2015, a statistically significant increase from 134,000 in YE March 2014. EU immigration for work began to increase following the EU Accession (enlargement) in 2004, from 65,000 in 2004, to 125,000 in 2007. There was a decline in EU immigration for work during 2008, particularly among EU8 citizens, following which it remained steady at around 90,000 until 2012. Since then EU immigration for work has steadily increased (Figure 8). Of the EU2 citizens immigrating to the UK, 42,000 were coming for work, a statistically significant increase of 20,000.
Figure 8: Immigration to the UK for work-related reasons, by citizenship
Year ending March 2012 to year ending March 2015

Source: International Passenger Survey (IPS) - Office for National Statistics
Notes:
- Figures for 2015 are provisional.
- These are rolling year estimates, and peaks are shown with the appropriate “year ending” data.
Download this image Figure 8: Immigration to the UK for work-related reasons, by citizenship
.png (34.0 kB) .xls (29.7 kB)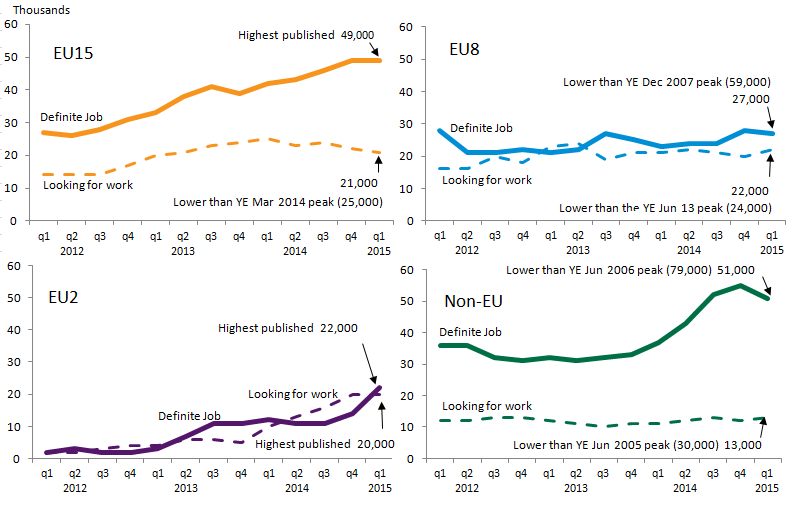
Approximately 61% (99,000) of all EU immigrants arriving for work-related reasons had a definite job to go to. The equivalent percentages for the EU15, EU8 and EU2 citizenship groups are 70%, 54% and 52% respectively. Around 39% (63,000) of EU citizens arriving for work came without a definite job and were intending to look for work.
Data from LFS and National Insurance number (NINo) (please see glossary) registrations indicate there has been an increase in immigration for work among EU citizens, with the greatest increases seen among EU2 citizens. Note, however, that both NINo and labour market statistics will include some short-term workers as well as long-term migrants, have definitional differences and are not directly comparable with each other. More information on this is available in the MSQR Information for Users (315.4 Kb Pdf) .
According to the latest IPS figures, the number of long-term non-EU immigrants arriving for work-related reasons showed a statistically significant increase from 48,000 to 64,000. Of the non-EU immigrants who arrived for work-related reasons, 80% had a job to go to, reflecting the need to obtain a work visa for people coming from outside the EU, which in the majority of cases would require sponsorship by an employer. This increase in long-term migration is consistent with the increase in visas issued to non-EU citizens which were predominantly issued to skilled workers.
National Insurance number (NINo) allocations to overseas nationals
Figure 9 shows the rolling 12 month totals for NINo registrations to overseas nationals, split by EU and non-EU nationals. In YE June 2015, 917,000 overseas nationals registered for a NINo of which three-quarters were from within the EU.
It should be noted that these figures also include short-term migrants and are not a direct measure of when a person migrated to the UK, as those registering may have arrived to live in the UK weeks, months or years before registering – and may have subsequently returned abroad.
Although figures do accurately reflect the number of NINos registered over time, a change to the process of recording NINos in 2014, means that the volume of NINo registrations was lower in YE June 2014 and then higher in the latest year to YE June 2015 than would otherwise be the case. Caution should therefore be taken when making comparisons of NINo registrations between these periods.
Figure 9: National Insurance number allocations to adult overseas nationals entering the UK from the EU and Non-EU
September 2005 to June 2015
Source: DWP, National Insurance number allocations to adult overseas nationals
Notes:
- The figures are based on recorded registration date on the National Insurance Recording and Pay as you Earn System (NPS), ie after the NINo application process has been completed. This may be a number of weeks or months (and in some cases years) after arriving in the UK.
Download this image Figure 9: National Insurance number allocations to adult overseas nationals entering the UK from the EU and Non-EU
.png (27.2 kB) .xls (22.0 kB)
Table 3: National Insurance number registrations to adult overseas nationals entering the UK, year ending June 2015
| United Kingdom | ||||
| Thousands | ||||
| World area | Year to June 2014 total | Year to June 2015 total | Difference | % Change to previous year |
| Total | 566.0 | 917.0 | 352.0 | 62% |
| European Union | 421.0 | 697.0 | 277.0 | 66% |
| Non European Union | 144.0 | 218.0 | 74.0 | 51% |
| EU15 | 172.0 | 263.0 | 91.0 | 53% |
| EU8 | 161.0 | 216.0 | 55.0 | 34% |
| EU2 | 85.0 | 214.0 | 129.0 | 151% |
| Source: Department for Work and Pensions | ||||
| Notes: | ||||
| 1. The figures are based on recorded registration date on the National Insurance Recording and Pay as you Earn System, i.e. after the NINo application process has been completed. This may be a number of weeks or months (and in some cases years) after arriving in the UK. | ||||
| 2. The data series include both short-term and long-term migrants. | ||||
| 3. The number of new registrations of NINos to non-UK nationals over a given period is not the same as the total number of non-UK nationals who hold a NINo. | ||||
| 4. The total number of non-UK nationals who have been allocated a NINo is not the same as the number of non-UK nationals working in the UK. This is because people who have been allocated NINos may subsequently have left the UK, or they may still be in the UK but have ceased to be in employment. | ||||
| 5. Some people arriving into the UK may already hold a NINo from a previous stay in the UK. Once a person has been allocated a NINo, they do not need to reapply in order to work in the UK. | ||||
Download this table Table 3: National Insurance number registrations to adult overseas nationals entering the UK, year ending June 2015
.xls (28.2 kB)For EU citizens, the number of NINo registrations in YE June 2015 was 697,000, an increase of 277,000 (66%) on the previous year. The top 5 EU nationalities for new NINo registrations in YE June 2015 were:
- Romanian (170,000)
- Polish (128,000)
- Italian (64,000)
- Spanish (59,000)
- Bulgarian (44,000)
For non-EU citizens, the number of NINo registrations in YE June 2015 was 218,000, an increase of 74,000 (51%) on the previous year. The top 5 non-EU nationalities for new NINo registrations in YE June 2015 were:
- Indian (40,000)
- Pakistani (15,000)
- Chinese (15,000)
- Australian (15,000)
- Nigerian (13,000)
Labour market statistics
The latest labour market statistics from the labour force survey show that the number of non-UK nationals in employment increased by 257,000 (9%) to 3.2 million in April to June 2015 compared with the same quarter in the previous year (2.9 million). Employment of EU nationals increased by 250,000 (14%) to 2.0 million and employment of non-EU nationals increased by 7,000 (1%) to 1.2 million. The growth in overall employment over the last year was 342,000 and of this, 25% can be accounted for by a growth in employment for UK nationals and 75% by the growth in employment amongst foreign nationals. (These estimates relate to the number of people in employment rather than the number of jobs and therefore show net changes in the number of people in employment, not the proportion of new jobs that have been filled by UK and non-UK workers.)
Labour market statistics show an estimated 178,000 EU2 citizens were employed in the UK in April to June 2015, an increase of 30% from the same quarter in the previous year. This follows the lifting of labour market restrictions for EU2 citizens in January 2014.
There was also an increase of 16% to 838,000 for EU15 (excluding British) citizens and an increase of 12% to 959,000 for EU8 citizens. Labour market statistics are a measure of the stock of people working in the UK and are not designed to provide a measure of migration flows. As a result changes in the labour market stock cannot be directly compared to long-term net migration changes.
Work-related visas (Non-EEA nationals)
There have previously been falls in work-related visas granted following the introduction of the points-based system and the onset of the recession in 2008. More recently the closure of the tier 1 general and tier 1 post-study categories to new applicants has led to further reductions in work visas – see Home Office Work topic report. Trends in visa numbers also reflect the changing economic environment. More recently the numbers of skilled work visas (tier 2) have started to rise, reflecting the growth in the UK economy and continuing demand for migrant workers.
In the YE June 2015, there were 6% more work-related visas granted (up 9,313 compared with the previous year, to 168,544), largely accounted for by higher numbers of skilled work visas (+7,977). Over the same period, there was also a corresponding 10% increase in sponsored visa applications for skilled work (to 55,664, main applicants). Most of the applications were for the information and communication (23,518), professional, scientific and technical activities (10,728), and financial and insurance activities (6,695) sectors (Figure 10).
Figure 10: Skilled work visa applications by industry sector
UK, year ending June 2011 to year ending June 2015
Source: Home Office, Immigration Statistics April – June 2015
Notes:
- Ye = Year ending
- As part of the application process for visas, individuals must obtain a certificate of sponsorship from an employer. The data shown relate to the numbers of sponsoring documents used by main applicants applying for tier 2 (Skilled work) visas. European Economic Area (EEA) nationals do not require a visa to enter the UK.
Download this chart Figure 10: Skilled work visa applications by industry sector
Image .csv .xlsImmigration for study
LTIM estimates of immigration to the UK to study increased from 176,000 to 188,000 in YE March 2015 for all nationalities, albeit a non-statistically significant increase. IPS estimates show that 72% (137,000) of long-term immigrants to the UK for study are non-EU citizens. Of these, two-thirds are Asian citizens, with the largest numbers coming from China and India. Immigration of all Asian citizens for study rose from 78,000 in YE June 2008 to a peak of 166,000 in YE September 2011. This number then decreased driven by lower numbers of South Asian citizens arriving for study and has remained steady at around 90,000.
There are a range of potential reasons why LTIM and IPS figures for long-term migrants for study may be different from Home Office figures for study visas granted. For example, the Home Office visa statistics include short-term students migrating to the UK for less than 1 year.
Home Office statistics show that there were 216,769 visas granted for the purposes of study (excluding student visitors) in YE June 2015, a fall of 1% compared with the previous year. The top 5 nationalities accounted for 53% of all study visas granted in the year ending June 2015, with the largest number going to Chinese nationals (68,294 or 32% of the total). There were higher numbers of study visas granted (excluding student visitors) for Chinese (+6,802 or +11%) and Malaysian (+690; +7%) nationals and fewer Bangladeshi (-1,671; -52%), Indian (-1,251; -10%) and Pakistani (-981; -21%) nationals.
The total number of study-related sponsored visa applications (main applicants excluding student visitors) fell 1% in the YE June 2015 (204,527) compared to the previous 12 months (206,722). Statistics on sponsored applications for visas by education sector show that the falls over recent years in visas granted to non-EEA nationals for study have been in the non-university sector (Figure 11). In the year ending June 2015, visa applications to study at a UK university (main applicants) rose by 0.2% to 167,426. There were falls in the further education sector (to 17,172, -13%) and English Language schools (to 3,245, -1%) along with a rise in the independent schools sector (to 13,797, +5%).
Figure 11: Study-related sponsored visa applications, by sector
UK, year ending December 2010 to year ending June 2015
Source: Home Office, Immigration Statistics April to June 2015
Notes:
- The numbers show the use of a Certificate of Acceptance for Study (CAS) in a study visa application.
- Universities are “recognised bodies” (meaning that it has its own UK degree-awarding powers), or bodies in receipt of public funding as a Higher Education Institute (HEI). Institutions (including further education colleges) which receive some public funding to deliver higher education courses do not fall within this definition of an HEI. They are UK-based. Further education contains the remainder of sponsors who described themselves as “University and tertiary”, plus those who described themselves as “Private Institution of Further or Higher Education” or whose self-description included “further education” or ”higher education”. Includes a small number of foreign-based universities, but these account for very small numbers of CAS used.
- The chart excludes sponsored visa applications from a small number of other sponsors.
Download this chart Figure 11: Study-related sponsored visa applications, by sector
Image .csv .xlsStudent visitors are not counted as long-term migrants and cannot extend their stay and are therefore not covered in detail in this report. For more information on immigration to the UK for study, see the Home Office topic report on Study.
Immigration for other reasons
Reasons for migrating other than work or study include accompanying or joining family or friends, asylum and returning home to live. Figure 7 shows these other reasons in brief.
LTIM estimates show that the third most common reason for migrating to the UK is to accompany or join others. In YE March 2015, 83,000 long-term migrants arrived in the UK to accompany or join others (Figure 7), a non-statistically significant change compared with the previous year. Recent increases represent a return to levels similar to those in 2011.
The long-term migration accompany/join category can include both people who are arriving to marry a UK resident as well as people coming as a family member of another migrant coming for other reasons, such as to work3.
Family visas (Non-EEA nationals)
There are a number of ways that allow people to come to the UK for family reasons. The traditional "family route" is made up of those coming to join or accompany family members who are British citizens or settled people. This includes fiancé(e)s, proposed civil partners, spouses, civil partners, unmarried or same-sex partners, children and adult dependent relatives. Home Office entry clearance visa statistics show that 35,245 family route visas were granted in the YE June 2015, a decrease of 1% compared with the YE June 2014 (35,664). This is less than half the level of the peak in the YE March 2007 (72,894).
Further information on visas granted for family reasons has been published by the Home Office.
Asylum applications
There were 25,771 asylum applications in YE June 2015, an increase of 10% compared with the previous year (23,515). The number of applications remains low relative to the peak number of applications in 2002 (84,132), and typically accounts for 4% of long-term inflows.
In YE June 2015, the largest number of applications for asylum came from nationals of Eritrea (3,568), followed by Pakistan (2,302) and Syria (2,204).
A total of 11,600 people were granted asylum or an alternative form of protection. The grant rates vary between nationalities. For example, 87% of the total initial decisions made for nationals of Syria were grants, compared with 73% for Eritrean nationals and 22% for Pakistani nationals.
Further information on asylum has been published by the Home Office.
In February 2015 the Home Office published its migrant journey: fifth report which shows how non-EEA migrants change their immigration status or achieve settlement in the UK.
Main points include:
20% (18,359) of those issued skilled work visas (with a potential path to settlement) in the 2008 cohort had been granted settlement 5 years later and a further 8% (6,912) still had valid leave to remain
Indian nationals were issued the largest proportion (39%) of skilled work visas in the 2008 cohort and, of these skilled Indian nationals, 19% had received settlement after 5 years, while a further 7% still had valid leave to remain
In May 2015, the Home Office published an update to the article Extensions of stay by previous category. Looking at extensions data by individuals’ previous category, 7,043 former students were granted extensions for work in 2014 (main applicants). The comparable figure for 2013 was 6,238 and for 2012 was 38,505. The large fall from 2012 to 2013 reflected the closure of the Tier 1 post-study category to new entrants in 2012.
Notes for immigration to the UK
- Throughout the report, users are encouraged to review our published tables and note the confidence intervals around our estimates. These confidence intervals give an indication of the accuracy of the estimates and the extent to which comparisons can be drawn between them.
- Users should be aware that no revisions were made to separate immigration and emigration estimates at the time the net migration estimates were revised; ONS analysis of the differences between the Census and population estimates suggest immigration figures could have been higher in the mid-2000s as a result of migration from Eastern Europe.
- Much more detail can be found in the Home Office Immigration Statistics User Guide.
5. Emigration from the UK
- The latest Long Term International Migration (LTIM) emigration estimate for the year ending March 2015 was 307,000 with a confidence interval of +/-21,000
Recent levels of emigration had remained stable and well below the high of 427,0001 in 2008. The latest data show an apparent reduction in emigration, of 9,000, though not statistically significant. It could be that part of the reduction in emigration reflects the decline in New Commonwealth citizens arriving to study since 2011.
Figure 12: Emigration from the UK, by citizenship
2005 to 2015 (year ending March 2015)

Source: Long-term International Migration - Office for National Statistics
Notes:
- Figures for 2014 and 2015 are provisional.
- This chart is not consistent with the total revised net migration estimates as shown in Figures 1 and 2. Please see guidance note for further information.
Download this image Figure 12: Emigration from the UK, by citizenship
.png (27.1 kB) .xls (23.0 kB)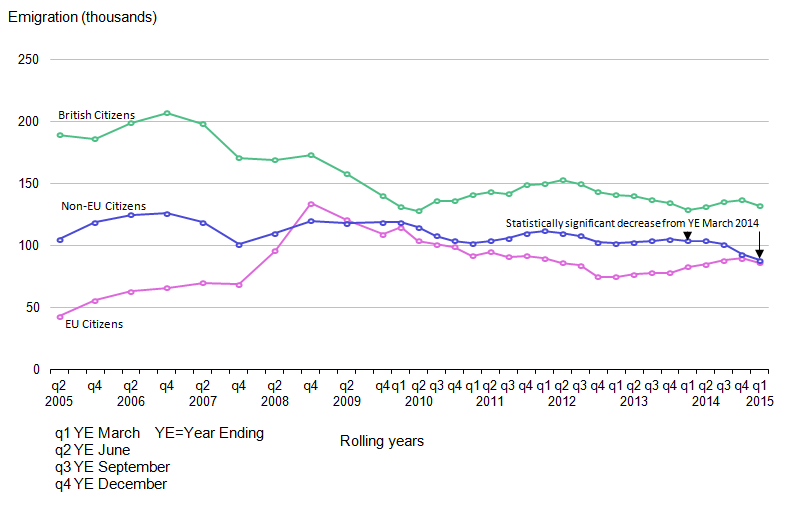
British citizens
British citizens accounted for 43% of emigrants in YE March 2015 (132,000). Emigration of British citizens has remained at around the same level since 2009, having fallen from the peak of 207,000 in 2006 (Figure 12).
EU citizens
The estimated number of EU citizens emigrating from the UK was 86,000 in YE March 2015 not statistically significantly different from the estimated 83,000 EU citizens who emigrated in YE March 2014. (As before, from here on, any reference to change, such as increase or decrease, refers to this same time period comparison, unless otherwise stated.) LTIM estimates are not available for every individual EU citizenship grouping. However, International Passenger Survey (IPS) estimates show that emigration among the various EU citizenship groups has remained stable over the last few years.
Just under half of non-British emigration was accounted for by EU citizens.
Non-EU citizens
The LTIM estimates show the number of non-EU citizens emigrating from the UK in YE March 2015 was 88,000, a statistically significant decrease from 104,000, driven by a statistically significant decrease in emigration by citizens of the New Commonwealth.
IPS figures showed a statistically significant decrease in emigration by citizens of countries outside Europe and Asia, from 37,000 to 26,000.
IPS data suggest 61% of the non-EU emigrants, were of Asian citizenship, and accounted for a third of all non-British emigration.
Reasons for emigration
In the LTIM estimates for YE March 2015, work-related reasons remain the main reason given for emigration, accounting for 166,000 (54%) of emigrants, a reduction from 182,000 the previous year.
The overall reduction from 316,000 to 307,000 emigrants appears to be driven by a statistically significant reduction in emigration for people “looking for work” (from 76,000 to 61,000). All other reasons remained relatively stable. IPS data show this occurring in various country groupings, but is concentrated in non-EU emigrants (from 41,000 to 29,000).
Of the 33,000 emigrants who, in the IPS, stated their main reason for migration as “going home to live”, 19,000 were EU citizens and 14,000 were citizens of non-EU countries. The peak of people leaving the UK to return home was in 2008 when 62,000 emigrated for this reason. This peak coincides with the start of the economic downturn.
For more detail on emigration, previous Home Office Research Report 68, published in November 2012, presents information from academic research and surveys drawn together to present the main aspects of long-term emigration from the United Kingdom. This includes recent outward migration and some trends over the last 20 years, separately for British, EU and non-EU citizens.
People emigrating from the UK by previous main reason for immigration
In 2012, a new question was added to the IPS asking current emigrants who had previously immigrated to the UK about their main reason for migration at the time that they arrived. Of the 284,000 individuals shown in IPS data to be emigrating from the UK, 97,000 were “new” long-term emigrants (individuals who had not previously lived away from the UK for 12 months or more) and 186,000 were long-term emigrants who had formerly immigrated to the UK.
Figure 13: Outflow of migrants, who are former immigrants to the UK by citizenship and previous main reason for immigration (year ending March 2015)
Source: International Passenger Survey (IPS) - Office for National Statistics
Notes:
- Estimates are provisional.
- “Work-related reasons” is the sum of “definite job” and “looking for work”.
Download this chart Figure 13: Outflow of migrants, who are former immigrants to the UK by citizenship and previous main reason for immigration (year ending March 2015)
Image .csv .xlsWork was the most common main reason for immigrating to the UK reported by former immigrants who emigrated in the YE March 2015.
Using the new country groupings, the latest IPS estimates show that in YE March 2015, of the 85,000 emigrants who had previously immigrated to the UK for work-related reasons, 23,000 (27%) were non-EU citizens (12,000 of which were citizens of Asian countries) and 48,000 (56%) were EU citizens (excluding British).
The estimated number of emigrants who had previously immigrated to the UK for formal study has seen a statistically significant reduction from 74,000 to 59,000. This is driven by a statistically significant decrease for New Commonwealth citizens (from 19,000 to 12,000), reflecting the decline in New Commonwealth citizens arriving to study since 2011.
The estimates also show that of these 59,000 emigrants, 41,000 (69%) were non-EU citizens (a statistically significant decrease from 50,000) and 15,000 (25%) were EU emigrants. Of the 41,000 non-EU citizens, 33,000 were citizens of Asian countries
Notes for Emigration from the UK
Throughout the report, users are encouraged to review our published tables and note the confidence intervals around our estimates. These confidence intervals give an indication of the accuracy of the estimates and the extent to which comparisons can be drawn between them.
Back to table of contents6. Accuracy of migration estimates
Surveys gather information from a sample of people from a population. In the case of the IPS, the population is passengers travelling through the main entry and exit points from the UK including airports, seaports and the Channel Tunnel. The estimates produced are based on only one of a number of possible samples that could have been drawn at a given point in time. Each of these possible samples would produce an estimated number of migrants. These may be different to the true value that would have been obtained if it were possible to ask everyone passing through about their migration intentions. This is known as sampling variability.
The published estimate is based upon the single sample that was taken and is the best estimate of the true value based on the data collected. However, to account for sampling variability, the estimates are published alongside a 95% confidence interval.
The confidence interval is a measure of the uncertainty around the estimate. Confidence intervals become larger for more detailed estimates (such as citizenship by reason for migrating). This is because the number of people in the sample who have these specific characteristics (for example, EU8 citizens arriving to study in the UK) is smaller than the number of people sampled within a category at a higher level (such as the total number of EU citizens arriving to study in the UK). The larger the confidence interval, the less precise is the estimate. Therefore users of migration statistics are advised to use the highest level breakdown of data where possible.
95% confidence intervals are used, which is a widely accepted level, meaning that over many repeats of the sample under the same conditions, we would expect the confidence interval to contain the true value 95 times out of 100. Equivalently, we can say that there would be a 1 in 20 chance that the true value would lie outside of the range of the 95% confidence interval.
Estimates from the IPS may change from one period to the next simply due to sampling variability. In other words, the change may be due to which individuals were selected to answer the survey, and may not represent any real-world change in migration patterns.
Statistical tests can be used to determine whether any increases or decreases that we see in the estimates from the IPS could be due to chance, or whether they are likely to represent a real change in migration patterns. If the tests show that the changes are unlikely to have occurred through chance alone, and are likely to reflect a real change, then the change is described as being statistically significant. The usual standard is to carry out these tests at the 5% level of statistical significance. This means that we would expect only 1 out of 20 differences identified as statistically significant to have occurred purely by chance.
For information on the accuracy of these statistics, the difference between provisional and final figures and guidance on comparing different data sources, please see the MSQR Information for Users. Revisions to net migration estimates in light of the 2011 Census
In April 2014, we published a report examining the quality of international migration statistics between 2001 and 2011, using the results of the 2011 Census. A main finding of the report was that over the 10 year period annual net migration estimates were a total of 346,000 lower than total net migration implied by the 2011 Census. However, the report also showed that the quality of international migration estimates improved following changes made to the IPS in 2009.
Within the report, we published a revised series of net migration estimates for the UK. Published tables have been updated on our website to include the revised estimates. The report, a summary and guidance on how to use these revised figures are available on our website.
Back to table of contents7. List of products
The following are URL links to the products underlying this report, or otherwise associated with the co-ordinated migration release of 27 August 2015. The department releasing each product is indicated.
The MSQR user information (ONS) – guidance on interpreting confidence intervals, the difference between provisional and final estimates, and the comparability and quality of input data sources.
International migration statistics first time user guide (ONS) – an introduction to the main concepts underpinning migration statistics including basic information on definitions, methodology, use of confidence intervals and information on the range of available statistics related to migration.
Guidance on revised net migration statistics (ONS) – information for users on how to interpret the revised net migration estimates for 2001 to 2010 alongside published LTIM estimates.
Long-term international migration – Frequently asked questions and background notes (ONS) – information on recent trends in migration, methods and coverage, comparisons with international migration estimates, a complete list of definitions and terms and a guide to the published tables.
Quality and methodology information for international migration (ONS) – information on the usability and fitness for purpose of long-term international migration estimates.
Long-term international migration estimates methodology (ONS) – a detailed methodology document for LTIM estimates, including information on current methodology and assumptions, data sources including the International Passenger Survey and changes to the methodology since 1991.
International passenger survey: Quality information in relation to migration flows (ONS) – an overview of the quality and reliability of the International Passenger Survey (IPS) in relation to producing Long-Term International Migration estimates.
Local area migration indicators suite (ONS) – This is an interactive product bringing together different migration-related data sources to allow users to compare indicators of migration at local authority level. This product is newly updated as of 27 August 2015.
Migration theme page (ONS) – This provides the most up to date figures and highlights the latest summaries, publications and infographics for internal and international migration.
Population theme page (ONS) – This provides the most up to date figures and highlights the latest summaries, publications and infographics for different components that contribute to population change, including migration.
Overview of population statistics (ONS) – This describes different aspects of population we measure and why. Information on how these are measured, and the statistics themselves, can be found via the links provided within the document.
Population by country of birth and nationality (ONS) – This short report focuses on changes in the UK resident population by country of birth and nationality for the year ending December 2014. This product is newly updated as of 27 August 2015.
Population by country of birth and nationality, reweighted data for calendar year 2004 to 2013 (ONS) – Publication of revised datasets following the reweighting of the Annual Population Survey in light of results of the 2011 Census. The product was published in July 2015 as a one-off publication.
Short-term international migration annual report (ONS) – A report and tables detailing estimates of short-term migration to and from the UK for England and Wales for the year ending Mid-2013. The product is published annually in May.
Quarterly releases on 27 August 2015:
Provisional Long-Term International Migration, Year Ending March 2015 (ONS)
Immigration Statistics April to June 2015 (Home Office)
National Insurance number (NINo) Allocations to Adult Overseas Nationals to March 2015 (DWP)
Annual releases on 27 August 2015:
Ad Hoc Publications on 27 August 2015:
Additional useful links:
Labour Market Statistics - August 2015 (ONS). This includes estimates of the number of people in employment in the UK by country of birth and nationality.
Quality of Long-Term International Migration Estimates from 2001 to 2011 (ONS)
International Migration Timeline (ONS)
Final Long-Term International Migration (2013) (ONS)
A Comparison of International Estimates of Long-Term Migration (ONS)
Migrant Journey Fifth Report (Home Office)
Immigration Statistics User Guide (Home Office)
Immigration Statistics January to March 2015 (Home Office)
Back to table of contents8. Future releases
The remaining quarterly migration release date in 2015 is:
- Thursday 26 November
To be released on 26 November 2015:
Migration Statistics Quarterly Report – November 2015
Final Long-Term International Migration figures for the calendar year 2014
Revisions to migration statistics
In July 2015, we published a revised back-series of estimates on the population of the UK by country of birth and nationality. The revisions, covering calendar year data from 2004 to 2013, are based on the Annual Population Survey (APS). The APS has recently been re-weighted in light of the 2011 Census results.
Back to table of contents9. Glossary
Annual Population Survey
The Annual Population Survey (APS) is a continuous household survey, covering the UK, with the aim of providing estimates between censuses of main social and labour market variables at a local area level. The APS is not a stand-alone survey, but uses data combined from 2 waves from the main Labour Force Survey (LFS) with data collected on a local sample boost. Apart from employment and unemployment, the topics covered in the survey include housing, ethnicity, religion, health and education.
Citizenship
This is the term used in the International Passenger Survey (IPS) to define the country for which a migrant is a passport holder. This refers specifically to the passport being used to enter or leave the UK at the time of interview. It does not refer to any other passport(s) which migrants of multiple nationality may hold. More generally a British citizen as described in IPS statistics includes those with UK nationality usually through a connection with the UK: birth, adoption, descent, registration, or naturalisation. British nationals have the right of abode in the UK.
Commonwealth (ONS statistical grouping)
The Commonwealth statistical grouping consists of countries of the old Commonwealth and the new Commonwealth (see below).
Confidence interval
This is the range within which the true value of a population parameter lies with known probability. For example the 95% confidence interval represents the range in which, over many repeats of the sample under the same conditions, we would expect the confidence interval to contain the true value 95 times out of 100. Equivalently, we can say that there would be a 1 in 20 chance that the true value would lie outside of the range of the 95% confidence interval. The uppermost and lowermost values of the confidence interval are termed “confidence limits”.
European Economic Area (EEA)
The EEA consists of the 28 countries of the EU (see below), plus Iceland, Liechtenstein and Norway. Swiss nationals are treated as EEA nationals for immigration purposes; however for statistical purposes Switzerland is not included in EEA estimates by ONS.
European Union (EU)
The EU consists of 28 countries: Austria, Belgium, Bulgaria, Croatia, Cyprus, Czech Republic, Denmark, Estonia, Finland, France, Germany, Greece, Hungary, Italy, Latvia, Lithuania, Luxembourg, Malta, Netherlands, Poland, Portugal, Republic of Ireland, Romania, Slovakia, Slovenia, Spain, Sweden and the United Kingdom. Croatia joined the EU in July 2013 – data with a reference period after that date will include Croatia within the EU grouping. Estimates for the EU quoted in this bulletin and accompanying tables exclude British citizens, who are reported as a separate group.
European Union (EU) Accession Countries
The accession countries are those that joined the EU in 2004 or later. 10 joined in 2004 (the EU8, plus Cyprus and Malta), 2 joined in 2007 (the EU2) and Croatia joined in 2013.
EU2
The EU2 (formerly known as the A2) are the 2 countries that joined the EU on 1 January 2007: Bulgaria and Romania. Between 2007 and 2013, EU2 nationals had certain restrictions placed on them; in the first 12 months of stay, working Bulgarian and Romanian nationals were generally required to hold an accession worker card or apply for 1 of 2 lower-skilled quota schemes. Other Bulgarian and Romanian nationals could apply for a registration certificate, giving proof of a right to live in the UK. These restrictions were lifted on 1 January 2014.
EU8
The EU8 (formerly known as the A8) are the 8 central and eastern European countries that joined the EU on 1 May 2004: Czech Republic, Estonia, Hungary, Latvia, Lithuania, Poland, Slovakia and Slovenia. The EU8 does not include the 2 other countries that joined on that date: Cyprus and Malta. EU8 nationals previously had restrictions on their rights to work and were required to register under the worker registration scheme, but these restrictions were lifted from 1 May 2011.
EU15
The EU15 consists of Austria, Belgium, Denmark, Finland, France, Germany, Greece, Italy, Luxembourg, Netherlands, Portugal, Republic of Ireland, Spain, Sweden and the United Kingdom. However, EU15 statistics exclude the United Kingdom.
International Passenger Survey (IPS)
The International Passenger Survey (IPS) is a survey of a random sample of passengers entering and leaving the UK by air, sea or the Channel Tunnel. Between 700,000 and 800,000 people are interviewed on the IPS each year. Of those interviewed, approximately 4,000 to 5,000 people each year are identified as long-term international migrants.
Long-Term International Migration (LTIM)
Long-Term International Migration (LTIM) estimates are produced by combining migration data from the IPS, Home Office data on asylum seekers (including non-asylum enforced removals adjustment), migration to and from Northern Ireland (from the Northern Ireland Statistics and Research Agency) and adjustments for visitor switchers and migrant switchers.
Migrant
We use the UN recommended definition of a long-term international migrant: “A person who moves to a country other than that of his or her usual residence for a period of at least a year (12 months), so that the country of destination effectively becomes his or her new country of usual residence.”
This is the definition used to calculate net migration, and is also used for the UK usually resident population estimate series. This definition does not necessarily coincide with those used by other organisations.
National Insurance number (NINo)
National Insurance numbers are issued to non-UK nationals immigrating for work. The number of NINos will include people who are coming to the UK for short periods or temporary purposes, as well as long-term migrants. The figures are based on recorded registration date on the national insurance recording and pay as you earn system (NPS), ie after the NINo application process has been completed. This may be a number of weeks or months (and in some cases years) after arriving in the UK.
Nationality
Nationality is often used interchangeably with citizenship, and some datasets refer to “nationals” of a country rather than “citizens”. Different datasets have different ways of establishing someone’s nationality. The APS, which underlies the population estimates by nationality, simply asks people “what is your nationality?” However, the IPS, NINo and entry clearance visa data are based on people’s passports. For asylum statistics the nationality is as stated on the “Case Information Database”. This will usually be based on documentary evidence, but sometimes asylum seekers arrive in the UK without any such documentation.
New Commonwealth (ONS Statistical Grouping)
The new Commonwealth statistical grouping consists of African Commonwealth countries (Botswana, Cameroon, The Gambia, Ghana, Kenya, Lesotho, Malawi, Mauritius, Mozambique, Namibia, Nigeria, Seychelles, Sierra Leone, Swaziland, Tanzania, Uganda, Zambia and Zimbabwe), Indian subcontinent countries (Bangladesh, India, Pakistan and Sri Lanka), and other Commonwealth countries in the Asian, Caribbean, and Oceania regions.
It also includes British Dependent Territories and British Overseas citizens. Up to and including 2003, Malta and Cyprus are included in the new Commonwealth grouping. From 2004, the year of accession, they are included in the EU. Malta and Cyprus are members of both the Commonwealth and the EU from May 2004 onwards. However, for estimation purposes they have only been included in the EU grouping for 2004 onwards.
Rwanda was admitted to the Commonwealth in November 2009, but the definition for this statistical grouping has remained unchanged. Zimbabwe and The Gambia withdrew from the Commonwealth in 2003 and 2013 respectively, but again the definition for this grouping has remained unchanged.
New country groupings
We introduced new country groupings in 2014. These are only available for IPS estimates, not LTIM. A listing of which countries are in each of the old and new groups is available. (LINK to table 3.24 showing constitution of new groups)
Old Commonwealth (ONS Statistical Grouping)
The old Commonwealth statistical grouping consists of 4 countries: Australia, Canada, New Zealand and South Africa.
Points Based System (PBS)
The PBS is a rationalisation of immigration control processes for people coming into the UK for the purposes of work or study who are not EEA or Swiss nationals. Entries are classed into 5 tiers. Tier 1 is for high value individuals such as investors and entrepreneurs. Tier 2 is for skilled workers with a job offer. Tier 3 is low skilled workers – this entry route was never opened and is currently suspended. Tier 4 is for students and tier 5 is for youth mobility and temporary workers.
Statistical significance
The International Passenger Survey interviews a sample of passengers passing through ports within the UK. As with all sample surveys, the estimates produced from them are based upon one of a number of different samples that could have been drawn at that point in time. This means that there is a degree of variability around the estimates produced. This variability sometimes may present misleading changes in figures as a result of the random selection of those included in the sample. If a change or a difference between estimates is described as “statistically significant”, it means that statistical tests have been carried out to reject the possibility that the change has occurred by chance. Therefore statistically significant changes are very likely to reflect real changes in migration patterns.
Student visitor
The student visitor visa category provides for those people who wish to come to the UK as a visitor and undertake a short period of study which will be completed within the period of their leave (maximum 6 months unless applying under the concession for English language courses – 11 months). Short-term students (that is those studying on courses of 6 months’ duration or less) who do not intend to work part-time or undertake a paid or unpaid work placement as part of their course can also apply within this category.
Study
Estimates for study refer only to migrants arriving to or leaving the UK for formal study.
Back to table of contents