1. Main points
Labour productivity grew by 0.9% in Quarter 3 (July to Sept) 2017, the largest increase in productivity since Quarter 2 (Apr to June) 2011, reversing falls in output per hour in the previous two quarters.
Examining UK productivity growth on a rolling 10-year basis suggests that the recent UK performance has been among the weakest since official records began and may not be comparable with any period since the early-1820s.
Annual public service productivity for the UK is estimated to have risen by 0.2% between 2014 and 2015; that is the sixth successive year of improving productivity and marks the longest continuous period of productivity growth for total public services for which estimates are available.
The productivity of public service healthcare grew for a sixth consecutive year in 2015, although it did so by only 0.1% – the slowest rate of growth since 2009.
Experimental data suggest that productivity for the public services increased by 0.7% in Quarter 3 2017 – following a contraction of 0.5% in the previous quarter – due mainly to a 0.5% fall in inputs, while total public service output increased by 0.2%.
2. Economist’s comment
Commenting on today’s releases, ONS deputy chief economist Richard Heys said:
“We have a new measure of the quality of services delivered by the criminal justice system, which allows us better to estimate productivity in this sector. These new figures should help support improved understanding and debate on the importance of efforts to tackle re-offending, speed cases through court and improve safety in prisons on the outcomes observed by the public. This improvement marks an important step in our transformation of productivity figures.”
“Overall, public sector productivity grew 0.2% in 2015. This is the sixth successive year of improving productivity and marks the longest consecutive period of productivity growth for total public services since comparable records began.”
Back to table of contents3. Labour productivity
Labour productivity grew by 0.9% in Quarter 3 (July to Sept) 2017, the largest increase since Quarter 2 (Apr to June) 2011, reversing falls in output per hour in the previous two quarters (Figure 1). As a consequence of this growth and revisions to estimates of gross value added, labour productivity is now estimated to have been 0.8% higher than a year earlier in Quarter 3 2017 – up from 0.6% higher at the time of the flash estimate. On an output per worker basis, labour productivity was also 0.9% higher than the same period in 2016, and is 1.7% higher than the pre-downturn peak.
Figure 1: Percentage change on previous quarter and index of output per hour
Seasonally adjusted, Quarter 1 (Jan to Mar) 2008 to Quarter 3 (July to Sept) 2017, UK
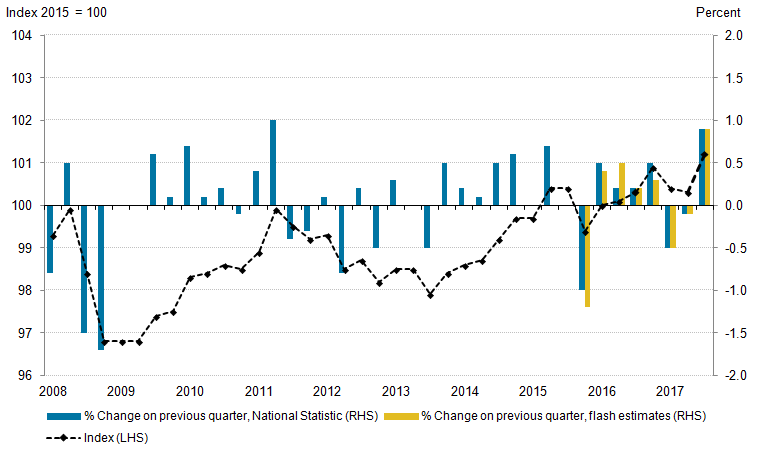
Source: Office for National Statistics
Download this image Figure 1: Percentage change on previous quarter and index of output per hour
.png (24.0 kB) .xls (29.2 kB)
Growth in labour productivity over the year to Quarter 3 2017 was supported by output per hour growth in manufacturing (2.1%), financial services (4.7%) and non-financial services (1.0%), although output per hour continued to decline in non-manufacturing production (negative 6.0%) and was flat in construction. Of these, non-financial services made the largest contribution to the growth of labour productivity over the last year – accounting for 0.7 percentage points of whole economy growth since Quarter 3 2016 (Figure 2). At the more detailed level, this growth was largely accounted for by relatively strong labour productivity growth in business services (5.9% higher over the same period). Changes in the overall composition of the UK economy – reflecting movements of labour between industries with different levels of output per hour – also weighed on growth over this period, although this effect has lessened over the last year.
Figure 2: Contributions to the growth of output per hour over the year to Quarter 3 (July to Sept) 2017, UK
Seasonally adjusted
Source: Office for National Statistics
Notes:
- The application of the General Exactly Additive Decomposition of labour productivity means that, as the data presented cover the ‘open period’ where GVA weights are fixed, the components may not sum to the total.
Download this chart Figure 2: Contributions to the growth of output per hour over the year to Quarter 3 (July to Sept) 2017, UK
Image .csv .xlsWhile the growth of labour productivity in Quarter 3 2017 is a welcome break from the UK’s recent experience, the average rate of productivity growth since the economic downturn has been strikingly weak. Figure 3 shows average quarterly growth in output per hour worked for the whole economy and its main industrial groupings. In this figure, the bars show the average quarterly rate of productivity growth over the decade prior to the economic downturn, while the points show the equivalent average growth rates for the period since the trough of labour productivity in Quarter 4 (Oct to Dec) 2008, and over the last year.
Comparing the pre- and post-downturn periods, output per hour growth was weaker in all but one industry – construction – over this period. Labour productivity in manufacturing, which grew by more than 1.0% per quarter on average before the downturn, grew by just 0.3% per quarter on average between Quarter 4 2008 and Quarter 3 2017. Finance and insurance productivity growth also fell markedly, while falls in output per hour growth for non-financial services were more modest.
Figure 3: Average quarterly growth of output per hour worked, selected industries and periods, UK
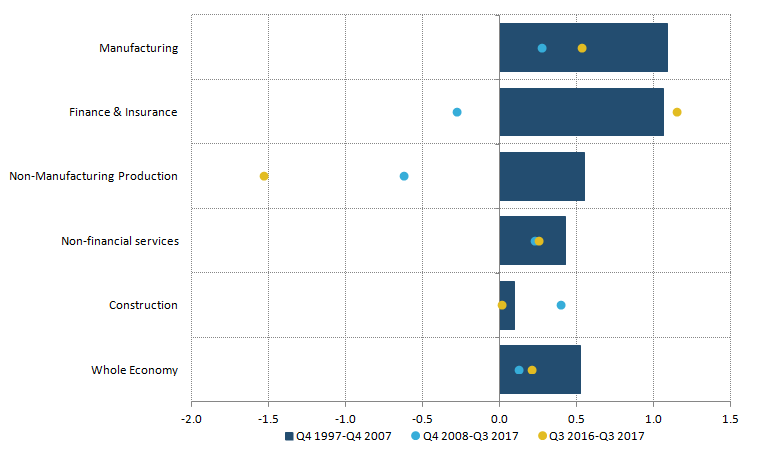
Source: Office for National Statistics
Download this image Figure 3: Average quarterly growth of output per hour worked, selected industries and periods, UK
.png (12.3 kB) .xls (26.6 kB)
Although labour productivity growth over recent quarters may have strengthened, Figure 3 also indicates that the current rates of growth remain lower than the pre-downturn period for many industries. In manufacturing, the rate of output per hour growth in the year to Quarter 3 2017 was half that of its pre-downturn average; in non-financial services the current rate of growth is little changed from the average since 2008, while for construction the weak productivity growth of the pre-downturn period has resumed. At this level of aggregation, only finance and insurance output per hour growth has been above its pre-downturn average. At a more detailed level, only 9 of the 26 industries for which the Office for National Statistics (ONS) publishes headline measures of output per hour have grown at faster rates over the last year than in the decade prior to the economic downturn.
Taken together, these trends mean that the UK’s post-downturn productivity performance has been among the slowest decades of productivity growth since official records began. Figure 4 uses ONS’s official labour productivity series, combined with information from the Bank of England’s “Millennium of Macroeconomic Data”, to show the UK’s rolling 10-year compound average annual rate of output per hour worked growth since 1770. It indicates that growth over the preceding 10 years was 0.15%, 0.13% and 0.18% respectively in the first three quarters of 2017 - amongst the weakest rates since official records began in 1971. On this combined, longer-term record, output per worker growth over a 10-year period has been weaker in recent quarters than at any point since the early-1820s.
Figure 4: Growth in UK output per hour, rolling 10-year compound average annual growth rate, 1770 to 2017

Source: Office for National Statistics, Bank of England
Notes:
- This figure shows the compound average annual growth rate of output per hour for a rolling 10 year window. For example: the growth rate for Q3 2017 is calculated by comparing the level of labour productivity in Q3 2017 with that in Q3 2007.
Download this image Figure 4: Growth in UK output per hour, rolling 10-year compound average annual growth rate, 1770 to 2017
.png (25.8 kB) .xls (45.1 kB)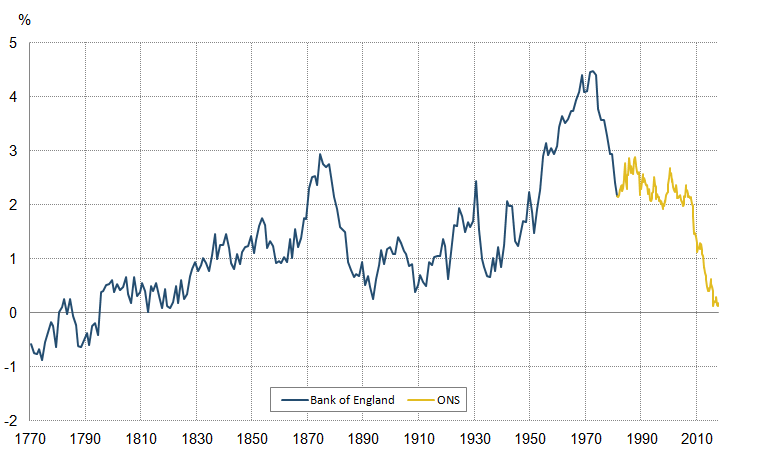
4. Total public service productivity
Alongside these estimates of UK labour productivity, we have also published revised annual estimates of public service productivity and updated experimental estimates of quarterly public service productivity. These measures – which differ from measures of labour productivity by taking account of changes in a range of factor inputs, including labour and capital – show that in Quarter 3 (July to Sept) 2017, productivity for public services increased by 0.7%. This growth follows a contraction of 0.5% in the previous quarter and was mainly the result of a 0.5% fall in inputs, while total public service output increased by 0.2%.
This recent rise in growth reverses a run of quarters of slowing public service productivity growth, which is consistent with longer-term trends. Figure 5 shows the annual growth rates of public service inputs, output and productivity since 1997, combining the latest experimental quarterly estimates – covering Quarter 1 (Jan to Mar) 2016 to Quarter 3 (July to Sept) 2017 – with revised annual estimates for between 1997 and 2015, taken from the Public service productivity estimates: total public service, UK: 2015 release.
Figure 5 shows that growth in public service productivity has been relatively modest in recent years – rising or falling by no more than 1% per year over much of the period since the early 2000s. Consistent with this longer-term trend, productivity for the public services as a whole is estimated to have increased by 0.2% in 2015. This followed growth of 0.2% in 2014 and is the sixth successive year of improving productivity – the longest continuous period of productivity growth for which estimates are available. Figure 5 also shows that this growth in 2015 was a result of faster growth in public service output (up by 1.5%), than public service inputs, which grew by 1.2% over the same period.
Figure 5: Growth in Total UK public service inputs, output and productivity, 1997 to Quarter 3 (July to Sept) 2017

Source: Office for National Statistics
Notes:
- Estimates from 1997 to 2015 are based on the existing annual series.
- Estimates from Quarter 1 (Jan to Mar) 2016 to Quarter 3 (July to Sept) 2017 are based on the experimental quarterly total public service productivity series.
- Estimates for Quarter 1 2016 reflect the growth rate for inputs and output between annualised quarterly estimates for 2015 and Quarter 1 2016
- Estimates of inputs and output for the experimental period are directly seasonally adjusted.
- Estimates of productivity for the experimental period are indirectly seasonally adjusted, calculated using seasonally adjusted inputs and seasonally adjusted output.
- Asterisks (*) and greyed out area show periods where estimates are based on experimental methodology.
Download this image Figure 5: Growth in Total UK public service inputs, output and productivity, 1997 to Quarter 3 (July to Sept) 2017
.png (21.3 kB) .xls (20.5 kB)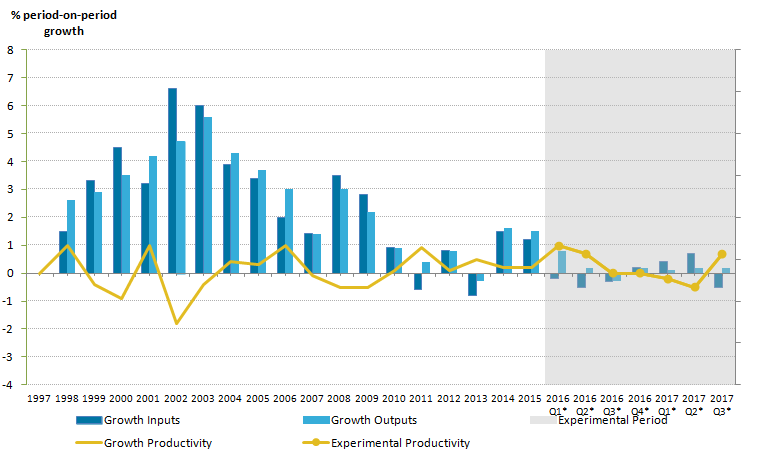
Changes in public service productivity metrics reflect both changes in the productivity performance of different services and changes in the proportion of activity accounted for by different service types. Figure 6 shows the weight of each public service in expenditure terms, which governs the extent to which the productivity of that service affects aggregate public service productivity. It shows that healthcare and education were the largest single areas of public expenditure in 2014 and 2015, giving their productivity performance a relatively large weight in the aggregate.
By contrast, the low share of expenditure accounted for by Social Security Administration and Children’s Social Care mean that the productivity performances of these services play less of a role in aggregate public service productivity. These weights tend to change relatively slowly through time – with healthcare and defence spending increasing slightly as a share of the total over this period.
Figure 6: Expenditure weights by service area, 2014 and 2015, UK
Source: Office for National Statistics
Notes:
- Sum of components may not equal 100 due to rounding.
- Other refers to other government services which includes services such as economic affairs, recreation, and housing.
- Public order and safety includes courts and probation services, prison service and fire service.
Download this chart Figure 6: Expenditure weights by service area, 2014 and 2015, UK
Image .csv .xlsThese variations in the relative size of different service areas and their respective levels of productivity mean that they have made quite different contributions to productivity growth over recent years. Figure 7 shows the annual contribution of each service area (the bars) to the change in UK total public service productivity (represented by the line) from 1998 to 2015. It highlights the importance of healthcare in public service productivity growth in recent years – reflecting both its size and performance. Education also makes a considerable contribution, but has been less consistent than healthcare in recent years.
Figure 7: Contributions to growth of total public service productivity by service area, 1998 to 2015
UK

Source: Office for National Statistics
Notes:
- Individual contributions may not sum to the total due to rounding.
- The above figure does not include indirectly measured output as they do not contribute to productivity due to the assumption their "output-equals-inputs".
- Social Care comprises of Adult Social Care and Children's Social Care.
- POS stands for Public Order and Safety and SSA stands for Social Security Administration.
- Public order and safety includes courts and probation services, prison service and fire service.
Download this image Figure 7: Contributions to growth of total public service productivity by service area, 1998 to 2015
.png (25.6 kB) .xls (36.9 kB)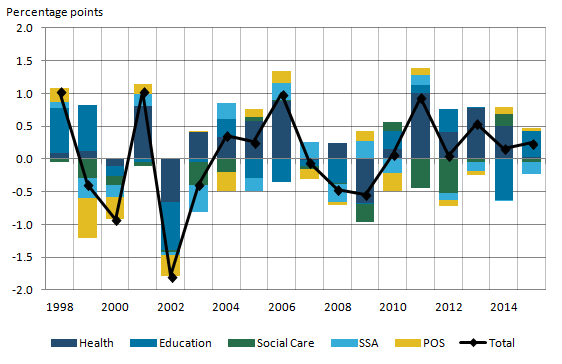
5. Improvements for public service productivity
We are currently undertaking a programme of development to improve estimates of public service productivity across all service areas. As a result, the estimates published as part of this release include a number of improvements to both the data used and the methods applied. Detailed in the articles published alongside this release, these include a new method to quality adjust our measure of the output of the criminal justice system – a sub-component of public order and safety (POS), itself a component of total UK public services.
The article, Quality adjustment of public service public order and safety output: current method, describes the method we currently use to quality adjust elements of public order and safety (POS) output and which is incorporated into estimates of total public service productivity. The purpose of such quality adjustments, in line with the recommendations of the Atkinson Review, is to reflect improvements in the outcomes that can be attributed directly to public service activity, which in a market setting would emerge through changes in quality-adjusted prices.
The new adjustment set out in this article explicitly adjusts the measure of output from the criminal justice system (CJS) accounting for factors such as the rate of recidivism, safety within prisons and the severity of re-offences. It should be noted that this adjustment, as with other public service output quality adjustments, is not included within the UK National Accounts.
The impact of the POS quality adjustment is examined further within the Public service productivity estimates: total public service, UK: 2015 publication, but has varied between 1997 and 2015. Prior to 2010, the quality adjustment contributed positively to total public service quality adjusted output (and productivity), offsetting the decline in the quantity output in POS. However, continued falls in output quantities from POS were combined with lower quality outcomes from 2010 onwards, resulting in the quality adjustment having an overall negative impact over the last six years. This was due largely to decreases in the prison safety adjustment, reflecting increases in the number of reported self-harm and assault incidents in prisons.
Back to table of contents6. Healthcare productivity
Healthcare is the service area that makes the largest positive contribution to public services output, inputs and productivity growth, and is analysed in a separate article, Public service productivity estimates, healthcare: 2015. Figure 8 shows the levels of healthcare output, inputs and productivity indexed to their respective values in 1995 (the lines, left-hand axis) as well as the annual growth rates of these series (the bars, right-hand axis).
Figure 8 shows that public service healthcare productivity increased by 16.6% between 1995 and 2015, meaning that 16.6% more healthcare output was provided for each unit of input in 2015 than in 1995. This increase in productivity is set against a backdrop of substantial increases in both healthcare inputs – which were around twice as high in 2015 than in 1995 – and healthcare output – which was 2.5 times higher in 2015 than 1995.
Figure 8: Public service healthcare output, inputs and productivity indices and growth rates
UK
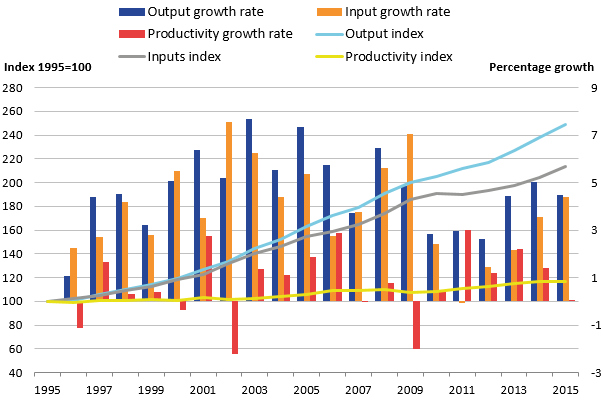
Source: Office for National Statistics
Notes:
- Output is quality adjusted.
Download this image Figure 8: Public service healthcare output, inputs and productivity indices and growth rates
.png (34.0 kB) .xls (21.0 kB)
Although productivity growth in healthcare has been modest over the period as a whole, it has come in fits and starts. Figure 8 shows that healthcare productivity growth was relatively strong in the years 2003 to 2006 and in the years 2011 to 2014, but was relatively modest or falling in the years in between. In the mid-2000s, this faster growth in productivity came alongside historically large increases in output and inputs, while in the years 2011 to 2014, inputs growth was modest by historical standards while output growth continued. These effects combine to give a fluctuating profile to public healthcare productivity growth.
In 2015 – the most recent year for which detailed service-level data are available to support productivity analysis – productivity grew for a sixth consecutive year, although it did so by only 0.1%; this is the slowest rate of growth since 2009. The moderation of productivity growth in 2015 reflects a slight slowdown in output growth and an acceleration of inputs growth. Two important drivers of this latter trend were increased NHS expenditure on purchases of care from non-NHS providers, and lower price growth for most spending on goods and services by NHS trusts and foundation trusts. These effects both helped to push up growth in the volume of inputs.
Slower output growth in 2015, by contrast, was driven by a number of factors, including slower growth in elective inpatients and day cases, and a lower quality adjustment. Accounting for quality in healthcare services added 0.2 percentage points to output growth in 2015, less than the adjustment of 0.6 percentage points in 2014. Removing the quality adjustment results in healthcare productivity falling by 0.2% in 2015; the first fall in non-quality adjusted productivity since 2009.
Back to table of contents