1. Main points
UK labour productivity in Quarter 1 (Jan to Mar) 2018, as measured by output per hour, grew by 0.9% compared with the same quarter a year ago; this growth remains below the average pre-downturn of 2%, continuing the “productivity puzzle”.
For the quarterly estimate, which displays more volatility, productivity fell by 0.4% in Quarter 1 2018 due to strength in employment growth combined with weaker output growth.
Productivity for UK public services for Quarter 1 2018 increased by 1.1% compared with the same quarter a year ago, which can be attributed to a rise of 0.7% in output and a fall of 0.4% in total public service inputs.
New analysis shows that businesses who trade in goods internationally were on average about 70% more productive than businesses that did not, and about 20% more productive after controlling for their size, ownership and industry.
We have launched a new app allowing businesses to compare their productivity performance with others in their industry, which we hope will allow firms to understand their relative productivity and capacity to improve.
2. Labour productivity
Labour productivity fell by 0.4% in Quarter 1 (Jan to Mar) 2018 on the previous quarter, reflecting low output growth (0.2%) coupled with stronger growth in jobs (0.6%) and unchanged average hours. Despite this fall in quarterly growth, compared with the same quarter a year earlier output per hour worked has grown by 0.9% for three quarters in a row. This rate of growth is below that experienced prior to the downturn, which averaged around 2%.
On an output per worker basis, labour productivity was 0.4% down on the quarter and 0.1% lower than the same period in 2017. Both measures remain well below the levels they would have achieved had productivity growth continued at the pre-downturn rate (Figure 1).
Figure 1: Output per hour and output per worker
UK, whole economy, chained volume measure, seasonally adjusted, Quarter 1 (Jan to Mar) 1994 to Quarter 1 (Jan to Mar) 2018
Source: Office for National Statistics
Download this chart Figure 1: Output per hour and output per worker
Image .csv .xlsDifferences in growth between output per worker and output per hour are driven by changes in average hours worked – output per hour is our preferred measure of labour productivity because it accounts for increases (decreases) in labour input that come through increases (decreases) in the average number of hours worked. Accounting for these changes is particularly important in long-term analyses, as average hours have changed substantially over the past four decades (Figure 2).
Figure 2: Average weekly hours worked per worker
UK, whole economy, seasonally adjusted, Quarter 1 (Jan to Mar) 1971 to Quarter 1 (Jan to Mar) 2018
Source: Office for National Statistics
Download this chart Figure 2: Average weekly hours worked per worker
Image .csv .xlsBetween their peak in Quarter 3 (July to Sept) 1973 and their trough in Quarter 2 (Apr to June) 2011, average hours fell by 12.6%, reflecting a long downward trend in average hours. Following this trough, average hours increased until around 2015, due largely to a reduction in leave-taking. More recently, average hours fell by 1% between Quarter 2 2017 and Quarter 4 (Oct to Dec) 2017, raising the question of whether this marks a reversion to the long downward trend or variation around the 32-hour mark, which has been standard since 2015.
While some temporary falls in average hours can be largely attributed to one-off events – such as the extra bank holidays to mark the Millennium or the 2011 Royal Wedding – short-term movements in average hours can be affected by many factors. While some of these (such as regular bank holidays) can be accounted for by seasonal adjustment, others (such as weather and cultural events) cannot. Future analysis will seek to inform users on which specific factors may (and may not) account for the recent fall in average hours.
Back to table of contents3. Public service productivity
Alongside these estimates of labour productivity growth for the whole economy, we have also published updated experimental quarterly and annual estimates of public service productivity as part of this release.
These measures – which differ from measures of labour productivity by taking account of changes in a range of factor inputs, including labour and capital – show that in Quarter 1 (Jan to Mar) 2018, productivity for UK public services increased by 0.5%. This growth, on the back of 0.3% growth in the previous quarter, was the result of a 0.2% rise in output, while total public service inputs fell by 0.4% over the quarter. As a result, total UK public service productivity is now higher than its previous peak in Quarter 3 (July to Sept) 2016.
When compared with the same quarter a year ago, productivity for UK public services increased by 1.1%, reflecting a rise of 0.7% in output coupled with a fall of 0.4% in total public service inputs.
Looking at the longer-term trend, Figure 3 shows the growth in public service productivity since 1997, combining the latest annualised experimental estimates – covering 2016 to 2017 – with estimates for between 1997 and 2015, taken from the Public service productivity estimates: total public service, UK: 2015 release. It suggests that, while maintaining a general upwards trend, growth in public service productivity has experienced some volatility, with UK public service productivity growth estimated to have contracted by 0.6% in 2017 . This marks the first contraction in annual total public service productivity since 2009.
Figure 3: Total UK public service productivity, 1997 to Quarter 1 (Jan to Mar) 2018
Source: Office for National Statistics
Notes:
Estimates from 1997 to 2015 are based on the existing annual series.
Annual estimates from 2016 to 2017 are based on the annualised experimental series. These series are displayed in the third quarter of the year.
Estimates from Quarter 1 (Jan to Mar) 2016 to Quarter 1 (Jan to March) 2018 are based on the experimental quarterly total public service productivity series.
Estimates for Quarter 1 2016 reflect the growth rate between annualised quarterly productivity for 2015 and Quarter 1 2016.
Estimates of productivity for the experimental period are indirectly seasonally adjusted, calculated using seasonally adjusted inputs and seasonally adjusted output.
Download this chart Figure 3: Total UK public service productivity, 1997 to Quarter 1 (Jan to Mar) 2018
Image .csv .xlsIn addition to the experimental quarterly estimates, this release also contains two further analytical articles covering public service productivity:
Historical revisions analysis of quarterly UK public service productivity (Experimental Statistics) and nowcast evaluation
Total public service productivity: understanding inputs
The first carries out revisions analysis of the Quarterly UK public service productivity (Experimental Statistics) estimates, following guidance and methodology from the Organisation for Economic Co-operation and Development (OECD) — specifically, the OECD and Eurostat Guidelines on Revisions Policy and Analysis. It investigates the impact of revisions to and reliability of these experimental estimates over time. Similarly – acting as a short-term, timely indicator of the future path of total UK public service productivity estimates – the article looks at the accuracy of the experimental estimate compared with annual estimates from Public service productivity estimates: total public service, UK releases.
The second article explores an alternative aggregation method to offer further insight into total UK public service inputs, as used in Public service productivity estimates: total public service, UK: 2015.
Historically, estimates of total UK public service inputs have been calculated and broken down by contributions from service areas. From this, we can observe how much each individual service area (such as healthcare or education) contributes towards overall annual growth in public service inputs. However, the aggregation can also be rearranged to offer a breakdown of movements in total public service inputs by component. This allows us to observe, alternatively, how much an input component (such as labour or intermediate consumption) contributes to overall growth in total UK public service inputs, as well as changes and trends between these components.
Back to table of contents4. Trade and productivity
We have published new research on the relationship between businesses and international trade in goods. Combining business-level Office for National Statistics (ONS) survey data with administrative data on trade in goods from HM Revenue and Customs (HMRC), allows us to understand in more detail how the economy trades and the differences between businesses involved in international trade and businesses that are not.
Businesses that declare trade in goods were on average about 70% more productive than businesses that did not, and about 20% more productive after controlling for size, ownership and industry – although there remains a great deal of variation; Figure 4 shows the distributions of labour productivity at businesses by the amount of trade they declare. Businesses with some trade in goods declarations accounted for around 40% of all employment in 2017. However, most of these businesses are small and most trade is concentrated in a few businesses: the 50 largest exporters accounted for 38% of UK exports in 2016.
Figure 4: Distribution of labour productivity by trade in goods status, employment weighted, 2016
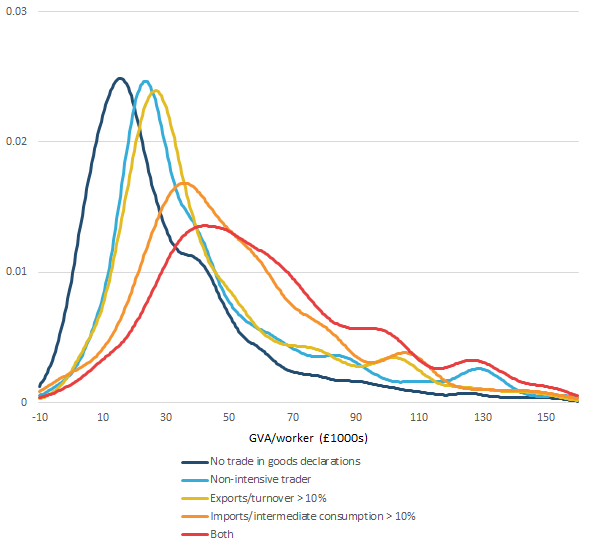
Source: HM Revenue and Customs, Office for National Statistics calculations
Download this image Figure 4: Distribution of labour productivity by trade in goods status, employment weighted, 2016
.png (37.3 kB) .xls (69.6 kB)
5. How productive is your business? – Try out our new interactive productivity benchmarking tool
Alongside our productivity releases, we developed an interactive productivity benchmarking tool to help businesses better understand their productivity. The benchmarking tool allows businesses to calculate their productivity over time and to compare their productivity performance with other businesses in their industry. With only three pieces of information – turnover (or sales), purchases of inputs of goods and services (excluding investment), and their number of workers – this interactive tool calculates a firm’s gross value added per worker and shows the firms position relative to the productivity distribution within its industry.
Back to table of contents6. Productivity development plan
Finally, this is your opportunity to let us know your thoughts on our plans for future improvements and analysis on productivity statistics. Responses can be sent via email to productivity@ons.gov.uk.
Back to table of contents