1. Other pages in this release
Other commentary from the latest labour market data can be found on the following pages:
2. Main points for October to December 2019
The UK employment rate was estimated at a record high of 76.5%, 0.6 percentage points higher than a year earlier and 0.4 percentage points up on the previous quarter.
The UK unemployment rate was estimated at 3.8%, 0.2 percentage points lower than a year earlier and 0.1 percentage point lower than the previous quarter.
The UK economic inactivity rate was estimated at a record low of 20.5%, 0.4 percentage points lower than the previous year and 0.3 percentage points lower than the previous quarter.
It was estimated that there were a record 974,000 people in employment on a “zero-hour contract” in their main job, representing a record 3.0% of all people in employment.
The number of non-UK nationals from the EU working in the UK was estimated at 2.31 million, 36,000 higher than the previous year, although the level has been broadly flat for the last three years.
The data in this bulletin come from the Labour Force Survey, a survey of households. It is not practical to survey every household each quarter, so these statistics are estimates based on a large sample.
3. Employment
Figure 1: The employment rate for all people increased by 0.6 percentage points on the year to a record high of 76.5%
UK employment rates (aged 16 to 64 years), seasonally adjusted, between January to March 1971 and October to December 2019
Source: Office for National Statistics – Labour Force Survey
Download this chart Figure 1: The employment rate for all people increased by 0.6 percentage points on the year to a record high of 76.5%
Image .csv .xlsEmployment measures the number of people aged 16 years and over in paid work. The employment rate is the proportion of people aged between 16 and 64 years who are in paid work.
Estimated employment rates for people aged between 16 and 64 years have generally been increasing since early 2012. Recent increases have largely been driven by increases in the employment rate for women (as seen in Figure 1).
For October to December 2019:
the estimated employment rate for people was at a record high of 76.5%; this is 0.6 percentage points up on the year and 0.4 percentage points up on the quarter
the estimated employment rate for men was 80.6%; this is 0.2 percentage points up on the year and 0.3 percentage points up on the quarter
the estimated employment rate for women was at a record high of 72.4%; this is 1.0 percentage point up on the year and 0.6 percentage points up on the quarter
The increase in the employment rate for women in recent years is partly a result of changes to the State Pension age for women, resulting in fewer women retiring between the ages of 60 and 65 years. However, since the equalisation of the State Pension age, the employment rate for women has continued to rise.
Estimates for October to December 2019 show a record 32.93 million people aged 16 years and over in employment, 336,000 more than a year earlier. This annual increase was mainly driven by full-time workers (up 381,000 on the year to a record high of 24.42 million), women in employment (up 298,000 to a record high of 15.61 million) and people aged 50 to 64 years (up 226,000 to a record high of 9.31 million). The annual increase for women working full-time (up 262,000 to a record high of 9.31 million) was the largest since February to April 2017.
There was a 180,000 increase in employment on the quarter. This was, again, mainly driven by quarterly increases for full-time workers (up 203,000; this is the largest increase since March to May 2014) and for women in employment (up 150,000; this is the largest increase since February to April 2014). The quarterly increase for women working full-time (also up 150,000) was the largest since November 2012 to January 2013.
Figure 2: The number of women working full-time has increased by 9.5% since October to December 2015; this is more than double the percentage increase for men
UK employment percentage growth for full-time and part-time men and women (aged 16 years and over), seasonally adjusted, between October to December 2015 and October to December 2019
Source: Office for National Statistics – Labour Force Survey
Download this chart Figure 2: The number of women working full-time has increased by 9.5% since October to December 2015; this is more than double the percentage increase for men
Image .csv .xlsIncreases in the number of full-time workers have been driving increases in employment in recent years, while the number of part-time workers has been relatively flat (as seen in Figure 2).
The rate of growth for women working full-time has been consistently higher than for men over the last few years, with women being the main drivers of the strong increase in full-time employment. For October to December 2019, the number of women working full-time increased by 9.5% compared with the same three months in 2015, while the number of men increased by 3.6% over the same period. In comparison, the number of women working part-time increased by 1.4% and the number of men working part-time decreased by 1.4%.
Figure 3: Over the last year, the number of employees increased by 136,000 and the number of self-employed people increased by 187,000
UK employees and self-employed people annual changes (aged 16 years and over), seasonally adjusted, between October to December 2009 and October to December 2019
Source: Office for National Statistics – Labour Force Survey
Download this chart Figure 3: Over the last year, the number of employees increased by 136,000 and the number of self-employed people increased by 187,000
Image .csv .xlsLooking at the estimates for October to December 2019 by type of employment:
there were a record 27.73 million paid employees (84.2% of all people in employment), 136,000 more than a year earlier
there were a record 5.03 million self-employed people (15.3% of all people in employment), 187,000 more than a year earlier
Since the latter half of 2012, the annual increases for employees have generally been greater than for the self-employed (Figure 3). In recent periods, this trend has generally reversed, with self-employed workers having a greater annual increase than employees in October to December 2019. The annual increase in self-employed women (up 106,000 to a record high of 1.71 million) was the largest since July to September 2016.
These estimates for paid employees and self-employed people make up over 99% of all people in employment in the UK. The total employment figure also includes two other minor categories as explained in the guide to labour market statistics.
Figure 4: Women aged 25 to 64 years have been the main drivers of the increase in the employment rate over the last five years
UK employment rates change by age and sex, seasonally adjusted, between October to December 2014 and October to December 2019
Source: Office for National Statistics – Labour Force Survey
Download this chart Figure 4: Women aged 25 to 64 years have been the main drivers of the increase in the employment rate over the last five years
Image .csv .xlsThose aged 25 to 64 years have been driving increases in employment rates in recent years, with the largest increase seen for women. In comparison, employment rates have been relatively flat for younger and older people over the last five years. This is partly because of the different way in which full-time students interact with the labour market (Figure 4).
Zero-hour contracts
Figure 5: The number of people on “zero-hour contracts” reached a record high of 974,000
Number (thousands) of people in employment reporting they are on a “zero-hour contract” in their main job, UK, not seasonally adjusted, October to December, each year 2000 to 2019, April to June, each year 2014 to 2019
Source: Office for National Statistics – Labour Force Survey
Notes:
- The number of people who are shown as on a “zero-hour contract” at any point in time will be affected by whether people know they are on a “zero-hour contract” and how aware they are of the concept. The large increase seen between 2012 and 2013 is likely the result of increased media coverage of “zero-hour contracts” at that time.
- Estimates presented are not seasonally adjusted, so comparisons of change should only be made based on the same period each year.
Download this chart Figure 5: The number of people on “zero-hour contracts” reached a record high of 974,000
Image .csv .xlsThere is no single agreed definition of what “zero-hour contracts” are. While some contracts are explicitly called “zero-hour contracts”, there are other definitions available and used in published statistics. The common element of the definitions is the lack of a guaranteed minimum number of hours.
In October to December 2019, it was estimated that there were a record 974,000 people in employment on a “zero-hour contract” in their main job, representing a record 3.0% of all people in employment. This was 130,000 more than for the same period a year earlier (Figure 5). More detailed estimates are available in dataset EMP17.
UK and non-UK workers
Figure 6: The number of EU nationals working in the UK has generally increased over the last 20 years but has been broadly flat for the last three years
Non-UK nationals (aged 16 years and over) working in the UK, not seasonally adjusted, between October to December 1999 and October to December 2019
Source: Office for National Statistics – Labour Force Survey
Notes:
- The EU series are based on the current membership of the EU. For example, Poland is included in the EU series throughout the entire time series, although Poland did not join the EU until 2004.
- Estimates presented are not seasonally adjusted, so comparisons of change should only be made based on the same period each year.
Download this chart Figure 6: The number of EU nationals working in the UK has generally increased over the last 20 years but has been broadly flat for the last three years
Image .csv .xlsBetween early 2009 and early 2018, the number of non-UK nationals from outside the EU working in the UK was broadly flat (at around 1.2 million); however, there has been a slight increase since, with the level at 1.34 million in October to December 2019.
In contrast, the number of non-UK nationals from the EU working in the UK has generally increased, reflecting the admission of Poland and other East European countries to the EU in 2004. However, the series has been broadly flat since the latter half of 2016, at around 2.3 million.
Looking at employment by nationality between October to December 2018 and October to December 2019:
the estimated number of UK nationals working in the UK increased by 227,000 to a record high of 29.33 million
the estimated number of non-UK nationals from the EU working in the UK increased by 36,000 to 2.31 million
the estimated number of non-UK nationals from outside the EU working in the UK increased by 49,000 to 1.34 million
Hours worked
Since estimates began in 1971, total hours worked by women have generally increased, reflecting increases in both the employment rate for women and the UK population. In contrast, total hours worked by men have been relatively stable, with the level in October to December 2019 being close to the level in January to March 1971 (623 and 628 million hours, respectively). This is because falls in the employment rate for men, and increases in the share of part-time working, have been roughly offset by population increases.
Between October to December 2018 and October to December 2019, total actual weekly hours worked in the UK increased by 0.8% (to 1.05 billion hours), while average actual weekly hours decreased by 0.2% (to 31.9 hours). Therefore, the annual increase in total hours was mainly driven by the 1.0% increase in employment over the last year.
In October to December 2019, men worked an average of 36.0 hours per week, a decrease of 0.3 hours compared with a year earlier. In contrast, the average actual weekly hours for women increased by 0.2 hours over the year, to 27.4 hours. This increase in average hours for women, combined with the increase in employment, has resulted in an annual increase in total actual weekly hours worked of 8.1 million hours.
Back to table of contents4. Unemployment
Figure 7: Unemployment rates have generally been falling for the last six years
UK unemployment rates (aged 16 years and over), seasonally adjusted, between January to March 1971 and October to December 2019
Source: Office for National Statistics – Labour Force Survey
Download this chart Figure 7: Unemployment rates have generally been falling for the last six years
Image .csv .xlsUnemployment measures people without a job who have been actively seeking work within the last four weeks and are available to start work within the next two weeks. The unemployment rate is not the proportion of the total population who are unemployed. It is the proportion of the economically active population (those in work plus those seeking and available to work) who are unemployed.
Estimated unemployment rates for both men and women aged 16 years and over have generally been falling since late 2013 but have levelled off in recent periods (as seen in Figure 8).
For October to December 2019:
the estimated UK unemployment rate for all people was 3.8%; this is 0.2 percentage points lower than a year earlier and 0.1 percentage points lower than the previous quarter
the estimated UK unemployment rate for men was 3.9%; this is 0.2 percentage points lower than a year earlier and 0.1 percentage points lower than the previous quarter
the estimated UK unemployment rate for women was 3.6%; this is down 0.3 percentage points on the year but largely unchanged on the quarter
Figure 8: The steady fall in unemployment rates for men and women over the last few years has slowed in recent periods
UK unemployment rates (aged 16 years and over), seasonally adjusted, between October to December 2014 and October to December 2019
Source: Office for National Statistics – Labour Force Survey
Download this chart Figure 8: The steady fall in unemployment rates for men and women over the last few years has slowed in recent periods
Image .csv .xlsBetween October to December 2014 and October to December 2019 (Figure 8):
the estimated unemployment rate for all people fell from 5.7% to 3.8%
the estimated unemployment rate for men fell from 6.0% to 3.9%
the estimated unemployment rate for women fell from 5.4% to 3.6%
For October to December 2019, an estimated 1.29 million people were unemployed. This is 73,000 fewer than a year earlier and 580,000 fewer than five years earlier.
Figure 9: Long-term unemployment continues to fall
Unemployment in the UK by duration (aged 16 years and over), seasonally adjusted, between October to December 2014 and October to December 2019
Source: Office for National Statistics – Labour Force Survey
Download this chart Figure 9: Long-term unemployment continues to fall
Image .csv .xlsLooking in more detail at this fall of 580,000 over the last five years (Figure 9):
the estimated number of people unemployed for up to six months fell by 151,000 to 779,000 but has been relatively stable for the last two years
for those unemployed for over 6 and up to 12 months, the number fell by 82,000 to 220,000, but has been broadly flat for the last three years
the largest fall was for long-term unemployment (those unemployed for over one year), which was down 347,000 to 291,000, with the level for men reaching a record low of 173,000
5. Economic inactivity
Economic inactivity measures people without a job but who are not classed as unemployed because they have not been actively seeking work within the last four weeks and/or they are unable to start work within the next two weeks. Our headline measure of economic inactivity is for those aged between 16 and 64 years.
Since comparable records began in 1971, the economic inactivity rate for all people aged between 16 and 64 years has generally been falling (although it increased during recessions). This is because of a gradual fall in the economic inactivity rate for women (as seen in Figure 10). Over recent years, the economic inactivity rate for men has been relatively flat.
Figure 10: The overall inactivity rate for people aged between 16 and 64 years was at a record low of 20.5%, down 0.4 percentage points on the year
UK economic inactivity rate (all people aged 16 to 64 years), seasonally adjusted, between January to March 1971 and October to December 2019
Source: Office for National Statistics – Labour Force Survey
Download this chart Figure 10: The overall inactivity rate for people aged between 16 and 64 years was at a record low of 20.5%, down 0.4 percentage points on the year
Image .csv .xlsFor people aged between 16 and 64 years, for October to December 2019:
the estimated economic inactivity rate for all people was at a record low of 20.5%; this is down 0.4 percentage points on the year and down 0.3 percentage points on the quarter
the estimated economic inactivity rate for men was 16.1%; this is largely unchanged on the year but down 0.1 percentage point on the quarter
the estimated economic inactivity rate for women was at a record low of 24.8%; this is down 0.8 percentage points on the year and down 0.6 percentage points on the quarter
Estimates for October to December 2019 show 8.48 million people aged between 16 and 64 years not in the labour force (economically inactive). This was 155,000 fewer than a year earlier and 587,000 fewer than five years earlier. The annual decrease was driven by women, with the level down by 163,000 to reach a record low of 5.16 million.
Figure 11: The number of people who are inactive because they are looking after family or home is at a record low
Inactive people (aged 16 to 64 years) by reason in the UK, seasonally adjusted, between March to May 1993 and October to December 2019
Source: Office for National Statistics – Labour Force Survey
Download this chart Figure 11: The number of people who are inactive because they are looking after family or home is at a record low
Image .csv .xlsLooking in more detail at the estimated fall of 587,000 in economic inactivity over the last five years, the category showing the largest decrease was people looking after the family or home (down by 418,000 to a record low of 1.89 million).
The fall was largely driven by women, with a decrease of 478,000. This reflects changes to the State Pension age, resulting in fewer women retiring between the ages of 60 and 65 years, as well as more women in younger age groups participating in the labour market driving the decrease in numbers looking after the family or home.
When the series began in March to May 1993, looking after family and home was the most common reason for inactivity, comprising 35.3% of the total number of economically inactive people. By October to December 2019, the share had decreased to 22.2% and it was the third most common reason, behind students (26.6%) and the long-term sick (24.5%).
Back to table of contents6. Labour market flows
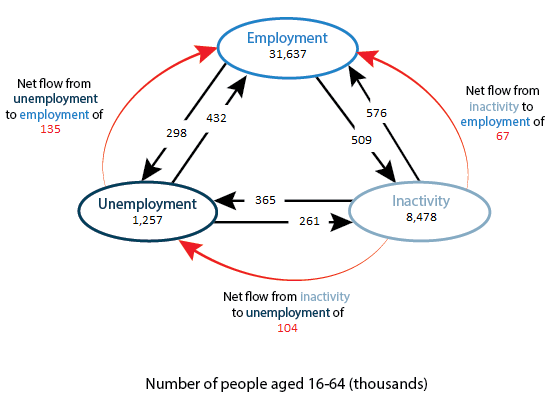
Figure 12: There was a net flow of 135,000 from unemployment to employment
Flows between employment, unemployment and economic inactivity between July to September 2019 and October to December 2019, UK, seasonally adjusted
Source: Office for National Statistics – Labour Force Survey
Notes:
- Improvements to the weighting methodology used in the Labour Force Survey longitudinal datasets have been introduced and flows estimates have been revised on this basis back to April to June 2012. Information about the change that has been made and the impact this has on LFS flows estimates in dataset X02 are available on the Office for National Statistics (ONS) website.
Download this image Figure 12: There was a net flow of 135,000 from unemployment to employment
.png (34.6 kB)
Looking at estimates of flows between employment, unemployment and economic inactivity between July to September 2019 and October to December 2019, there was a net flow of:
135,000 people from unemployment to employment
104,000 people from economic inactivity to unemployment
67,000 people from economic inactivity to employment
These estimates of labour market flows have not been designated as National Statistics.
7. Employment in the UK data
Employment, unemployment and economic inactivity
Dataset A05 SA | Updated 18 February 2020
Estimates of UK employment, unemployment and economic inactivity broken down into age bands.
Full-time, part-time and temporary workers
Dataset EMP01 SA | Updated 18 February 2020
Estimates of UK employment including a breakdown by sex, type of employment, and full-time and part-time working.
Actual weekly hours worked
Dataset HOUR01 SA | Updated 18 February 2020
Estimates for the hours that people in employment work in the UK.
Unemployment by age and duration
Dataset UNEM01 SA | Updated 18 February 2020
Estimates of unemployment in the UK including a breakdown by sex, age group and the length of time people are unemployed.
Economic inactivity by reason
Dataset INAC01 SA | Updated 18 February 2020
Estimates of those not in the UK labour force measured by the reasons given for inactivity.
Labour Force Survey sampling variability
Dataset A11 | Updated 18 February 2020
Labour Force Survey sampling variability (95% confidence intervals).
8. Glossary
Actual and usual hours worked
Statistics for usual hours worked measure how many hours people usually work per week. Compared with actual hours worked, they are not affected by absences and so can provide a better measure of normal working patterns. For example, a person who usually works 37 hours a week but who was on holiday for a week would be recorded as working zero actual hours for that week, while usual hours would be recorded as 37 hours.
Economic inactivity
People not in the labour force (also known as economically inactive) are not in employment but do not meet the internationally accepted definition of unemployment because they have not been seeking work within the last four weeks and/or are unable to start work in the next two weeks. The economic inactivity rate is the proportion of people aged between 16 and 64 years who are not in the labour force.
Employment
Employment measures the number of people in paid work or who had a job that they were temporarily away from (for example, because they were on holiday or off sick). This differs from the number of jobs because some people have more than one job. The employment rate is the proportion of people aged between 16 and 64 years who are in employment. A more detailed explanation is available in our guide to labour market statistics.
Unemployment
Unemployment measures people without a job who have been actively seeking work within the last four weeks and are available to start work within the next two weeks. The unemployment rate is not the proportion of the total population who are unemployed. It is the proportion of the economically active population (that is, those in work plus those seeking and available to work) who are unemployed.
A more detailed glossary is available.
Back to table of contents9. Measuring the data
This bulletin relies on data collected from the Labour Force Survey (LFS), the largest household survey in the UK.
More quality and methodology information on strengths, limitations, appropriate uses, and how the data were created is available in the LFS QMI.
The LFS performance and quality monitoring reports provide data on response rates and other quality-related issues for the LFS.
After EU withdrawal
As the UK leaves the EU, it is important that our statistics continue to be of high quality and are internationally comparable. During the transition period, those UK statistics that align with EU practice and rules will continue to do so in the same way as before 31 January 2020.
After the transition period, we will continue to produce our labour market statistics in line with the UK Statistics Authority’s (UKSA’s) Code of Practice for Statistics and in accordance with International Labour Organization (ILO) definitions and agreed international statistical guidance.
Back to table of contents10. Strengths and limitations
The figures in this bulletin come from the Labour Force Survey (LFS), which gathers information from a sample of households across the UK rather than from the whole population. The sample is designed to be as accurate as possible given practical limitations such as time and cost constraints. Results from sample surveys are always estimates, not precise figures. This can have an impact on how changes in the estimates should be interpreted, especially for short-term comparisons.
As the number of people available in the sample gets smaller, the variability of the estimates that we can make from that sample size gets larger. Estimates for small groups (for example, unemployed people aged between 16 and 17 years), which are based on small subsets of the LFS sample, are less reliable and tend to be more volatile than for larger aggregated groups (for example, the total number of unemployed people).
In general, changes in the numbers (and especially the rates) reported in this bulletin between three-month periods are small and are not usually greater than the level that can be explained by sampling variability. Short-term movements in reported rates should be considered alongside longer-term patterns in the series and corresponding movements in other sources to give a fuller picture.
Comparability
The data in this bulletin follow internationally accepted definitions specified by the International Labour Organization (ILO). This ensures that the estimates for the UK are comparable with those for other countries.
Further information is available in A guide to labour market statistics.
| Level | Sampling variability of level (*) | Change on quarter | Sampling variability of change on quarter (*) | Change on year | Sampling variability of change on year (*) | |
|---|---|---|---|---|---|---|
| Employment (000s, aged 16 and over) | 32,934 | ± 177 | 180 | ± 151 | 336 | ± 238 |
| Employment rate (aged 16 to 64) | 76.5% | ± 0.4 | 0.4 | ± 0.3 | 0.6 | ± 0.5 |
| Average weekly hours | 31.9 | ± 0.2 | -0.3 | ± 0.2 | -0.1 | ± 0.3 |
| Unemployment (000s, aged 16 and over) | 1,290 | ± 69 | -16 | ± 75 | -73 | ± 97 |
| Unemployment rate (aged 16 and over) | 3.8% | ± 0.2 | -0.1 | ± 0.2 | -0.2 | ± 0.3 |
| Economically active (000s, aged 16 and over) | 34,223 | ± 169 | 164 | ± 147 | 263 | ± 229 |
| Economic activity rate (aged 16 to 64) | 79.5% | ± 0.4 | 0.3 | ± 0.3 | 0.4 | ± 0.5 |
| Economically inactive (000s, aged 16 to 64) | 8,478 | ± 154 | -138 | ± 133 | -155 | ± 208 |
| Economic inactivity rate (aged 16 to 64) | 20.5% | ± 0.4 | -0.3 | ± 0.3 | -0.4 | ± 0.5 |
| Redundancies (000s, aged 16 and over) | 109 | ± 19 | -10 | ± 28 | 17 | ± 26 |