Table of contents
- Main points
- Overview
- Background
- Key terms
- Changes to methodology
- Capital stocks and consumption of fixed capital in detail
- Analysis by institutional sector
- Analysis by type of asset
- Analysis by industry
- Capital output ratio analysis
- Net capital stocks per employee
- International comparison
- Background notes
- Methodology
1. Main points
This is the second publication of capital stocks estimates since 2010. Estimates of capital stocks and consumption of fixed capital are now produced using a new methodology. Users are advised to read the detailed articles about these changes published in June and July 2014 as well as the background notes of this release
The estimates in this release cover the period 1997 to 2013. All data referred to in this bulletin are annual estimates of chained volume measures (CVM), unless specified otherwise
The United Kingdom’s (UK) net capital stock was estimated at £3.9 trillion, at the end of 2013. Between 1998 and 2007, average annual growth was 1.9% but this fell between 2008 and 2013 to 1.1%. Since 1997, estimates of net capital stocks increased by £875 billion (29%)
Consumption of fixed capital for the UK was estimated at £219 billion in 2013, an increase of £64 billion (41%) compared with 1997. However, the 2013 estimate remains £8 billion (4%) below the 2007 peak for this series, having fallen during the economic downturn period between 2008 and 2009
Services industries held an estimated 79% of total net capital stocks at the end of 2013
2. Overview
This is the second publication of capital stock estimates using the methodological changes as detailed in methodological changes to the estimation of capital stocks and consumption of fixed capital and impact of the methodological changes to the estimation of capital stocks and consumption of fixed capital articles published in June and July 2014. The background notes of this release contain further information on understanding and using these data. Users may also find the definitions in the 'key terms' section useful.
The estimates in this release cover the period 1997 to 2013. Estimates for 2014 will be published in the next release in August 2015. Estimates for periods before 1997 are not yet available. ONS plans to begin the work to re-instate these estimates to provide users with a longer time series during 2015.
All data referred to in this bulletin are annual estimates of chained volume measures (CVM). These are time series put in real terms by computing the volume of each year in the prices of the preceding year. The data are then chained together to obtain a time series of production figures from which the effect of price changes have been removed. The CVMs in this publication are referenced to 2011. Current Price estimates are available in the tables and time series dataset.
This bulletin is split into five main sections:
- Background
- Key terms
- Changes to methodology
- Capital stocks and consumption of fixed capital in detail
- Background notes
3. Background
Capital stocks and the consumption of fixed capital are estimated using the Perpetual Inventory Method (PIM). The PIM models capital stocks and capital consumption from estimates of gross fixed capital formation (GFCF). The PIM is described in greater detail in the background notes of this release.
Estimates of GFCF and its breakdowns by sector and asset (from 1997) are published separately in the quarterly Business Investment Statistical Bulletin.
Figure 1 shows how gross capital stocks are calculated using the PIM. The cumulative sum of net investment in assets (GFCF), i.e. the capital stock, is calculated by adding investment this period to the capital stock in the previous period and subtracting the value of assets which have reached the end of their useful life or that have been scrapped as a result of bankruptcy. The PIM replicates this process for each industry and asset combination for every year of data in the model.
Figure 1: How gross capital stocks are calculated using the perpetual inventory method

Download this image Figure 1: How gross capital stocks are calculated using the perpetual inventory method
.png (9.2 kB)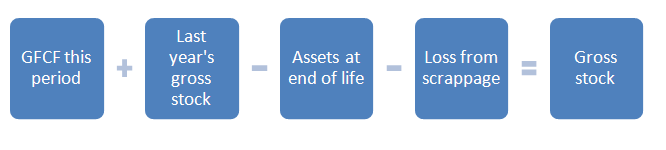
Figure 2 shows how net capital stocks are calculated. This is also a 'stock' measure and estimates the value at the end of the year. The same process that is used for the estimation of gross stocks is used; however, an additional component for depreciation (for example, from wear and tear) is subtracted from the gross value. This can be thought of as the quantity of assets 'used up' in a year. At the end of an asset's service life, its whole value has been 'used up', and it no longer contributes to the net (or gross) stock level.
Figure 2: How net capital stocks are calculated

Download this image Figure 2: How net capital stocks are calculated
.png (7.5 kB)
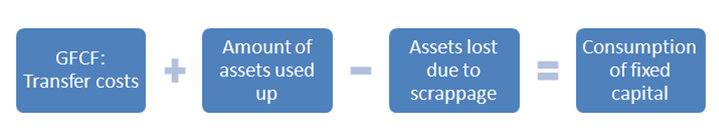
The consumption of fixed capital is an estimate of a 'flow'. It represents the change in the value of assets during the year. Figure 3 shows that it is made up of the sum of transfer costs (costs associated with purchasing or disposing of an asset) from GFCF, the depreciation or loss in value of assets due to usual wear and tear as well as the value of assets lost when companies go bankrupt. This value is calculated for each year within the model.
Figure 3: How the consumption of fixed capital is calculated
Download this image Figure 3: How the consumption of fixed capital is calculated
.png (37.5 kB)
Further explanations of the terms used are available in the key terms section of this release. Capital stocks and the consumption of fixed capital estimates are produced annually and used by ONS in the compilation of the UK National and Economic Accounts and Public Sector Finances. They are also used by the Bank of England (BoE), the Office for Budgetary Responsibility (OBR), Her Majesty's Treasury (HMT), the Department for Business, Innovation and Skills (BIS), the Statistical Office of the European Union (Eurostat), business and research communities, educational communities, the media and the general public. These estimates are used to monitor economic performance and inform monetary and fiscal policy decisions, as well as for international comparisons.
Back to table of contents4. Key terms
Capital stocks represent the value of all fixed assets used in production in the economy that are still in use, such as machinery, dwellings and intellectual property products, formerly intangible fixed assets, such as software
Economic assets are a store of value representing the benefits the economic owner will get by holding or using the asset over a period of time
Fixed assets are non-financial items which are used repeatedly in the process of production for more than one year. For example, a machine on a production line or software used in production
Gross capital stocks tell us how much the economy’s assets would cost to buy again as new, or their replacement cost. All of the fixed assets in the economy, that are still productive and in use, are added up to calculate this, regardless of how old they are or how much they may have deteriorated since they were first used. This measure shows the value at the end of the year. This is mainly calculated as an intermediate step towards net capital stocks but individually provides a broad indicator of the productive capacity of an economy
Net capital stocks show the market value of fixed assets. The market value is the amount that the assets could be sold for, which will be lower than the value of gross capital stocks. This reflects the fact that the assets will have had some wear and tear compared to a new asset. This measure shows the value at the end of the year. This measure is used in preference to gross capital stocks as it provides a valuation of assets in the economy after the removal of depreciation
The consumption of fixed capital is the decline in the value, or depreciation, of fixed assets in the economy over a time period. The decline in value can be due to wear and tear, assets no longer being used, or normal accidental damage. It can also be described as the quantity (or value) of the capital stocks which is used up in that period. Whilst these data are interesting, their primary purpose is to move from various gross measures of economic flows to the corresponding “net” variable, in particular for production and income (net domestic product, net value added) and a number of demand variables such as net investment
Gross fixed capital formation (GFCF) is the acquisition less disposals of produced fixed assets; that is assets intended for use in the production of other goods and services for a period of more than a year. Acquisition includes both purchases of assets (new or second-hand) and the construction of assets by producers for their own use. New buildings and dwellings, and major improvements to buildings and dwellings are included in GFCF, but the acquisition and disposal of existing buildings and dwellings are not
5. Changes to methodology
There have been a number of improvements and key changes to the methodology for estimating capital stocks and the consumption of fixed capital during 2014.
The most significant changes were incorporated into the Capital Stocks and Consumption of Fixed Capital, 2013 publication and can be summarised as:
changes to the estimation of GFCF
the inclusion of cultivated biological resources
new data sources, changes to the Standard Industrial Classification (SIC)
changes to the level of detail in the PIM, changes to the methods for estimation of breakdowns by institutional sector
changes to the deflation methodology
A full explanation of these changes, including assessments of impact are available in the articles methodological changes to the estimation of capital stocks and consumption of fixed capital and impact of the methodological changes to the estimation of capital stocks and consumption of fixed capital.
Estimates in this release have been compiled under the European System of Accounts 2010, for the first time, in compliance with the UK's legal obligations in producing the National Accounts. Other changes have also been implemented in this release, which is consistent with the UK Annual National Accounts (Blue Book) 2014. The estimates in this release have been revised from Q1 1997 to the latest period.
The key changes to the compilation of the estimates are:
the capitalisation of research and development (R&D), which for the first time has been recorded as GFCF instead of intermediate consumption
the inclusion of military weapons systems
improvements to the treatment of the cost of decommissioning production plants such as nuclear power plants
improvements to the estimation of own account construction in GFCF
the inclusion of small tools used in production within the GFCF definition
As a result of the expansion of the definition of GFCF, both GFCF and capital stocks have increased in level, compared with estimates compiled under ESA95. Research and development adds between £39 and £62 billion annually (in CVM) between 1997 and 2013. It accounts for 1.6% for the total economy in 2013.
The inclusion of military weapons systems has also had an impact on capital stock levels. It has added £29 to £45 billion per year in CVM, between 1997 and 2013. Weapons are a component of the asset ‘ICT, machinery, equipment and weapons systems’ which was previously titled ‘other machinery and equipment’.
Note that under ESA10, intangible assets have been renamed 'intellectual property products' (IPP). Research and development is a component asset of IPP.
As previously announced in the July 2014 publication there are still areas or improvement to be implemented. These include:
- the production of estimates for General, Central and Local Government using a new methodology
- restoring consistency between the estimates of consumption of fixed capital, gross capital stocks and net capital stocks
- providing an asset breakdown for institutional sectors S.11001 and S.11PR
- fully introducing new data for Non-profit Institutions Serving Households (NPISH)
Further information about these changes is included in Section 4 of the background notes.
Consistency with other publications
These estimates are consistent with the 2014 United Kingdom National Accounts (Blue Book) and produced using Blue Book 2014 GFCF data (see Explaining UK Investment Estimates: past, present & future). These data include European System of Accounts (ESA) 2010 changes.
What do you think?
ONS are striving to improve this release and its associated commentary. We would welcome any feedback you may have, and would be particularly interested in knowing how you make use of these data to inform your work. Please contact us via email: gcf@ons.gov.uk or telephone Wesley Harris on +44 (0)1633 455250.
Back to table of contents6. Capital stocks and consumption of fixed capital in detail
Estimates of capital stocks and the consumption of fixed capital tend to follow a relatively smooth path over time, because they are recorded as accumulated balances. Nevertheless, in cases where the asset price or GFCF have changed significantly, changes in the rate of increase or decrease in the capital stock can be observed.
Although the level of fixed GFCF investment fell sharply during the economic downturn, by 4.7% in 2008 and 14.4% in 2009, capital stock growth remained positive during these years. This was because despite a sharp fall, the level (or flow) of fixed GFCF investment remained positive and above the level of depreciation in the capital stock. This meant that both gross and net capital stock continued to grow in 2008 and 2009, albeit at slower rates compared with the decade prior to the downturn.
Estimates of gross and net capital stocks, and the consumption of fixed capital are available in both current price (CP) and CVMs in the accompanying time series dataset and in the publication tables.
Gross capital stocks
CVM of UK gross capital stocks was estimated at £6.6 trillion at the end of 2013, an increase of 35% since 1997 (equivalent to 1.9% growth per annum). In the decade prior to the economic downturn, gross capital stock rose on average by 2.1% per annum, however this slowed to 1.5% per annum between 2008 and 2009, and declined further to 1.3% growth in 2011. In subsequent periods, gross capital stock growth increased, but, on average, remained below rates seen prior to the downturn (see Table 1).
Table 1: Average annual growth in the capital stock
| Reference year: 2011 Coverage: United Kingdom | |||||||
| 1998-2007 | 2008-2009 | 2010-2013 | 1998-2013 | ||||
| Chained Volume Measures (%) | |||||||
| Gross stock | 2.1% | 1.5% | 1.5% | 1.8% | |||
| Net stock | 1.9% | 1.1% | 1.1% | 1.6% | |||
| Consumption of fixed capital | 3.9% | -4.1% | 1.2% | 2.2% | |||
| Source: Capital Stocks, Consumption of Fixed Capital, 2014. Office for National Statistics. | |||||||
Download this table Table 1: Average annual growth in the capital stock
.xls (54.8 kB)Net capital stocks
Net capital stocks account for the depreciation in assets, so both the level and the rate of increase in the net stock will be lower compared with gross stock (Figure 4). CVMs of UK net capital stocks were estimated at £3.9 trillion at the end of 2013, an increase of 29% since 1997 (equivalent to 1.6% growth per annum).
As with the gross capital stock estimates, net capital stock growth also slowed over 2008 and 2009, to an annual average growth rate of 0.9% compared with 1.9% annual growth prior to the downturn. Growth in subsequent years has remained comparatively subdued. Net stock rose by 1.2% and 1.4% in 2012 and 2013 respectively.
Figure 4: Gross and net capital stocks, 1997 to 2013, at chained volume measures
Reference year: 2011 Coverage: United Kingdom
Source: Quarterly Survey of Capital Expenditure - Office for National Statistics
Download this chart Figure 4: Gross and net capital stocks, 1997 to 2013, at chained volume measures
Image .csv .xlsConsumption of fixed capital
At the end of 2013, UK consumption of fixed capital was estimated at £219 billion, an increase of 41% since 1997 (equivalent to 2.2% growth per annum). The capitalisation of research and development was the main reason for the upward change to consumption of fixed capital since the previous publication.
In contrast with the gross and net capital stock estimates, capital consumption is a flow variable and showed negative growth during the economic downturn. The level of consumption of fixed capital peaked in 2007 at £227 billion, but fell by 6.0% and 2.3% in 2008 and 2009 respectively to £209 billion in 2009. This was caused by a sharp fall in household transfer costs (costs associated with purchasing or disposing of an asset), which can be attributed to the adverse impact of the financial market shock on the housing market. Growth in the consumption of fixed capital subsequently picked up, albeit at a slower rate compared with pre-downturn rates. In 2013, the level of the consumption of fixed capital was 3.5% (£8 billion) lower than the 2007 peak (see Figure 5).
Figure 5: Consumption of fixed capital estimates, 1997 to 2013, at chained volume measures
Reference year: 2011 Coverage: United Kingdom
Source: Quarterly Stocks Inquiry - Office for National Statistics
Download this chart Figure 5: Consumption of fixed capital estimates, 1997 to 2013, at chained volume measures
Image .csv .xlsAlso published as part of this release are estimates of the gross capital stock, net capital stock, and consumption of fixed capital at an institutional sector, asset and industry level. Further information on the detailed classification of these three areas can be found in the ONS 'concepts, sources and methods' publication.
Back to table of contents7. Analysis by institutional sector
The percentage share of net capital stocks owned by the institutional sectors remained relatively stable between 1997 and 2013. The net capital stocks estimates have been used for this analysis because they are a measure of the market value of fixed assets, that is, what these assets were worth at the time. Users will notice a large change in estimates of ‘ICT, other machinery and equipment and weapons systems’, in non-financial corporations (S.11) and central government (S.13) in 2005. This was due to the reclassification of British Nuclear Fuels Limited (BNFL) in April 2005 - more information is available in the background notes.
At the end of 2013, non-financial corporations’ (NFCs) were estimated to have held the largest share of total net capital stock at £1.6 trillion (42%), followed by households and NPISH sector which held an estimated £1.5 trillion (38%) of assets.
NFCs held the largest number of assets in ‘other buildings and structures’, at £0.9 trillion (53% of total net capital stock held by NFCs). Households and NPISH primarily held assets in dwellings (excluding land) at £1.4 trillion (93% of total net capital stock held by households). This percentage has decreased since the previous publication as research and development assets have been included in this sector’s total.
Figure 6: Net capital stocks by institutional sector, 1997 and 2013, chained volume measures
Reference year: 2011 Coverage: United Kingdom
Source: Quarterly Survey of Capital Expenditure - Office for National Statistics
Download this chart Figure 6: Net capital stocks by institutional sector, 1997 and 2013, chained volume measures
Image .csv .xlsFigure 6 and Table 2 show that all institutional sectors experienced growth in net capital stocks between 1997 and 2013, albeit at different rates. In percentage terms, general government was the headline sector that experienced the strongest growth at 64% (equivalent to 3.1% per annum), followed by financial corporations at 33% (equivalent to 1.8% per annum), and Households and NPISH by 25%, or 1.4% per annum. NFCs increased by 23% (equivalent to 1.3% per annum). These percentages have changed since the previous publication as new assets have been included.
Table 2 shows that the economic downturn (2008-2009) affected the growth of net capital stock to varying degrees by institutional sectors. For example, growth in net capital stock held by financial corporations was adversely affected by the downturn, falling from 2.2% per annum in the pre-downturn decade to 0.7% in 2008 and 2009. In contrast, growth in net capital stock held by general government rose during the downturn to 4.0%, before returning to a level above its pre-downturn trend rate in the following years.
Table 2: Average annual growth in the net capital stock by institutional sector
| Chained volume measures | |||||
| 1998-2007 | 2008-2009 | 2010-2013 | 1998-2013 | ||
| Non-financial corporations | 1.6% | 0.5% | 0.9% | 1.3% | |
| Households and NPISH | 2.0% | 0.6% | 0.4% | 1.4% | |
| General Government | 2.9% | 4.0% | 3.4% | 3.1% | |
| Financial corporations | 2.2% | 0.7% | 1.2% | 1.8% | |
| Total net capital stock | 1.9% | 1.1% | 1.1% | 1.6% | |
| Source: Office for National Statistics | |||||
Download this table Table 2: Average annual growth in the net capital stock by institutional sector
.xls (55.3 kB)Figure 7 highlights the contribution that each institutional sector made to annual net capital stock growth between 1998 and 2013. It shows that during the downturn, a strong rise in general government net capital stock growth partially offset slower net stock growth for households and NFCs (which accounted for a relatively higher share of the total stock over the 1997-2013 period).
Figure 7: Contributions to annual net stock growth by institutional sector, chained volume measures, %
2011 Coverage: United Kingdom
Source: Quarterly Stocks Inquiry - Office for National Statistics
Notes:
- (a)General Government (i.e. Central and Local Government) sectors have been forecast based on historic trends, any updates to GFCF for these sectors are not reflected in the data in this release - see background note 2 of the statistical bulletin for further information
Download this chart Figure 7: Contributions to annual net stock growth by institutional sector, chained volume measures, %
Image .csv .xls8. Analysis by type of asset
Figure 8 shows that ‘dwellings’ accounted for the largest share of assets in 2013, at £1.6 trillion (41% of the total net capital stocks in 2013). ‘Other buildings and structures’ accounted for the second largest share at 36% (£1.4 trillion in 2013), while ‘ICT, other machinery, equipment and weapons systems’, ‘ intellectual property products’ and ‘other assets’ followed with 16%, 5% and 3% respectively.
Figure 8: Net capital stocks estimates by asset, 1997 and 2013 at chained volume measures
Reference year: 2011 Coverage: United Kingdom
Source: Quarterly Survey of Capital Expenditure - Office for National Statistics
Notes:
- Other assets includes transport equipment and cultivated biological assets
Download this chart Figure 8: Net capital stocks estimates by asset, 1997 and 2013 at chained volume measures
Image .csv .xlsFigure 8 and Table 3 show that net capital stocks of ‘intellectual property products’ was the only asset to decrease between 1997 and 2013, falling by 0.7% per annum on average over the entire period. The asset that experienced the strongest growth was ‘other buildings and structures’, which increased by 45% over the entire period (or 2.3% per annum), followed by ‘ICT, other machinery, equipment and weapons systems’, which increased by 39% since 1997 (2.1% per annum).
Table 3 shows that the economic downturn (2008-2009) affected the pace of net capital stock accumulation by varying amounts across assets. For example, the average annual growth of ‘other buildings and structures’ fell from 2.6% pre-downturn to 2.0% in the downturn period, whereas growth in ‘dwellings’ fell from 1.7% in the pre-downturn decade to 0.6% during the downturn.
Table 3: Average annual growth in net capital stock by asset
| Chained volume measures (CVM) | ||||||
| 1998-2007 | 2008-2009 | 2010-2013 | 1998-2013 | |||
| Dwellings | 1.7% | 0.6% | 0.5% | 1.2% | ||
| Other buildings and structures | 2.6% | 2.0% | 1.9% | 2.3% | ||
| ICT, other machinery, equipment and weapons systems | 2.7% | 1.2% | 1.2% | 2.1% | ||
| Intellectual property products | -0.9% | -1.7% | 0.2% | -0.7% | ||
| Other assets1 | 0.4% | -0.4% | 0.5% | 0.3% | ||
| Total net stock | 1.9% | 1.1% | 1.1% | 1.6% | ||
| Source: Office for National Statistics | ||||||
| Notes: | ||||||
| 1. Other assets includes transport equipment and cultivated biological resources | ||||||
Download this table Table 3: Average annual growth in net capital stock by asset
.xls (33.8 kB)Figure 9 decomposes annual net capital stock growth between 1998 and 2013, according to the contribution made from the headline assets cited in Table 3. The largest contributions to net capital stock growth between 1998 and 2013 came from 'other buildings and structures' and 'dwellings'. This reflected the strong growth of the 'buildings and other structures' asset and the large share of 'dwellings'. During the economic downturn, 'other buildings and structures' continued to make positive contributions to annual growth, while the contributions from 'other machinery and equipment' and 'dwellings' fell and has remained low since.
Figure 9: Contributions to annual net stock growth by asset, chained volume measures, %
Reference year: 2011 Coverage: United Kingdom
Source: Quarterly Survey of Capital Expenditure - Office for National Statistics
Notes:
- (a) Other assets includes transport equipment and cultivated biological resources
Download this chart Figure 9: Contributions to annual net stock growth by asset, chained volume measures, %
Image .csv .xlsAsset and sector estimates for all measures of capital stock and capital consumption on current price and CVM basis are available in the accompanying time series dataset and in publication tables.
Back to table of contents9. Analysis by industry
Estimates of capital stocks and the consumption of fixed capital can be analysed by industry using the UK Standard Industrial Classification 2007.
The share of the net capital stock held by the four broad industry groupings (Other production; Manufacturing; Construction and Services) reflects the relative shares of these industries in Gross Value Added (GVA) terms. Table 4 shows that the services industries (Sections G-T) held an estimated £3.1 trillion (79.0%) of total net capital stocks at the end of 2013. Other production industries (Sections A, B, D and E) held £312 billion (8.0%); construction (Section F) £260 billion (6.6%), and manufacturing (Section C) £246 billion (6.3%).
Over time, the percentage share of these industry groupings has been relatively stable. Services industries increased their percentage shares by 3.6% since 1997, while the ‘other production’, manufacturing and construction industries all reduced their percentage share by 0.2%, 1.2% and 2.1% respectively.
Table 4: Volume and percentage of net capital stocks held by broad industry groupings, 1997–2013
| Chained Volume Measures (CVM) | |||||||
| 1997 | 2013 | Change between 1997-2013 | |||||
| Net capital stocks (£bn) | Share of assets held ( %) | Net capital stocks (£bn) | Share of assets held( %) | Net captial stocks (£bn) | Share of assets held (%) | ||
| ABDE | Other production | 247 | 8.2 | 312 | 8.0 | 64.5 | -0.2 |
| C | Manufacturing | 227 | 7.6 | 246 | 6.3 | 18.4 | -1.2 |
| F | Construction | 261 | 8.7 | 257 | 6.6 | -4.3 | -2.1 |
| G to T | Services | 2,260 | 75.3 | 3,061 | 79.0 | 800.8 | 3.6 |
| TOTAL | Total | 3,000 | 100.0 | 3,875 | 100.0 | 875.3 | N/A |
| Source: Office for National Statistics | |||||||
| Notes: | |||||||
| 1. Numbers may not sum due to rounding | |||||||
Download this table Table 4: Volume and percentage of net capital stocks held by broad industry groupings, 1997–2013
.xls (56.3 kB)
Figure 10: Net capital stocks by broad industry groups, 1997-2013, chained volume measures
Reference year: 2011 Coverage: United Kingdom
Source: Quarterly Stocks Inquiry - Office for National Statistics
Notes:
- (a) Other production includes Agriculture, Mining & Quarrying, Utilities and Water Supply & Sewage
Download this chart Figure 10: Net capital stocks by broad industry groups, 1997-2013, chained volume measures
Image .csv .xlsThe types of field assets held as stock varies across the industries of the economy. In 2013 services industries held the majority of their total net stocks either in ‘dwellings’ (£1.5 trillion at current prices (CP) or 48%), or in ‘other buildings and structures’ (£1 trillion at CP or 33%).
Other production industries also held the majority of their total capital stocks as ‘other buildings and structures’ (£210 billion at CP or 67%), however they also held a significant proportion of capital stocks as ‘ICT, other machinery and equipment and weapons systems’ (£82 billion at CP or 26%).
Not all industries held the majority of their capital stock in buildings. For example, manufacturing industries held the majority of their capital stocks in ‘ICT, other machinery, equipment and weapons systems’ at (£132 billion at CP or 54%) in contrast to ‘other buildings and structures’ which accounted for a relatively smaller proportion (£77 billion at CP or 31%).
Table 5: Net capital stock as a percentage of fixed assets held by asset and broad industry groups, 2013
| Current prices1 | |||||
| % | |||||
| ABDE Other production | C Manufacturing | F Construction | G to T Services | A-T Total | |
| ICT, other machinery, equipment and weapons systems | 26.1 | 53.8 | 4.4 | 12.3 | 15.4 |
| Transport equipment | 1.4 | 0.3 | 1.0 | 2.6 | 2.2 |
| Dwellings (excl land) | z | z | 59.3 | 47.9 | 42.0 |
| Other buildings and structures | 66.8 | 31.4 | 34.9 | 32.7 | 35.5 |
| Intellectual property products | 3.6 | 14.4 | 0.4 | 4.5 | 4.7 |
| Cultivated biological resources | 2.0 | z | z | z | 0.2 |
| Total fixed assets | 100.0 | 100.0 | 100.0 | 100.0 | 100.0 |
| Source: Office for National Statistics | |||||
| Notes: | |||||
| 1. Totals may not sum due to rounding | |||||
| 2. z = data not applicable for this asset in this industry | |||||
Download this table Table 5: Net capital stock as a percentage of fixed assets held by asset and broad industry groups, 2013
.xls (33.8 kB)As with the institutional sector and asset breakdowns, growth in net capital stock showed variation across the industries (Table 6). For example, the net capital stocks held by manufacturing industries fell during the economic downturn, by 1.1% on average per annum in 2008 and 2009, before continuing to fall by 0.4% per annum between 2010 and 2013. In contrast, growth in the net capital stock held by 'other production' industries rose by 1.7% per annum during the downturn from 0.7% per annum in the pre-downturn decade, and has risen further in the most recent years. The average annual growth rate for other production has reduced for all periods as a result of an upward change in the level of the net capital stock resulting from a review of the methods used in the 'mining and quarrying' industries. See section 2 of the background notes for further details.
Table 6: Average annual growth rate in net capital stock by industry
| 1998-2007 | 2008-2009 | 2010-2013 | 1998-2013 | ||
| ABDE | Other production | 0.7% | 1.7% | 3.2% | 1.5% |
| C | Manufacturing | 1.2% | -1.1% | -0.4% | 0.5% |
| F | Construction | 0.4% | -0.9% | -0.9% | -0.1% |
| G-T | Services | 2.3% | 1.4% | 1.2% | 1.9% |
| A-T | Total net stock | 1.9% | 1.1% | 1.1% | 1.6% |
| Source: Office for National Statistics | |||||
Download this table Table 6: Average annual growth rate in net capital stock by industry
.xls (33.3 kB)Figure 11 shows that services industries consistently made the largest positive contribution, to annual net capital stock growth between 1998 and 2013.
Figure 11: contributions to annual net capital stock growth by industry, percentage points, chained volume measures
Reference year: 2011 Coverage: United Kingdom
Source: Stocks, Quarterly Survey of Capital Expenditure - Office for National Statistics
Download this chart Figure 11: contributions to annual net capital stock growth by industry, percentage points, chained volume measures
Image .csv .xlsEstimates by industry for all measures are available in the accompanying time series dataset and in the publication tables.
Back to table of contents10. Capital output ratio analysis
The capital output ratio is calculated by dividing capital stocks estimates by gross value added (GVA), to obtain a measure of the capital intensity of each industry. GVA is the value of output less the value of intermediate consumption. Intermediate consumption consists of the value of the goods and services consumed as inputs by the process of production, excluding fixed assets whose consumption are recorded as consumption of fixed capital.
This measure has been calculated on both a gross and net capital stocks basis in the publication tables back to 1997.
All else being equal, if there is a higher level of capital stock in the economy; workers should theoretically be able to produce a greater quantity or quality of output using the same quantity of labour input. This higher level of productivity arises because workers have more (or better) tools or facilities at their disposal.
Figure 12 shows that using this measure, the most ‘capital intensive’ industry in 2013 was real estate – holding the majority of assets in dwellings. In contrast, professional, health and ‘other services’ industries showed smaller rates of capital intensity.
Figure 12: Capital intensity by industry sector (net stock in 2013 divided by the level of GVA in 2013)
Reference year: 2011 Coverage: United Kingdom
Source: Quarterly Survey of Capital Expenditure, Stocks - Office for National Statistics
Download this chart Figure 12: Capital intensity by industry sector (net stock in 2013 divided by the level of GVA in 2013)
Image .csv .xlsIndustries have different capital output ratios over time, as shown in Figure 13, which indexes ratios for broad industry groupings to 2010=100. An increase in a line shows that the capital output ratio has increased. This could occur either from a decrease in GVA or an increase in capital stocks.
Between 1997 and 2009, the 'other production' industry became more capital intensive whereas the three other main industry groupings experienced a decrease in their capital intensity.
With the onset of the economic downturn, all industries became more capital intensive, however in most instances this reflected a sharp fall in GVA, that was more than offset by a slower reduction in capital stock growth during this period.
Since the economic downturn there has been a mixed picture between industries, with the ratio of capital stock to output decreasing in 'other production', the ratio remaining constant in services, and both construction and manufacturing becoming more capital intensive. This has not fallen to pre-downturn levels.
Figure 13: Net capital stock output ratios, 1997-2013
Index, 2010=100
Source: Stocks, Quarterly Survey of Capital Expenditure - Office for National Statistics
Download this chart Figure 13: Net capital stock output ratios, 1997-2013
Image .csv .xlsCapital output ratio estimates by industry for all measures are available in the accompanying time series dataset and in publication tables.
Back to table of contents11. Net capital stocks per employee
It is also possible to analyse the level of capital stock per employee. Net capital stocks are used in this calculation because they provide a better estimate of the value of capital stocks at a point in time than gross stocks. Estimates of employees are taken from ONS Labour Market Statistics. This analysis differs from the previous publication, where ONS used a ratio per employed person which included the self-employed. The ratios in this publication only include data on employees.
Figure 14 shows the annual growth in capital stock per employee from 1998 to 2013. Between 2007 and 2009 there was a sharp rise, which reflected a sharp fall in employees that more than offset slower capital stock growth during this period. In the most recent years, this ratio has risen at a far slower rate – and even fell in 2011 – suggesting that firms may have been diverting resources away from capital and more into labour inputs.
Figure 14: Growth in net capital stock per employee, 1998-2013, chained volume measure
Reference year: 2011 Coverage: United Kingdom
Source: Quarterly Survey of Capital Expenditure - Office for National Statistics
Download this chart Figure 14: Growth in net capital stock per employee, 1998-2013, chained volume measure
Image .csv .xls
Figure 15: Growth in net capital stock per employee, by component, 1998-2013, chained volume measures
Reference year: 2011 Coverage: United Kingdom
Source: Quarterly Stocks Inquiry - Office for National Statistics
Download this chart Figure 15: Growth in net capital stock per employee, by component, 1998-2013, chained volume measures
Image .csv .xlsCapital stocks per employed ratio estimates by industry for gross and net stocks are available in the accompanying time series dataset and in publication tables.
Back to table of contents12. International comparison
The profile of net capital stock growth has moved in line with other major economies since the turn of the century, as shown in Figure 16. Net capital stock growth is shown to fall across all the selected economies during the economic downturn, with Germany, the United States and Italy experiencing comparatively weak growth. This is in contrast to the UK which has seen an increase in the growth rate since 2011.
Figure 16: Year on year net stock growth rate of selected G7 and major European economies
Chained volume measures, %
Source: Quarterly Stocks Inquiry - Office for National Statistics
Notes:
- Data are not available for Germany for years 2011-2013, France, Italy, Netherlands and US for 2013