Table of contents
- Prefix
- Executive summary
- Methodological changes to UK trade in goods
- Methodological changes to UK trade in services
- Indicative impact of improved methods to UK trade balance
- Indicative impact of improved methods to trade in goods
- Indicative impact of improved methods to trade in services
- Conclusions
1. Prefix
In Blue Book 2019, we have made considerable progress in improving how we compile estimates of gross domestic product (GDP), where we have used the foundations of a new framework to inform headline GDP estimates. This includes:
- progress in incorporating a wider set of more appropriate product deflators for each transaction, confronting these at a detailed level for the first time
- full integration of the institutional sectors into the balancing process of the Supply and Use framework
- improving our estimates of current price GDP by using new data sources to give information on the diversification of the services economy and the costs incurred by businesses
Further information is outlined in the National Accounts articles: Blue Book 2019 impacts on GDP current price and chained volume measure estimates: 1997 to 2016 that was published on 20 August 2019.
There are also a number of methodological improvements that will be incorporated into this year’s Blue Book. Stand-alone articles for National Accounts articles: Impact of Blue Book 2019 changes on gross fixed capital formation and business investment; National Accounts articles: Changes to the capital stock estimation methods for Blue Book 2019 and National Accounts articles: Improvements to the processing of Non-Profit Institutions Serving Households (NPISH) published on 20 August 2019 provide further details of these.
Back to table of contents2. Executive summary
This article details indicative estimates of the impact on UK trade in Blue Book 2019 and Pink Book 2019 – consistent with the quarterly national accounts (QNA) to be published on 30 September 2019.
This article focuses on the period from 1997 to 2016 and covers annual revisions to both current prices and chained volume measures and the trade implied deflator.
We have embarked upon and are delivering against an ambitious development plan for UK trade statistics. For Blue Book and Pink Book 2019 we are making improvements to the balance of payments (BoP) adjustments within trade in goods, and incorporating estimates of UK monetary financial institutions’ intragroup fees and cost recharges within trade in services. Improvements have been made to the way Weight Modified Consumer Price Indices (WMCPIs) are currently used in the deflation of trade in services. We have also improved the method to produce the trade in goods fuel deflator by using a better weighting system.
Trade in services received balancing adjustments, this was the largest contributor to the annual revisions. This is as a result of the annual supply and use balancing process, that is, the process used to reconcile the three approaches to GDP: income, output and expenditure.
Back to table of contents3. Methodological changes to UK trade in goods
This section details the methodological improvements we are making to trade in goods for Blue Book and Pink Book 2019.
We are improving our balance of payments (BoP) adjustments which are applied to trade in goods. Her Majesty's Revenue and Customs (HMRC) is the main source for our trade in goods data, delivering administrative data each month collected on an Overseas Trade Statistics (OTS) basis; this measures the physical movement of goods in and out of the UK. However, such data are on a different basis from that required for balance of payments statistics. To conform to the International Monetary Fund (IMF) definition (PDF, 3.01MB), we have to make various adjustments to certain transactions which are not reported to HMRC and, conversely, to exclude certain transactions that, although are reported by HMRC, do not involve a change in economic ownership.
One of the improvements revises the method for allocating the adjustments for merchanting and adjustments for goods sent abroad for processing to products. Merchanting is the purchase of a good by a resident from a non-resident and the subsequent resale of the good to another non-resident, without the good ever entering the resident economy. The value of these goods will not be present in the OTS data since they do not cross the customs border. Goods sent abroad for processing are goods that are exported or imported for processing where the enterprise doing that processing is not the economic owner. The value of these goods is present in the OTS data as they cross the customs border. The processor however does not have economic ownership over the goods, so the flow should not be included on a BoP basis.
Both of these adjustments are collected via the International Trade in Services Survey (ITIS) but these data are not available on a product basis. Product classifications are designed to categorise products that have common characteristics. We are now utilising the trade in goods microdata from HMRC to allocate these adjustments to a product based on the industry that reported the transaction. Linking the data in this way assumes that a trader operates in a single industry. While this may hold for simple firms, for more complex firms who have operations spanning multiple industries, the matching method used in this release will provide a more accurate apportionment of trade values to industry.
In addition, the processing of the trade in goods country by commodity dataset has been improved, maintaining the unrounded value to increase the accuracy of this granular dataset. Following Blue Book and Pink Book 2019, publications of the country by commodity dataset will be in British pounds rather than millions. While this has no impact on total trade in goods, it results in some reallocation across both the product and country dimensions.
The method to produce the trade in goods fuel deflator has been improved for Blue Book 2019. Prices for petrol, diesel and kerosene from Bloomberg are weighted using the Digest of UK Energy statistics publication; which shows the volumes of each commodity traded on an import and export basis.
Back to table of contents4. Methodological changes to UK trade in services
For Blue Book and Pink Book 2019 in addition to balancing adjustments, we have incorporated a range of trade-specific methodological improvements. One of these improvements is the inclusion of estimates of UK monetary financial institutions’ intragroup fees and cost recharges in trade in services. This is in line with our planned improvements and ongoing developments of trade statistics. The Bank of England collects these data using its Profit and Loss (PL) form. Transactions between residents and non-residents will be included within trade in services for Blue Book 2019. Transactions between UK institutions are already captured in the income and output measures of GDP.
Intragroup fees and cost recharges cover:
- intragroup fees, including investment banking, advisory, brokerage, underwriting, insurance, loans and advances where these cannot be separately identified and explicitly reported within those items on Form PL
- cost recharges, applied when the costs of a centrally managed service are allocated and charged to each group entity; for example, software for the whole group may be purchased by one group entity but then recharged to other group entities
- other intragroup operating income and expenditure; any intra-group service income and expenditure not covered by intragroup fees or cost recharges
Example of cost recharging from the Bank of England’s profit and loss definitions (referred to on Form PL as transfer pricing):
Suppose the UK entity brokers a deal on behalf of its US subsidiary, making a £500 million trading profit on the deal. The £500 million is then transferred back to the US subsidiary which owns the trading portfolio. The US subsidiary is charged £10 million by the UK reporter for the service provided. This charge can be either implicit (a dealing profit of £500 million, of which only £490 million is transferred back), or explicit (a cost recharge expense of £10 million by the US subsidiary). Regardless of the exact transaction, reporting should be as follows:
Figure 1: Example of cost recharging graphic

Source: Bank of England
Download this image Figure 1: Example of cost recharging graphic
.png (22.5 kB)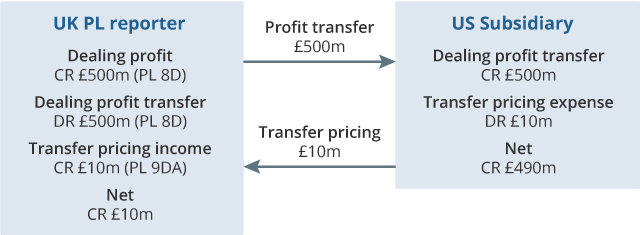
Trade in services received balancing adjustments, this was the largest contributor to the annual revisions. This is as a result of the annual supply and use balancing process, that is, the process used to reconcile the three approaches to GDP: income, output and expenditure.
Weight Modified Consumer Price Indices (WMCPIs) are currently used in the deflation of trade in services. The methodology for constructing WMCPIs has been improved for Bluebook 2019. We have updated the weight given to different currencies in the construction of the indices to better reflect the relative weight; these weights will now be updated every five years. A further four countries have been incorporated into this matrix, including China and India. These were selected based on the value of service trade with these countries.
The underlying data used to form export WMCPIs have been changed. GDP(O) deflators have replaced foreign CPI data, reflecting that export prices are more influenced by domestic input-price changes. Import prices continue to be formed from foreign CPI data.
The basket of currencies used to adjust exchange rates has also been modified. This reflects that international trade conducted by UK firms is largely agreed and transacted in three dominant currencies: British Sterling, US Dollar and the Euro. The proportion of each currency used in trade is calculated separately for exports and imports.
Back to table of contents5. Indicative impact of improved methods to UK trade balance
The indicative impact of the improvements we are making to the UK trade balance in current prices range from a downward revision of £1.4 billion in 2016 to an upward revision of £6.3 billion in 2013 (Table 1). The £6.3 billion upward revision to the UK trade balance in 2013 means the deficit has been revised from £29.0 billion to £22.8 billion (Table 2).
In Blue Book 2019, we will introduce a new framework to produce gross domestic product (GDP), both in current prices and in volume terms. Upwards revisions to the trade in services balance are largely as a result of the annual supply and use balancing process (that is, the process used to reconcile the three approaches to GDP; income, output and expenditure). Further information is available in National Accounts articles: Blue Book 2019 indicative impacts on GDP current prices and chained volume measure estimates: 1997 to 2016.
| Trade balance | of which: trade in goods | of which: trade in services | |
|---|---|---|---|
| 1997 | 0.1 | -0.4 | 0.6 |
| 1998 | 0.6 | -1.7 | 2.3 |
| 1999 | 0.4 | -1.5 | 1.9 |
| 2000 | 1.7 | -2.2 | 3.9 |
| 2001 | 2.0 | -1.2 | 3.2 |
| 2002 | 2.6 | -0.3 | 3.0 |
| 2003 | 2.3 | -1.8 | 4.1 |
| 2004 | 0.0 | -1.8 | 1.7 |
| 2005 | 1.5 | 0.3 | 1.2 |
| 2006 | 4.1 | 0.3 | 3.8 |
| 2007 | 4.3 | 0.5 | 3.8 |
| 2008 | 4.8 | 1.7 | 3.1 |
| 2009 | 3.5 | 0.8 | 2.7 |
| 2010 | 3.1 | 0.6 | 2.5 |
| 2011 | 3.5 | -1.6 | 5.1 |
| 2012 | 5.5 | 1.7 | 3.8 |
| 2013 | 6.3 | 1.2 | 5.1 |
| 2014 | 3.7 | 1.0 | 2.8 |
| 2015 | 0.5 | 0.1 | 0.4 |
| 2016 | -1.4 | -1.5 | 0.1 |
Download this table Table 1: Indicative revisions to current price total trade balance for Blue Book and Pink Book 2019, £billion
.xls .csvTable 2 shows the indicative Blue Book and Pink Book 2019 data and the data currently published in the GDP quarterly national accounts, UK: January to March 2019 for exports, imports and the trade balance.
| Trade balance | Exports | Imports | ||||
|---|---|---|---|---|---|---|
| BB19 | Published | BB19 | Published | BB19 | Published | |
| 1997 | 4.7 | 4.6 | 243.3 | 241.0 | 238.6 | 236.4 |
| 1998 | -6.2 | -6.8 | 240.8 | 236.1 | 247.0 | 242.9 |
| 1999 | -14.4 | -14.8 | 248.8 | 244.3 | 263.2 | 259.1 |
| 2000 | -19.0 | -20.7 | 276.1 | 271.4 | 295.1 | 292.1 |
| 2001 | -25.1 | -27.1 | 285.3 | 278.6 | 310.4 | 305.7 |
| 2002 | -30.7 | -33.3 | 287.1 | 280.7 | 317.7 | 313.9 |
| 2003 | -27.7 | -30.0 | 300.0 | 294.0 | 327.7 | 323.9 |
| 2004 | -33.6 | -33.6 | 313.0 | 307.4 | 346.7 | 341.0 |
| 2005 | -33.5 | -35.0 | 348.7 | 343.0 | 382.2 | 378.1 |
| 2006 | -30.3 | -34.4 | 399.7 | 391.7 | 430.0 | 426.1 |
| 2007 | -30.7 | -35.0 | 391.2 | 383.3 | 421.9 | 418.4 |
| 2008 | -34.2 | -39.0 | 429.1 | 422.4 | 463.3 | 461.4 |
| 2009 | -24.8 | -28.3 | 408.1 | 402.0 | 433.0 | 430.3 |
| 2010 | -32.0 | -35.1 | 452.9 | 447.1 | 484.9 | 482.2 |
| 2011 | -15.0 | -18.5 | 509.6 | 500.7 | 524.6 | 519.1 |
| 2012 | -20.1 | -25.6 | 513.3 | 504.7 | 533.3 | 530.3 |
| 2013 | -22.8 | -29.0 | 533.8 | 523.5 | 556.5 | 552.6 |
| 2014 | -26.0 | -29.7 | 530.7 | 520.3 | 556.7 | 550.0 |
| 2015 | -26.5 | -27.0 | 530.0 | 519.6 | 556.5 | 546.6 |
| 2016 | -32.3 | -30.9 | 567.5 | 557.0 | 599.8 | 587.8 |
Download this table Table 2: Total trade balance, exports and imports for Blue Book and Pink Book 2019 compared with current published data, £billion
.xls .csvFigure 2 shows the indicative impact of Blue Book 2019 improvements to the current price annual trade balance as a percentage of GDP. The revisions to net trade are more heavily driven by trade in services revisions.
Figure 2: Annual revisions to net trade are more heavily driven by trade in services revisions
Indicative impact of Blue Book 2019 improvements to the current price annual trade balance as a percentage of GDP, 1997 to 2016
Source: Office for National Statistics
Download this chart Figure 2: Annual revisions to net trade are more heavily driven by trade in services revisions
Image .csv .xlsFigure 3 shows the indicative export and import implied deflators for Blue Book and Pink Book 2019 compared with the implied deflators currently published.
Figure 3: Both export and import implied deflators have generally been revised upwards over the period between 1997 and 2016
Indicative impact on export and import implied deflators, base 1997
Source: Office for National Statistics
Download this chart Figure 3: Both export and import implied deflators have generally been revised upwards over the period between 1997 and 2016
Image .csv .xlsFigure 4 shows the indicative impact of Blue Book 2019 improvements for annual trade contributions to real GDP for exports, imports and net trade. Revisions to net trade contributions to real GDP range from a negative revision of 0.3 percentage points in 2014 to a positive revision of 0.3 percentage points in 1998.
This article covers the impact of trade improvements to the GDP estimates, the full summary of changes to GDP for Blue Book 2019 is covered in National Accounts articles: Blue Book 2019 indicative impacts on GDP current price and chained volume measure estimates: 1997 to 2016, published 27 June 2019.
Figure 4: Revisions to net trade contributions to real GDP range from a negative revision of 0.3 percentage points in 2014 to a positive revision of 0.3 percentage points in 1998
Indicative impact of Blue Book 2019 improvements to annual trade contributions to real GDP, 1998 to 2016
Source: Office for National Statistics
Notes:
- The imports contribution has been inverted as imports has a negative impact of GDP (net trade = exports less imports).
Download this chart Figure 4: Revisions to net trade contributions to real GDP range from a negative revision of 0.3 percentage points in 2014 to a positive revision of 0.3 percentage points in 1998
Image .csv .xls6. Indicative impact of improved methods to trade in goods
Figures 5 and 6 show indicative revisions between Pink Book 2019 and the Balance of payments, UK: January to March 2019 publication by Standard International Trade Classification (SITC) commodity groups at a 1-digit level.
Figure 5: Fuels and chemicals were the largest drivers of the annual revisions to goods exports
Indicative annual improvements to exports of goods by SITC commodity groups at a 1-digit level, 1998 to 2016
Source: Office for National Statistics
Notes:
- For presentational purposes some SITC commodity groups have been combined.
Download this chart Figure 5: Fuels and chemicals were the largest drivers of the annual revisions to goods exports
Image .csv .xls
Figure 6: Downward revisions to import of goods were mostly driven by fuels and chemicals
Indicative annual improvements to imports of goods by SITC commodity groups at a 1-digit level, 1998 to 2016
Source: Office for National Statistics
Notes:
- For presentational purposes some SITC commodity groups have been combined.
Download this chart Figure 6: Downward revisions to import of goods were mostly driven by fuels and chemicals
Image .csv .xlsFigure 7 shows indicative proportions of trade in goods to the EU for Blue Book 2019.
Figure 7: In 2016, 55.1% of all UK imports of goods were from the EU, compared with 47.8% of all UK exports of goods going to the EU
Indicative proportions of trade in goods to the EU for Blue Book 2019, 1998 to 2016
Source: Office for National Statistics
Download this chart Figure 7: In 2016, 55.1% of all UK imports of goods were from the EU, compared with 47.8% of all UK exports of goods going to the EU
Image .csv .xlsFigure 8 shows the indicative revisions to trade in goods to the EU for Bluebook 2019. The largest revision is a reduction of 0.5% to EU exports in 2000 and an increase of 0.3% to EU imports in 2005 and 2009.
Figure 8: The largest revision to EU exports was a fall of 0.5% in 2000 and for EU imports was an increase of 0.3% in 2005 and 2009
Indicative revisions to trade in goods to the EU for Blue Book 2019, 1998 to 2016
Source: Office for National Statistics
Download this chart Figure 8: The largest revision to EU exports was a fall of 0.5% in 2000 and for EU imports was an increase of 0.3% in 2005 and 2009
Image .csv .xlsTable 3 shows the indicative top 5 export and import countries for trade in goods in 2016. There are no changes to the top 5 ranked countries in 2016 compared with Pink Book 2018.
| Ranking | Export country | Import country |
|---|---|---|
| 1 | United States including Puerto Rico | Germany |
| 2 | Germany | China |
| 3 | France | United States including Puerto Rico |
| 4 | Netherlands | Netherlands |
| 5 | Ireland | France |
Download this table Table 3: UK trade in goods indicative top 5 export and import countries, 2016
.xls .csvFigure 9 shows the indicative fuels export and import implied deflators for Blue Book and Pink Book 2019 compared with the implied deflators currently published.
Figure 9: Both fuel export and import implied deflators have been revised downwards over the period between 1998 and 2016
Indicative impact on fuel export and import implied deflators, 1998 to 2016, base 1998
Source: Office for National Statistics
Download this chart Figure 9: Both fuel export and import implied deflators have been revised downwards over the period between 1998 and 2016
Image .csv .xls7. Indicative impact of improved methods to trade in services
The indicative revision to the trade in service balance as a result of intragroup fees and cost recharges ranges from a reduction of £0.2 billion in 2002 to a reduction of £3.2 billion in 2016 (Figure 10).
Figure 10: The largest impact from intragroup fees and cost recharges was in 2016 for both exports and imports
Changes to trade balance (exports and imports) as a result of intragoup fees and recharges, 1997 to 2016
Source: Office for National Statistics
Download this chart Figure 10: The largest impact from intragroup fees and cost recharges was in 2016 for both exports and imports
Image .csv .xlsFigures 11 and 12 show indicative improvements to trade in services by EBOPS classification between Pink Book 2019 and the Balance of payments, UK: January to March 2019 publication. Exports of services has total revisions of £11.7 billion in 2016, mostly as a result of the inclusion of intragroup fees and cost recharges (£9.5 billion). Imports of services has total revisions of £11.6 billion in 2016, also predominantly as a result of the inclusion of intragroup fees and cost recharges (£12.7 billion).
Figure 11: Upward annual revisions to exports of services were mainly driven by other business services
Indicative annual improvements to exports of services by EBOPS, 1997 to 2016
Source: Office for National Statistics
Notes:
- For presentational purposes some EBOPS have been combined.
Download this chart Figure 11: Upward annual revisions to exports of services were mainly driven by other business services
Image .csv .xls
Figure 12: Upward annual revisions to imports of services were mainly driven by other business services and Transport, offset by downward revisions in Travel
Indicative annual improvements to imports of services by EBOPS, 1997 to 2016
Source: Office for National Statistics
Notes:
- For presentational purposes some EBOPS have been combined.
Download this chart Figure 12: Upward annual revisions to imports of services were mainly driven by other business services and Transport, offset by downward revisions in Travel
Image .csv .xlsFigure 13 shows the indicative trade in services export and import implied deflators for Blue Book and Pink Book 2019 compared with the implied deflators currently published.
Figure 13: The largest indicative revisions to the trade in services implied deflators were in 2014 for exports and 2007 for imports
Indicative impact on trade in services export and import implied deflators, base 2016
Source: Office for National Statistics
Download this chart Figure 13: The largest indicative revisions to the trade in services implied deflators were in 2014 for exports and 2007 for imports
Image .csv .xls8. Conclusions
The package of planned revisions set out in this article introduces a number of improvements in line with our published UK trade development plan. In agreement with the work to expand and improve UK trade statistics, new statistics have been published including trade in goods by industry, trade in services by industry, as well as more granular trade in services data by service type and partner country. This is alongside more developments planned for the future, such as services trade by enterprise characteristics. Further details can be found in the article New frontiers in trade analysis published 29 January 2019.
Back to table of contentsContact details for this Article
Related publications
- National Accounts articles: Blue Book 2019 improvements to non-profit institutions serving households (NPISH) sector
- National Accounts articles: Impact of Blue Book 2019 changes on gross fixed capital formation and business investment
- National Accounts articles: An update of indicative impacts on GDP current price and chained volume measure estimates, 1997 to 2016
- National Accounts articles: Changes to the capital stock estimation methods for Blue Book 2019