1. Executive summary
Building upon previous analysis, this article details the provisional current price and volume estimates of gross domestic product (GDP) up to 2016, reflecting the impact of the package of measurement improvements being introduced in this year’s Blue Book. This article focuses on the period from 1997 to 2016 and brings together current price and volume revisions and the GDP implied deflator, including annual and quarterly figures.
The total package of current price GDP improvements increases the size of the economy in 2016 by approximately £26.0 billion, around 1.3% of GDP.
Average growth of volume GDP over the period from 1998 to 2016 has been revised up 0.1 percentage point to 2.1% per year.
The average annual GDP implied deflator growth over the period from 1998 to 2016 remains unchanged at 1.9% per year, although within this total there are some offsetting revisions to individual expenditure component deflators.
The revisions to the industry composition of volume gross value added (GVA) growth over time have left the average annual volume GVA growth and the relative industry contributions largely unaffected.
The peak-to-trough fall of the 2008 economic downturn in GDP has been revised from 6.3% to 6.0% and the UK economy is now estimated to have returned to its pre-downturn levels one quarter earlier in Quarter 1 2013. There have been some revisions to the quarterly growth rates, including changes to the quarterly growth profile through 2016.
2. Introduction
Blue Book 2019 will mark a major step in our transformation of the UK National Accounts, in which we will be implementing new data sources and methods in compiling estimates of gross domestic product (GDP). This new framework will improve how we produce GDP in the UK, as it involves confronting the estimates from the three approaches to measuring GDP using the Supply and Use Tables (SUTs) framework1. This has historically been applied to set the current price level of UK GDP, but we have extended its application as the basis of volume GDP. This framework has been used as the basis to inform headline GDP estimates in Blue Book 2019 – see Annex A for further information. The most notable improvements include:
- progress in incorporating a wider set of more appropriate and available product deflators for each transaction, confronting these at a detailed level for the first time
- integration of the institutional sectors into the balancing process of the SUTs framework, enabling us to check simultaneously the coherence of current price GDP, volume GDP and the institutional sector accounts in their compilation
- improved estimates of current price GDP by reflecting new information on the diversification of the services industries and the costs incurred by businesses, while also carrying out a full rebalance of current price GDP for all years from 1997 to 2016
Published today, a suite of articles detail the methodological improvements that will be incorporated into this year’s Blue Book:
- Changes to the capital stock estimation methods for Blue Book 2019
- UK trade data impact assessment from new developments: 1997 to 2016
- Impact of Blue Book 2019 changes on gross fixed capital formation and business investment
- Improvements to the processing of Non-Profit Institutions Serving Households (NPISH)
The most significant is the incorporation of improved estimates of capital stock. These include up-to-date information available on the life length of fixed assets; improvements to the classification of inventories by asset, by industry and by institutional sector; and an enhanced modelling of the age-efficiency profile of capital assets. The net effect is for estimates of consumption of fixed capital (CFC) to be revised up in this year’s Blue Book, which helps explains why the level of current price GDP has been revised up as CFC is the basis for how some current price non-market output is estimated.
This article provides further information of these indicative estimates of GDP for the period 1997 to 2016, including provisional estimates of the quarterly path of GDP over this period and lower-level analysis for the production, expenditure and income approaches. As noted in our previous article we will not be producing fully integrated 2017 nominal GDP estimates in a SUT framework2. However, the top-level estimate of GDP will be based on our most comprehensive annual information, including the Annual Business Survey and Her Majesty’s Revenue and Customs tax (HMRC) information, which has then been used to inform the 2017 quarterly estimates of GDP.
Notes for Introduction
See UK National Accounts – A Short Guide (2011) for further information.
The reference year and last base year for all chained volume measure estimates will remain as 2016.
3. Analysis
Previous analysis explained that the revisions in Blue Book 2019 reflect the fundamental change to how gross domestic product (GDP) is now estimated in the UK, where there is now greater emphasis on data confrontation in a Supply and Use Tables (SUTs) framework. This includes undertaking a rebalance of GDP for all years from 1997 to 2016, while improving the consistency and coherency in how deflation is carried out. We have also introduced new low-level estimates of output and intermediate consumption, as well as a range of methodological improvements in estimating GDP as part of this year’s Blue Book.
Table 1 provides a recap of the expected revisions to GDP growth in this year’s Blue Book. Although we have made several measurement improvements, the underlying trends in the pre and post-crisis periods are largely unchanged with there still being a marked slowdown in GDP growth following the financial crisis. In the decade leading up to the financial crisis, average nominal GDP growth remains unchanged at 5.0%, while there has been a slight upward revision from 3.6% to 3.7% in the period following the financial crisis. Annual volume GDP growth over the period 1998 to 2007 is up from 2.9% to 3.0%, while it remains unchanged at 2.0% in the post-crisis period.
In addition to reviewing how we produce current price estimates, one of the key features of the new framework in this year’s Blue Book has been how deflation is now undertaken in the UK National Accounts. Greater emphasis has been placed on improving the confrontation between different deflators as well as work to quality assure the identification of the most appropriate deflators available for each product and type of transaction. This has also allowed for deflation to be carried out in a more consistent manner across its supply and use of the same product, which helps explain why the implied GDP deflator has been revised. Further analysis on the impact of Blue Book 2019 changes on annual current price UK GDP and annual volume UK GDP growth rates can be found in Annex D and E respectively.
| 1998 to 2007 | 2008 to 2009 | 2010 to 2016 | ||
|---|---|---|---|---|
| Current Price | Blue Book 2018 | 5.0 | -0.1 | 3.6 |
| Blue Book 2019 | 5.0 | 0.0 | 3.7 | |
| Revision | 0.0 | 0.1 | 0.1 | |
| Volume | Blue Book 2018 | 2.9 | -2.3 | 2.0 |
| Blue Book 2019 | 3.0 | -2.3 | 2.0 | |
| Revision | 0.1 | 0.0 | 0.0 | |
| Implied Deflator | Blue Book 2018 | 2.0 | 2.2 | 1.6 |
| Blue Book 2019 | 1.9 | 2.3 | 1.7 | |
| Revision | -0.1 | 0.1 | 0.1 |
Download this table Table 1: Current price and volume estimates of GDP and the implied GDP deflator are largely unrevised
.xls .csvProduction approach to measuring GDP
As noted in our previous article, we did not take on estimates of double deflated industry gross value added (GVA). As such, industry level estimates of volume GVA will continue to be produced by aligning the output-based GVA estimates to our best estimate of annual volume GDP (produced via our new framework). In line with previous practice, the Office for National Statistics (ONS) will use an automatic function for assigning the annual adjustments to GVA. This is designed to take account of the optimum quarterly paths while adjusting to the constrained annual growth rate1.
One of the key features of Blue Book 2019 is how we have enhanced our understanding of the diversification of the services industries and the input costs incurred by businesses in the production process, thereby improving the estimates of the products produced and intermediately consumed in the UK. This information will enable increased emphasis on data confrontation that underpins the balancing process in the SUTs framework. These improvements include:
Output: The Annual Survey of Goods and Services provides detailed information on the goods and services produced by each industry in the services sector. This builds on the UK Manufacturers' Sales by Product (ProdCom) survey that has historically been available for such information for the manufacturing industries. As service industries comprise around 80% of the UK economy by gross value added (GVA), this will provide a more reliable estimate of sales by product in the UK economy, improving the quality of current price estimates of GDP.
Intermediate Consumption: We have fully reintroduced the Purchases Survey to help compile this year’s Blue Book, which provides an up-to-date and more detailed estimate of the goods and services purchased by businesses by product as part of their production process. Timely information is needed to reflect that the structure of production changes over time, so a much richer understanding of the pattern of intermediate consumption by industry provides more accurate estimates of current price GVA.
Figures 1a and 1b show the change to the industry composition of volume GVA growth across differing time periods. Both the average annual volume GVA growth and industry contributions have been largely unaffected, with no industry contribution being revised by more than 0.1 percentage points (ppts) in these periods as shown in Figures 1a and 1b.
Service industries has been revised upwards in both the pre- and post-crisis periods, and accounts for 90% and 85% of total GVA growth in these periods respectively. Within services, no industry has been revised by more than 0.1 ppt across any period so there are minimal offsetting changes in GVA contribution between service industries. In the pre-crisis period, the revision to the service industries contribution to volume GVA growth can be attributed solely to an upward revision in the Information and Communications industry. The revision to the contribution of services industries in the post-crisis period can be attributed to the Real Estate industry. Annex C provides further information on the indicative industry-level volume GVA weights in Blue Book 2019.
Figure 1a: The industry composition of volume GVA growth is largely unrevised
Contributions to the pre-crisis vs post-Crisis volume GVA Growth, UK, 1998 to 2016
Source: Office for National Statistics
Notes:
- Figures may not sum reflecting that there is non-additivity in chained volume estimates before the reference year.
- Volume GVA growth and its contributions are based on the arithmetic averages for these periods.
- Total services are the sum of the individual service industry’s volume GVA growth contributions.
Download this chart Figure 1a: The industry composition of volume GVA growth is largely unrevised
Image .csv .xls
Figure 1b: The services industries contribution to volume GVA growth is largely unrevised
A breakdown of the services industries’ contribution to volume GVA growth, UK, 1998 to 2016
Source: Office for National Statistics
Download this chart Figure 1b: The services industries contribution to volume GVA growth is largely unrevised
Image .csv .xlsCurrent Price Estimates
Table 2 provides indicative estimates of current price annual output growth in Blue Book 2019 for these selected periods, as well as information on the size of the revisions. Headline nominal output growth has been largely unrevised across all periods, although revisions at the industry level are larger.
The new Annual Survey for Goods and Services (ASGS) has improved the quality and granularity of estimates of the types of products that are produced by different industries. It does not, however significantly impact upon our estimates of total output of each industry. As such, current price industry output would not be expected to be materially impacted. However, the ASGS estimates may impact upon volume estimates of industry output. This is because improvements to the product mix of output produced by each industry will subsequently impact the weights given to each product when deflating, resulting in revised estimates.
| Industry Weights (2016) | 1997 to 2007 | 2008 to 2009 | 2010 to 2016 | |
|---|---|---|---|---|
| Total Output | 100.0% | 5.2 (0.0) | 0.6 (0.1) | 3.2 (0.1) |
| Agriculture | 0.9% | 0.5 (0.2) | 5.6 (1.1) | 2.8 (0.8) |
| Production | 20.1% | 2.2 (0.3) | -0.5 (0.3) | 2.5 (-0.4) |
| Construction | 8.3% | 7.6 (0.1) | -4.7 (1.6) | 4.9 (-0.1) |
| Distribution, Transport, Hotels and Restaurants | 17.4% | 4.5 (-0.3) | -0.3 (-0.3) | 3.3 (0.0) |
| Information and Communication | 5.9% | 6.0 (-1.0) | 0.0 (-0.4) | 3.7 (0.5) |
| Financial and Insurance | 8.1% | 9.5 (0.2) | -1.8 (0.1) | 1.1 (0.0) |
| Real Estate | 9.5% | 4.2 (0.0) | 2.6 (-0.6) | 4.1 (0.1) |
| Professional and Support Activities | 11.4% | 7.2 (-0.5) | 0.2 (-0.9) | 5.2 (0.9) |
| Government, Health and Education | 15.6% | 7.2 (0.1) | 6.4 (0.3) | 2.2 (0.3) |
| Other Services | 2.9% | 5.9 (-0.4) | 3.9 (1.9) | 3.5 (-0.3) |
Download this table Table 2: Current price total output growth is largely unrevised, with offsetting revisions at the industry level
.xls .csvFigure 2 compares the industry composition of current price output for 2016, as revisions to the industry-level weights may offer some insight as to why the composition of volume GVA growth has been revised. These latest compositions primarily reflect a carrying out of a full rebalance of GDP for all years, in addition to the effects of the methodological improvements that have been implemented in this year’s Blue Book. We examine the effects in the latest year for this period (2016) here. The net revisions to these headline industry splits are minimal for this year. It is a similar story for earlier years, with no industry being revised by more than one percentage point in a single year.
Figure 2: The 2016 industry composition of current price output is largely unrevised
Comparisons of the industry composition of current price output, UK, 2016
Source: Office for National Statistics
Download this chart Figure 2: The 2016 industry composition of current price output is largely unrevised
Image .csv .xlsIntermediate Consumption
One of the milestones in this year’s Blue Book is the full reintroduction of the Purchases Survey, which provides our latest insights into the intermediate consumption of each industry broken down by product. Production processes change over time, reflecting advances in information and communications technology, the emergence of new industries and products, import substitution, organisational changes and behavioural responses to movements in input prices.
Over the last 10 years we have estimated the proportion of products consumed as intermediates by each industry by using product mixes reflecting information from the Annual Business Survey, adjusted to reflect other information available. The improvements in Blue Book 2019 permit direct estimation at a more granular level, resulting in higher accuracy in terms of which products are intermediately consumed by industry.
As part of Blue Book 2019, there has been more emphasis on data confrontation in the balancing of current price estimates. This holistic approach, taking on all available information, produces more coherent estimates of GDP. This has benefited the balancing process as this new information can now be utilised to guide the process. As such, the current price industry level of intermediate consumption is revised, thereby impacting upon their respective input-output ratio – the value of inputs needed to produce a single unit of output.
Figure 3a shows the input-output ratios at an industry level, in current prices. The ratio for services has remained low and stable throughout the time period, although there is greater variance in its profiles across the different service industries (see Annex C). This relates to the level of the ratio of inputs to output, but also its trend over time. For example, this ranges from a maximum of 0.54 on average for the Finance and Insurance industry to a minimum of 0.20 on average for the Real Estate industry. The ratio for Real Estate has the largest shift around the financial crisis, increasing from 0.16 to 0.27 in 2009.
Figure 3b shows how these ratios have been revised at the industry level, capturing the latest estimates on how inputs relate to output as part of the production process. However, these do not reflect the relative size of that industry. For example, it shows that revisions are larger in the agriculture industry, notably in 2009, in part due to higher quality information on intermediate consumption which is feeding into the balancing process. As the agriculture industry accounts for approximately 0.7% of the economy, these revisions have minimal impact at the economy-level.
Figure 3a: The services industry’s input-output ratio is low and stable throughout the time period, with greater variance seen
Current price input-output ratios, UK, 1997 to 2016
Source: Office for National Statistics
Download this chart Figure 3a: The services industry’s input-output ratio is low and stable throughout the time period, with greater variance seen
Image .csv .xls
Figure 3b: The agriculture industry’s input-output ratio has been most notably revised, in 2009, although it has minimal impact on the economy-level input-output ratio given its weight
Revisions to the current price input-output ratio, UK, 1997 to 2016
Source: Office for National Statistics
Download this chart Figure 3b: The agriculture industry’s input-output ratio has been most notably revised, in 2009, although it has minimal impact on the economy-level input-output ratio given its weight
Image .csv .xlsExpenditure approach to measuring GDP
Earlier analysis highlighted there has not been a marked shift in composition between domestic and external demand, as the contributions of net trade over these periods are largely unchanged. However, there have been slight revisions to the composition of domestic demand. Table 3 shows the expenditure composition of average volume GDP growth over the period 1998 to 2016, including revisions.
| Current Price (%,ppt) | Volume (%,ppt) | Implied Deflator (%,ppt) | |
|---|---|---|---|
| GDP | 4 (0.1) | 2.1 (0.1) | 1.9 (0.0) |
| Household Final Consumption Expenditure | 3.9 (0.0) | 2.4 (0.1) | 1.5 (-0.1) |
| Non-Profit Insitutions Serving Households Final Consumption Expenditure | 5.9 (0.5) | 1.7 (0.2) | 4.2 (0.3) |
| Gross Capital Formation | 4 (0.1) | 2.4 (-0.4) | 1.6 (0.5) |
| Government Final Consumption Expenditure | 5 (0.1) | 2.4 (0.2) | 2.5 (-0.1) |
| Exports | 4.7 (0.0) | 3.1 (-0.1) | 1.6 (0.2) |
| Imports | 5.1 (0.1) | 4 (-0.1) | 1.1 (0.1) |
Download this table Table 3: There has not been a marked shift in composition between domestic and external demand
.xls .csvWe have been able to open all years from 1997 for a full rebalance of GDP, revisiting how balancing has historically been carried out and improving how we have applied previous adjustments. We have been able to allow instances where the estimates now better reflect the underlying source information and to apply balancing adjustments in a more targeted manner, such as where we know there is underreporting. For example, the retail sales estimates used by household final consumption expenditure have been adjusted in order to better account for sales by businesses directly to households, which forms the sampling frame for the Annual Business Survey.
The new framework also allows us to review how best to apply deflation for these transactions, although we have continued to use Consumer Price Indices in this part of the UK National Accounts for many of these transactions.
Additional analysis provides a more in-depth explanation of the revisions to gross fixed capital formation (see Annex B for more information). The main features relate to changes to the improved current price product allocation in the Supply and Use Tables (SUT) framework and the consistent application of the best available deflators for those transactions. We have also incorporated improvements to our current price estimates, including those that relate to intangible investment such as intellectual property products, research and development and artistic originals.
As explained in published analysis, the improvements in trade estimates primarily reflect enhancements to the Balance of Payments adjustments and estimates of UK monetary financial institutions’ intragroup fees and cost recharges. There have also been refinements to some of the underlying services trade deflators, to better reflect movements in foreign prices.
Income approach to measuring GDP
Previous analysis highlighted how the improved capital stock estimates in Blue Book 2019 has led to upward revisions to the level of current price GDP, reflecting how these changes feed into estimates of the consumption of fixed capital (CFC). These developments have primarily impacted on the capital share of income, leading to upward revisions of gross operating surplus (GOS), specifically for general government and non-profit institutions serving households (NPISH).
Output for non-market producers is recorded by summing their costs, which includes intermediate consumption, compensation of employees, consumption of fixed capital, and other taxes on production. Figure 4 shows the indicative estimates of unadjusted labour share of income – the share of compensation of employees (CoE) in GDP – compared with the latest available estimates. The change in the level of this share is equivalent to 0.4% of GDP on average, while the underlying trend is largely the same.
Figure 4: Improved capital stocks estimates in Blue Book 2019 has led to revisions to the level of unadjusted labour share of income
Revisions to the unadjusted labour share of income, UK, 1997 to 2016
Source: Office for National Statistics
Notes:
- The unadjusted labour share of income is taken as compensation of employees as a share of GDP. No adjustments are made to mixed income to consider the labour income of the self-employed.
Download this chart Figure 4: Improved capital stocks estimates in Blue Book 2019 has led to revisions to the level of unadjusted labour share of income
Image .csv .xlsQuarterly path of GDP
Figure 5 shows the revisions to the quarterly path of volume estimates of GDP over the period Quarter 2 1997 to Quarter 4 2016. The profile of the financial crisis is largely unchanged in these indicative estimates for Blue Book 2019. It remains the case that output fell for the same five consecutive quarters, although the peak-to-trough fall in GDP is now estimated to be 6.0% – a revision from 6.3% (see Annex C).
There have been small revisions over this period which include the turning point itself. GDP growth has been revised down in the final quarter of 2007 from 0.8% to 0.5%, followed by some small offsetting upward revisions through the first half of 2008. This includes the first quarter of the financial crisis – GDP is now estimated to have fallen by 0.6% in the second quarter of 2008, revised from a fall of 0.7%. The published estimates show that it took 21 quarters for the UK economy to recover to its pre-downturn levels. It is now estimated to have returned to these levels one quarter earlier in Quarter 1 2013. As of the end of 2016, UK GDP is now estimated to have been 9.0% higher than its pre-downturn peak, an upward revision from 8.7%.
There have also been some revisions to the quarterly path through 2016. GDP growth has been revised up from 0.2% to 0.5% in Quarter 2, attributable to an upward revision in net trade for this period, while there has also been a small downward revision to the final quarter of the year to 0.6%. Further analysis showing current price, volume and the implied deflator quarterly growth rates can be found in Annex F, G and H respectively.
Figure 5: Indicative estimates for Blue Book 2019 show that the quarterly path is largely unchanged, though there are some revisions around the turning
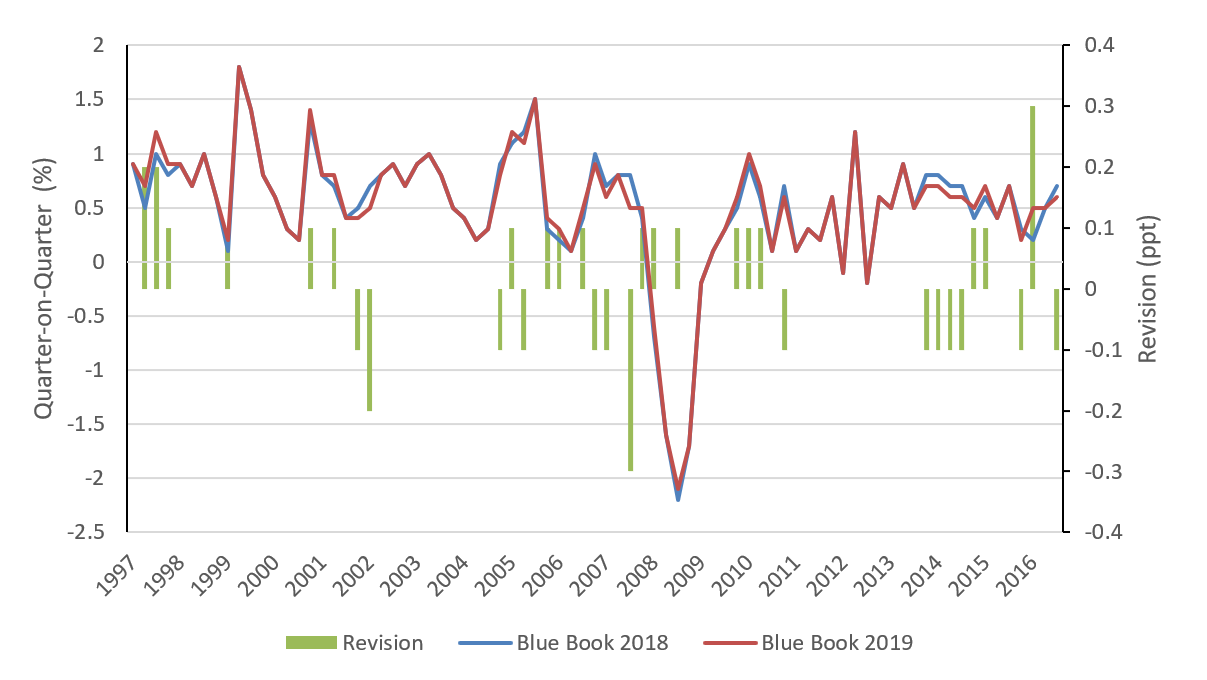
Source: Revisions to the quarterly volume estimates of GDP, UK, 1997 Quarter 2 (Apr to June) to 2016 Quarter 4 (Oct to Dec)
Download this image Figure 5: Indicative estimates for Blue Book 2019 show that the quarterly path is largely unchanged, though there are some revisions around the turning
.png (74.0 kB) .xlsx (25.3 kB)
To put the size of these revisions into context, they can be compared to those revisions published in previous Blue Books. There are numerous ways to summarise revisions, including the following:
- The mean revision (MR) shows whether there is a systematic tendency for estimates to be revised upwards or downwards from the initial estimates and gives an indication of the reliability of the initial estimate.
- The mean absolute revision (MAR) measures its absolute size so upward revisions are not offset by downward revisions of the same magnitude.
- The mean square revision (MSR) incorporates both the degree of bias and the variance of the revision, as large revisions are treated more seriously than small revisions.
Figure 6 compares the MAR from Blue Book 2004 to Blue Book 2019 inclusive, illustrating how the size of the most recent set of revisions to quarterly volume GDP growth compares with those in previous Blue Books. The revisions relate to the period from Quarter 1 1997 to the latest quarter available in that publication. It also includes the MAR in this year’s Blue Book, based on the indicative figures from 1997 to 2016 inclusive.
These revisions (0.09) are lower in magnitude than the typical Blue Book over this period (0.11), though this in part reflects the scale of revisions in the early 2010s. Blue Book 2011 includes the switch from RPI to CPI, while Blue Book 2014 captures the incorporation of European System of Accounts 2010 in the UK National Accounts. Annex C provides fuller comparative analysis of the revisions performances of these Blue Books.
Figure 6: The revisions in this year’s Blue Book are lower in magnitude than the typical Blue Book over this period
A Comparison of Blue Book Revisions: Mean Absolute Revisions to Quarterly Volume GDP Growth, 2004 to 2019
Source: Office for National Statistics
Notes:
- The revisions in each Blue Book relate to the period from Quarter 1 1997 to the latest quarter available in that publication. The exception here is Blue Book 2019, where indicative estimates up to Quarter 4 2016 are only included.
- Blue Book 2007 and Blue Book 2010 were closed for methodological revisions.
- Blue Book 2011 includes the switch from RPI to CPI, while Blue Book 2014 captures the incorporation of European System of Accounts 2010 in the UK National Accounts.
- The chart is calculated on the revisions between a Blue Book round and the preceding vintage.
Download this chart Figure 6: The revisions in this year’s Blue Book are lower in magnitude than the typical Blue Book over this period
Image .csv .xlsNotes for Analysis
- These adjustments are currently not made to the Index of Production, the Index of Construction or the retail sector within the Index of Services.
4. Conclusions
Blue Book 2019 marks a further step in our transformation of the UK National Accounts. We have used the new Supply and Use Tables framework to inform the volume estimates for headline gross domestic product (GDP), which includes greater emphasis on data confrontation in the balancing of current price and volume estimates. It has also provided the opportunity for us to review a wide range of quality considerations in how we apply deflation in the UK National Accounts. There has also been an improvement in our production approach to measuring current price GDP, reflecting new information on the sales of the services industry and the input costs incurred by businesses. We have also introduced a wide range of methodological improvements, most notably to estimates of capital stock in the UK.
The total package of current price GDP changes increases the size of the economy in 2016 by around 1.3% of GDP. Average growth of volume GDP over the period from 1998 to 2016 has been revised up 0.1 percentage point to 2.1% per year, while the average annual GDP implied deflator growth over the period from 1998 to 2016 remains unchanged at 1.9% per year. New information on the indicative quarterly estimates show the peak-to-trough fall of the 2008 economic downturn in GDP is now 6.0%, revised from 6.3%. These revisions are lower in magnitude than the typical recent Blue Book , though this in part reflects the scale of revisions in the early 2010s.
We will continue our development of UK National Accounts in the coming years, with plans for the implementation of double deflated estimates of industry GVA. We will use the SUTs framework to inform our future development plans, including investment in new deflators, to improve the coherence and consistency of our estimates as we continue to transform how GDP is compiled in the UK.
Back to table of contents6. Annex A: the “H-Approach”
The United Nations Handbook on Supply, Use and Input-Output Tables with Extensions and Applications (PDF, 9.47MB) lays out the full framework of the “H-Approach”, which is the recommended way to compile estimates of gross domestic product (GDP). It brings together the compilation of Supply and Use Tables (SUTs) in current prices and in volume terms, the valuation at basic prices, producers’ prices and purchasers’ prices, as well as the links with the compilation of Input Output Tables (IOTs), institutional sector accounts and the physical SUTs and IOTs. Its full application also allows for volume gross value added (GVA) to be estimated using double deflation as well as greater coherence linking SUTs to various other parts of the System of National Accounts 2008 (PDF, 9.08MB).
One of the main features of the “H-Approach” is to allow consistent deflation across different types of transactions in the UK National Accounts where they are related to the same product, following the principle that the buyer and seller pay the same price in a transaction at basic prices. The implication of this is that the core elements of both the SUTs need to be on the same price basis. As the SUTs are measured in basic prices and purchasers' prices respectively, adjustments need to be applied, on the same price basis. These can be deflated at basic prices using a common set of deflators for each product. Further information on the use of the SUTs framework can be found in the National Accounts articles: Transformation of GDP in Blue Book 2019 which was published on 11 October 2018.
Back to table of contents
7. Annex B: Publication schedule for Blue Book and Pink Book 2019
Improvements to the processing of Non-Profit Institutions Serving Households (NPISH) data
Released 20 August 2019
This article details the improvements made to the estimates of the Non-Profit Institutions Serving Households (NPISH) sector for the years 1997 to 2016. These changes include updated data sources and methodologies. The article focuses on the impact on current price data and demonstrates the revisions to the overall size of the NPISH sector.
Impact of Blue Book 2019 changes in gross fixed capital formation and business investment.
Released 20 August 2019
This article summarises the main changes to estimates of gross fixed capital formation (GFCF) and business investment for the years 1997 to 2016. These changes include updated data sources and methodologies. The changes are then put into context by analysing their impact on annual GFCF and business investment data as well as the impact on GDP.
Changes of the capital stock estimation methods for Blue Book 2019.
Released 20 August 2019
This article outlines the methodological changes to the capital stock estimates implemented as part of Blue Book 2019. It includes new estimates for asset lives, implementation of hyperbolic age efficiency and better treatment of transfer costs.
UK trade data impact assessment from new developments: 1997 to 2016
Released 20 August 2019
This article summarises the main changes to estimates of annual UK Trade for the years 1997 to 2016, in both current prices and chained volume measures. These changes include updated data sources and methodologies. The impacts of these changes on both trade in goods and trade in services , as well as the impact on GDP, are analysed.
Detailed assessment of changes to Sector and Financial Accounts, 1997 to 2016
Released 30 August 2019
This article gives a detailed assessment of changes to annual Sector Accounts estimates for the year 1997 to 2016. Changes reflect updated data sources and methods as part of Blue Book 2019. The article presents the impacts these have on the UK’s domestic sectors as well as its international position with the rest of the world. Revised figures for the Blue Book 2019 are published on 30 September 2019.
Detailed assessment of changes to Balance of Payments annual estimates, 1997 to 2016
Released 30 August 2019
This article summarises the main changes to estimates of annual UK Balance of Payments statistics for the years 1997 to 2016. Changes reflect updated data sources and methods as part of Blue Book and Pink Book 2019, and the article presents the impacts these have on the UK’s current account, financial account and international investment position.
Latest developments and changes to capital stocks to be implemented in Blue Book 2019.
Released 30 August 2019
This article summarises the main impacts of methodological changes outlined in, ‘Changes of the capital stock estimation methods for Blue Book 2019’. The article will identify the effect of the methodological changes, including new estimates for asset lives and the implementation of hyperbolic age-efficiency, on estimates of capital consumption and net capital stock."
Publication of Blue Book and Pink Book 2019 consistent Quarterly National Accounts, Quarterly Sector Accounts and Balance of Payments
Released 30 September 2019
Alignment between public sector finances and national accounts
Released September 2019
This article compares the estimates of public sector net borrowing published in the monthly public sector finances (PSF), on 24 September 2019, Quarterly National Accounts (QNA), published on 30 September 2019, and summarises the reasons for the differences identified.
Publication of Blue Book 2019 and Pink Book 2019
Released 31 October 2019
Back to table of contents8. Annex C: Supplementary Analysis
Figure C1: Breakdown of industry level volume GVA
Blue Book 2019
Source: Office for National Statistics
Download this chart Figure C1: Breakdown of industry level volume GVA
Image .csv .xls
Figure C2: Breakdown of service sector input-output ratios
Current price input-output ratios – Services industries, UK, 1997 to 2016
Source: Office for National Statistics
Download this chart Figure C2: Breakdown of service sector input-output ratios
Image .csv .xls
Figure C3: The peak-to-trough fall in GDP in the last downturn has been revised from 6.3% to 6.0%, whilst the UK economy is estimated to have returned to its pre-downturn levels one quarter earlier
Revisions to the quarterly path for volume estimates of GDP, UK, 2006 Quarter 1 (Jan to Mar) to 2016 Quarter 4 (Oct to Dec)
Source: Office for National Statistics
Download this chart Figure C3: The peak-to-trough fall in GDP in the last downturn has been revised from 6.3% to 6.0%, whilst the UK economy is estimated to have returned to its pre-downturn levels one quarter earlier
Image .csv .xls
Figure C4: Mean revisions to quarterly volume GDP growth by Blue Book
Source: Office for National Statistics
Notes:
- The revisions in each Blue Book relate to the period from Quarter 1 1997 to the latest quarter available in that publication. The exception here is Blue Book 2019, where indicative estimates up to Quarter 4 2016 are only included.
- Blue Book 2011 includes the switch from RPI to CPI.
- The chart is calculated on the revisions between a Blue Book round and the preceding vintage.
Download this chart Figure C4: Mean revisions to quarterly volume GDP growth by Blue Book
Image .csv .xls
Figure C5: Mean square revisions to Quarterly Volume GDP Growth by Blue Book
A Comparison of Blue Book Revisions: Mean Square Revisions to Quarterly Volume GDP Growth
Source: Office for National Statistics
Notes:
- The revisions in each Blue Book relate to the period from Quarter 1 1997 to the latest quarter available in that publication. The exception here is Blue Book 2019, where indicative estimates up to Quarter 4 2016 are only included.
- Blue Book 2011 includes the switch from RPI to CPI, while Blue Book 2014 captures the incorporation of European System of Accounts 2010 in the UK National Accounts.
- The chart is calculated on the revisions between a Blue Book round and the preceding vintage.