Table of contents
- Summary
- Introduction
- Present approach to estimating GDP in the UK
- Challenges to the present approach
- The new framework
- Double deflation
- Changes to source data
- Benefits, challenges and next steps
- Conclusions
- Authors
- References
- Glossary of terms
- Annex A: “H-Approach”: Full framework
- Annex B: Single deflation bias
1. Summary
This article is part of a series describing changes to National Accounts, detailing the improvements being made to UK National Accounts, the Blue Book and UK Balance of Payments, Pink Book 2019 editions. The improvements being made are to ensure that they continue to provide the best possible framework for analysing the UK economy and for comparing it with those of other countries.
It sets out the present approach used by the UK to compile the volume measure of gross domestic product (GDP) and the new approach that will be adopted when the Blue Book 2019-consistent quarterly national accounts are published in September 2019. In Blue Book 2019, Office for National Statistics (ONS) will introduce a new framework to produce GDP, both in current prices and in volume terms. This framework is the international “gold standard” in producing fully reconciled GDP estimates, supported by improvements to main data sources, this will come together to give an approach to measuring GDP that is fit for the future.
The adoption of this new framework will change our approach to deflation (adjusting for price changes). By using consistent deflators for goods and services produced in the economy, we will produce a better, consistent and more coherent measure of economic activity. The products consumed through intermediate consumption, final consumption, gross capital formation or exported are either produced domestically or imported. These changes ensure that the products are deflated consistently on both the supply and use side using specific deflators. This will also meet ONS’s long-held aim of producing “double deflated” estimates of gross value added (GVA) by industry1.
Double deflation is widely recognised as the best approach to producing volume estimates of GVA and has been the focus of important recommendations from the National Statistics Quality Review and the Independent Review of UK Economic Statistics.
This article outlines the new framework (called the “H-Approach”), explains why double deflation is considered best practice underlying the estimation of volume GVA, and in turn, GDP and considers the benefits and challenges of this new approach.
The package of related improvements (to the framework, source data and the introduction of double deflation) that have been explained in this article may lead to revisions of current price and volume estimates of GDP, both at the total economy level, by industry and by product. Preliminary estimates of these impacts will be published in advance of their formal implementation in the UK National Accounts from spring 2019.
This technical article gives a detailed overview of our planned changes, while also published today are an article and blog giving a higher-level view of the changes and their wider context.
Notes for: Summary
- See (Ahmad, 1999) and (Powell, 2002) for more details
2. Introduction
The volume estimate of gross domestic product (GDP) is one of the main economic indicators produced by the national accounts framework. It measures the rate at which the economy in volume terms is expanding or contracting and is of interest to policymakers and commentators alike.
GDP is first measured in current price or nominal terms, with estimates valued in the prices of the period when the activity occurred. It is then deflated to remove the effects of price changes to give volume GDP. GDP can be measured using three different approaches: production, income and expenditure. In the UK, we compile and draw on information from all three approaches and balance them together to arrive at a single estimate of GDP that uses all available data.
The international guidance and best practice is to confront the estimates from the three approaches using the supply and use tables (SUTs) framework, which reconciles at a detailed level the supply of goods and services produced domestically and imported with their use – either consumed, invested or exported.
Office for National Statistics (ONS) currently uses the SUTs framework to set the annual current price level of GDP. In Blue Book 2019, the application of this framework will be extended to also set the level of volume GDP. This article sets out the present approach to estimating GDP the new approach that will be adopted in Blue Book 2019 and some of the considerations in making the change.
The remainder of this article is structured as follows:
Section 3 outlines the present approach to estimating GDP in the UK
Section 4 sets out the challenges to the present approach
Section 5 explains the new framework, for estimating GDP to be used in Blue Book 2019
Section 6 provides information on the introduction of double deflation for GDP by industry
Section 7 covers the changes to source data
Section 8 outlines benefits, challenges and next steps
Section 9 presents the conclusions
3. Present approach to estimating GDP in the UK
The three approaches to measuring gross domestic product (GDP) – production, income and expenditure (Table 1) – are balanced together to produce one estimate of GDP. In short-term economic measurement, the production approach is sometimes referred to as the “output” approach as proxies are used, as not all the data required to fully measure production are available.
Table 1: Approaches to measuring gross domestic product
| Abbreviation | Approach | Description |
|---|---|---|
| GDP(P) | Production approach | Sum of all production activity within an economy |
| GDP(I) | Income approach | Sum of all factor incomes within an economy |
| GDP(E) | Expenditure approach | Sum of all final expenditures (less imports) within an economy |
| Source: Abridged from (Lee, 2012) | ||
Download this table Table 1: Approaches to measuring gross domestic product
.xls (35.8 kB)In early estimates of GDP, there are more limited data available, compared with that available for later estimates. Therefore, early estimates of GDP are reconciled only at a headline level. After around 18 months, sufficient data are available to allow a more detailed reconciliation of the three approaches to take place. GDP balancing is broadly split into three stages:
annual GDP current price balancing through the production of supply and use tables (SUTs)
quarterly GDP alignment in current prices and in volume terms for the years covered by the SUTs
quarterly GDP alignment in current prices and in volume terms for periods after the SUTs for the latest year
Annual GDP balancing through the production of SUTs
The annual balanced level of current price GDP is arrived at through the SUTs framework, using data on production, income and expenditure. As shown in Figure 1, the SUTs show the composition and value of goods and services that comprise final consumption expenditure, gross capital formation and net trade, the outputs and incomes that are generated as part of this production process and the intermediate inputs that feed into production. This is used to show a balanced and complete picture of the flows of products in the economy. The SUT framework is then used to achieve consistency by linking the components of gross value added (GVA), inputs, outputs and final uses, balancing supply and uses for products at a detailed level.
As the income, production and expenditure measures of GDP can all be calculated from the SUTs, a single estimate of GDP can be derived by balancing the supply and use for goods and services and reconciling them with the corresponding GVA estimates.
Figure 1: Framework for a coherent picture of the economy – supply and use tables
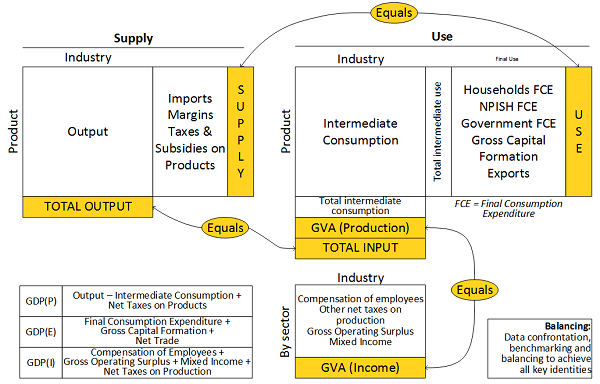
Source: Office for National Statistics
Download this image Figure 1: Framework for a coherent picture of the economy – supply and use tables
.png (103.3 kB)
The SUTs are normally available 18 months after the end of the latest year. For example, in Blue Book 2018 published in October 2018, the SUTs for the year 2016 were published. This is due to the extensive availability of annual data sources and administrative sources required for the compilation and balancing processes.
Annual surveys have a longer lead time due to the detail that is required from establishments, and the subsequent lead time for processing of results and validation. The balancing process itself is resource intensive as each of the 112 products and 112 industries are reviewed iteratively, and the relative strengths of each data source considered to produce a balanced set of accounts.
Quarterly GDP alignment in current prices and in volume terms for the years covered by the SUTs
Once the annual current price data are balanced, we use the expenditure approach to set the annual level of volume GDP, using deflation and chain-linking methods. Hence, in the UK, volume growth of GDP for the years covered by the SUTs is set by the deflated estimates of final consumption expenditure, gross capital formation and net trade.
The justification for this approach is because the production approach to volume GDP only measures output and not GVA. Whilst using output as a proxy for the short-term is sensible, it is less so for the long-term as it relies on the assumption that output grows at a constant ratio to GVA, that is, that the movements in inputs and outputs are the same.
Quarterly GDP alignment in current prices and in volume terms for periods after the SUTs for the latest year
For the periods after the last year for which the SUTs are available, a different approach is used to determine a balanced estimate of GDP, reflecting the relatively limited availability of data at this point in the production cycle. Instead, volume GDP growth in early vintages of GDP is driven by the production approach to measuring GDP. As there is higher data content for the production or output measure in the early estimates, it is considered the most appropriate proxy to determine the path of quarterly GDP in the short-term, and the quarterly income and expenditure based estimates are aligned to the production based estimate.
Summary
Therefore, the present approach to compiling volume GDP in the UK, involves a mixture of leading on the production approach for the unbalanced years (that is, beyond the years where SUTs have been compiled) and leading on the expenditure approach for the balanced years (that is, for the years where the SUTs have been compiled). Naturally, this is a rolling process, where over time unbalanced years go through the balancing process and become balanced years.
As the two measures of volume GDP are only confronted at the top level, each component (industries for production and the different final use categories for expenditure) is aligned independently at the detailed level.
This is illustrated in Figure 2. The published volume GDP series is shown using the thick grey line, with GDP(P) and GDP(E) also shown at different points aligning to the published series. Figure 2 shows that GDP is balanced to the expenditure measure in SUT balanced years, while it is balanced to the production measure in the most recent quarters.
Figure 2: Illustration of gross domestic product volume balancing

Source: Office for National Statistics
Notes:
- Published data as at 10 August 2018 used from the ONS website.
- GDP discrepancies are not actual - for illustrative purposes only.
Download this image Figure 2: Illustration of gross domestic product volume balancing
.png (65.1 kB) .xlsx (27.2 kB)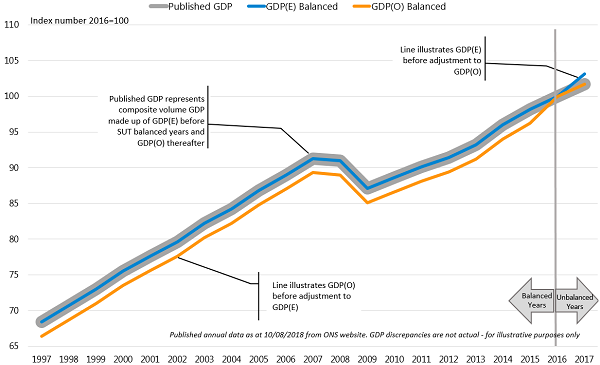
4. Challenges to the present approach
While the present approach uses the strength of the various data sources available at different points in time and provides a framework to produce reconciled estimates of gross domestic product (GDP), it does present a number of challenges in economic measurement.
Reconciliation of volume estimates
There is a fundamental difference in the balancing methods for current price and volume data. Whilst current price data for the supply and use side are reconciled using a 112 product by 112 industry matrix, volume data are effectively reconciled on a one by one matrix – that is, at the aggregate GDP level, rather than the detailed industry and product level. Although the detailed estimates are used to inform the approach, balancing adjustments are applied inconsistently and can lead to implausible implied deflators.
Separate current price and volume balancing
The process described previously is very sequential and does not allow the option to revisit the approach to balancing in current prices once deflation has taken place and volume estimates are available. This means that information that could be used to inform the current price balance is not available, which may have led to different balancing decisions.
Deflation approach
The production approach to measuring GDP is defined as GVA, which is equal to output less intermediate consumption, plus taxes less subsidies on products. As GVA is a residual concept, there are no prices that can be directly observed. As a result, there are three recommended approaches to estimating GVA, which are explained in Table 2, but it is recognised in the Handbook on Price and Volume Measures in National Accounts that the preferred method is double deflation.
Table 2: Deflation approaches for gross value added
| Approach | Method |
|---|---|
| Single Deflation | This approach uses a single deflator to deflate both output and intermediate consumption. This effectively assumes that input prices move in the same way as output prices for an industry. |
| Single Extrapolation | Under this approach GVA is extrapolated from the base period using the volume growth of output |
| Double Deflation | This approach uses separate deflators to deflate output and intermediate consumption independently. By taking account of the differences between input and output prices, this is considered to yield the best results. |
| Source: Abridged from (IMF, 2017) | |
Download this table Table 2: Deflation approaches for gross value added
.xls (35.8 kB)The UK currently uses a single extrapolation approach, in which the most recent balanced annual estimate of volume GDP is extrapolated by the subsequent growth rates of a output-based indicator. For the SUTs balanced years, as noted earlier, the expenditure approach leads with estimates of single deflated industry GVA aligned to expenditure is used instead.
Single extrapolation is implicitly based on the assumption that output grows at a constant ratio to GVA. During turning points and rapidly growing or slowing periods in the economy, this assumption will be particularly weak, particularly in the face of supply side shocks where the price of a specific product is impacted (for example, an oil price shock) – this example is explored in more detail in Section 6.
Application of deflators
Under our present approach, each component in GDP uses deflators directly relevant to the transaction being measured, at different levels of detail for the different components, and on different classifications. For example, the use of consumer prices in household final consumption expenditure on a classification of individual consumption by purpose (COICOP) basis and the use of producer price indices in the output of firms on a product basis. While this gives a good estimate of the prices of transactions in these specific components, at a GDP level, this introduces inconsistency where aside from definitional differences (for example, whether measurement is at basic or producer prices), we would expect a buyer and seller to pay one prevailing market price.
Back to table of contents5. The new framework
Our new approach in Blue Book 2019 will estimate volume gross domestic product (GDP) through the extended application of the supply and use tables (SUTs) framework rather than through the present approach of deflation using the expenditure approach to GDP. The process for the periods after the last set of SUTs to balancing the quarterly data will remain the same with the production or output measure continuing to take the lead as the most data-rich approach to GDP in initial vintages.
Calculating volume GDP through the SUTs Framework
Estimating volume GDP through the SUTs framework is the recommended international best practice. This is because deflation is carried out in a single and coherent framework at a detailed level, rather than at the total economy level. This leads to a set of coherent volume estimates across the production and expenditure approaches to GDP.
However, there are different methods to achieving this goal. The traditional approach, which has been adopted by some countries, has been to separately deflate the transactions by product within the SUTs framework using the best available deflator for each transaction by product. However, this results in unbalanced SUTs in volume terms, as each transaction within the SUT has been deflated independently. As such, when you aggregate supply and use to their totals, they will not match. Hence the volume SUTs then requires further balancing. It also does not ensure the principle that the buyer and seller in the same transaction must pay the same price.
Whilst this approach provides flexibility, it leads to a second stage of balancing with multiple iterations, which can lead to implausible results. Current price data come from a wide range of sources that estimate levels, so a balancing process is essential. In contrast, deflators come from a much narrower set of data that are only measuring change. As such, it makes sense to effectively select the best deflators (which may involve the weighting together of multiple deflators) in line with their relative strengths to deflate consistently, to ensure a balance between supply and use in volume terms.
The international guidance in this area has been updated recently with the publication of the Handbook on Supply, Use and Input-Output Tables with Extensions and Applications (PDF, 9.47MB). The preferred and international best practice approach to the compilation process and balancing SUTs in volume terms is known as part of the “H-Approach”.
The “H-Approach”
The “H” in the “H-Approach” refers to the full framework set out in the United Nations System of National Accounts 2008, which covers SUTs as well as their extension to input and output tables and beyond. This is set out in Annex A. The application of the “H-Approach” in this article only refers to the top part of the full “H-Approach” as shown in Figure 3.
The UK implementation of the “H-Approach” will produce SUTs in both current prices and in volume terms in Blue Book 2019. As mentioned, one of the outcomes will be estimates of double deflated gross value added (GVA) in the UK National Accounts. One of the main principles is that double deflation (explored in more detail in Section 6) occurs within a SUTs framework, ensuring that the two approaches of volume GDP are equal.
Figure 3 provides a high-level conceptual schematic of the approach, identifying five main stages. While these stages are presented in order, they are in practice iterative with several iterations likely before GDP is balanced – for the first time this will include an element of automated rules-based balancing. Each of the stages are outlined in more detail in Figure 3.
Figure 3: The "H-Approach" - the top part

Source: Adapted from United Nations 2018
Download this image Figure 3: The "H-Approach" - the top part
.png (86.5 kB)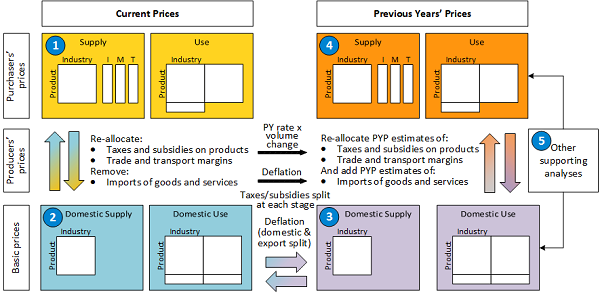
Stage 1
This shows the SUTs currently used to produce annual GDP in current prices. With the exception of adding the institutional sectors to the balancing framework to allow earlier and more coherent data production for institutional sector accounts, this will be unchanged in the Blue Book 2019 approach. The supply table includes domestic output by product and industry prices and imports (represented by “I”). The use table includes intermediate consumption, final consumption expenditure, gross capital formation and exports.
The main components in the supply table are measured in basic prices and the components of the use table are measured in purchases’ prices, except GVA, which is at basic prices. The differences between these two sets of prices are defined in Table 3.
To ensure that the tables are presented on the same conceptual price basis, imports, margins and taxes are included in the supply table, represented by the “I”, “M” and “T” in Figure 3. The SUTs at purchasers’ prices can be balanced independently but the balance may be revisited at a later stage in the process, reflecting the iterative nature of the “H-Approach”. The number of iterations will depend on several issues, including whether the tables are balanced sequentially or simultaneously.
Table 3: Explanation of price basis
| Basic Prices | |||||||||||||||||||||||||||
|---|---|---|---|---|---|---|---|---|---|---|---|---|---|---|---|---|---|---|---|---|---|---|---|---|---|---|---|
| + | |||||||||||||||||||||||||||
| Taxes less subsidies on products (excluding invoiced VAT) | |||||||||||||||||||||||||||
| = | |||||||||||||||||||||||||||
| Producers' prices | |||||||||||||||||||||||||||
| + | |||||||||||||||||||||||||||
| VAT not deductible by the purchaser | |||||||||||||||||||||||||||
| + | |||||||||||||||||||||||||||
| Separately invoiced transport charges | |||||||||||||||||||||||||||
| + | |||||||||||||||||||||||||||
| Retail and wholesale margins | |||||||||||||||||||||||||||
| = | |||||||||||||||||||||||||||
| Purchasers' prices | |||||||||||||||||||||||||||
| Source: Office for National Statistics | |||||||||||||||||||||||||||
Download this table Table 3: Explanation of price basis
.xls (36.9 kB)Stage 2
One of the main features of the “H-Approach” is to allow consistent deflation across different types of national accounts transactions where they are related to the same product, following the principle that the buyer and seller pay the same price in a transaction at basic prices. The implication of this is that the core elements of both the SUTs need to be on the same price basis. As the supply and use tables are measured in basic prices and purchasers' prices respectively (see Table 3), adjustments need to be applied. To do this we “reallocate” the imports, margins and taxes from within the use table, allowing the entries at purchases’ prices in the use table to be moved to basic prices (or producers’ prices, if appropriate).
To ensure that we fully use available data, these reallocations are done at the product level separately for Value Added Tax (VAT), other taxes, subsidies, trade and transport margins, imports of goods (EU), imports of goods (non-EU) and imports of services. If the current price SUTs at purchasers’ prices are balanced, then the SUTs at basic prices will also be balanced as the imports use matrix and the valuation use matrices are self-balanced – another important feature of the “H-Approach”.
Stage 3
Now that both tables are on the same price basis, they can be deflated to previous years’ prices (PYPs) using a common set of deflators for each product.
Figure 4: Lower level components of basic prices for deflation purposes
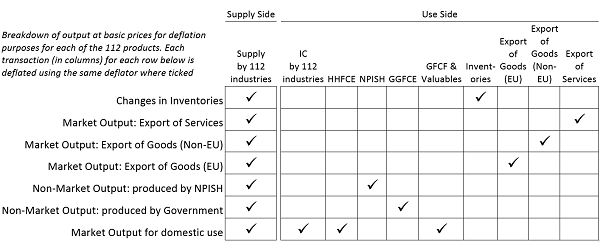
Download this image Figure 4: Lower level components of basic prices for deflation purposes
.png (39.4 kB) .xlsx (10.5 kB)
In practice, each "row" in Figure 4 represents 112 rows within that transaction, with each representing a product category. A deflator is available for each of these rows, with the underlying principle that the buyer and seller face the same price for that transaction. This allows for the consistent and coherent deflation in the SUTs framework.
Therefore, PYPs are used within the SUTs framework and chain-linked once the final balance is achieved. Time series in PYPs are derived from multiplying the volume series in the current period, by the average price of the previous year. PYPs are additive and are the method by which volume series can be aggregated together.
It is worth noting that the headline measure of volume GDP is a chained volume measure (CVM) – the time series has the effects of inflation removed by considering changes in quantity between consecutive periods and holding the prices in the previous period constant. However, the components of CVMs are not additive, meaning that they cannot be meaningfully balanced in a SUTs framework.
In addition to imports, margins and taxes, there are some elements of output at basic prices that, when separately identified, map directly across to the use table that benefit from deflation using their own set of deflators, these are identified in Figure 4. These are generally done to maximise the data used in the process, for example, non-market output produced by government is identified and deflated separately to allow the use of the rich range of direct volume indicators used in the UK. Once deflated, this results in SUTs at PYPs expressed at basic prices. As previously detailed, if the current price SUTs at purchasers’ prices are balanced, so are the tables.
Stage 4
To move to SUTs at PYPs expressed at purchasers’ prices, imports, margins and taxes are reallocated within the use table – reversing the steps taken between Stage 1 and Stage 2. As previously detailed, if the current price SUTs in purchasers' prices are balanced, by definition, so are the tables.
Stage 5
These results are then quality assured at detailed granular level, including against a range of external indicators and estimates deflated using transaction specific deflators. If adjustments are to be made there are a number of options available:
revisit the current price SUTs balance at purchasers’ prices
make adjustments to the items that form the transition between purchasers’ prices and basic prices
exceptionally, change the deflator’s used for a specific product
This process would be done iteratively to achieve the final balance.
It is important to stress here, that the “H-Approach” framework makes the best use of the deflators from both the supply and use side, rather than the univariate approach used currently. Hence, the expenditure deflators presently used will not simply be discarded in the “H-Approach”, but will be used where appropriate, based on quality assessments of the deflators.
As a final step, the PYPs estimates can then be chain-linked into a measure of volume GVA for the total economy and by industry.
Back to table of contents6. Double deflation
Double deflation is widely recognised as the best approach to producing volume estimates of gross value added (GVA), and in turn, gross domestic product (GDP) and has been the focus of important recommendations from the National Statistics Quality Review and the Independent Review of UK Economic Statistics.
One of the main benefits of introducing the “H-Approach” is the introduction of double-deflated estimates of industry level GVA. Through this approach, intermediate consumption (the goods and services used in the production process) will be deflated using prices relevant to products used in the production process, rather than the prices of the product being produced. There are other ways to implement double deflation in GDP estimation but the “H-Approach” provides the most rigorous framework for reconciling GDP estimates at a granular level.
Benefits of double deflation
Double Deflation: Theory and Practice sets out the main advantages of double deflation, summarised as:
there will be greater coherence in the national accounts, as the growth of volume GDP will be equal in principle when measured from both the production and expenditure perspective
it will produce better estimates of volume GVA at the industry level, where the growth rates of volume GVA at the industry level will aggregate to the growth of volume GDP
it will produce better measures of total factor productivity growth at the industry level – the following section on removing the effects of single deflation bias explores this in more detail
International comparisons
As shown in Table 4, the UK will join countries such as the United States, Australia and Canada in adopting double deflation.
Table 4: International comparisons of volume gross domestic product methods
| Country | Double deflation | Single extrapolation | Single deflation |
|---|---|---|---|
| Argentina | Yes | ||
| Australia | Yes | ||
| Brazil | Yes | ||
| Canada | Yes | ||
| China | Yes | ||
| France | Yes | ||
| Germany | Yes | ||
| India | Yes | ||
| Indonesia | Yes | ||
| Italy | Yes | ||
| Japan | Yes | ||
| Korea | Yes | ||
| Mexico | Yes | ||
| Russia | Yes | ||
| Saudi Arabia | Yes | ||
| South Africa | Yes | ||
| Turkey | Yes | ||
| United Kingdom | Yes | ||
| United States | Yes | ||
| Source: Table reproduced from (IMF, 2017) | |||
Download this table Table 4: International comparisons of volume gross domestic product methods
.xls (36.9 kB)The effects of double deflation
As noted previously, double deflation derived through the “H-Approach” means that for volume measures of GVA and GDP in the production approach, outputs and inputs are deflated separately using relevant product specific deflators. GDP by production is analysed from an industry perspective. As an industry could produce multiple products and use multiple intermediate inputs, double deflation ensures that:
outputs are deflated using deflators for the product produced
the products used as inputs to the production are deflated using relevant specific product deflators
In contrast, the current single extrapolation (and single deflation) approach assumes, from an industry perspective, that the inputs and outputs are the same and they are deflated using the price of the product produced only. This can lead to there being bias in estimates of volume GVA, as only double deflation ensures that the growth of volume GDP is equivalent when measured from the production and expenditure perspectives.
Single deflation
Single approaches have been shown to exhibit a bias – see Annex B for further information – which is driven by the deflation of intermediate consumption by the deflator of the product produced rather than the product used. This is well defined in Measure up: A better way to calculate GDP and a summary of that paper is provided in this section.
As the prices of different products will not necessarily move in synchronisation with one another, the absence of double deflation can lead to bias in estimates of volume GVA. This bias will reflect the relative change in output and input prices, which can be particularly pronounced when there are exchange rate shocks and/or oil and commodity price shocks. The implementation of double deflation will account for such relative price shocks in a more robust manner.
Figure 5 provides an overview of how a change in the oil price can impact on volume estimates of GDP under single deflation. For a country that is a net importer of oil, such as the UK, oil is an imported intermediate input.
If there is a sharp rise in the oil price, the immediate impact is for the price of its intermediation consumption to increase faster than the price of output. As such, if current price intermediate consumption is deflated by an output price index, the price of intermediate consumption will therefore be understated, and so the volume intermediate consumption overstated. It follows that the estimate of volume GVA will be understated than if it is deflated by an appropriate deflator for oil products. That is, there is negative bias under single deflation (see Annex B).
Figure 5 summarises the direction of this bias, depending on whether the country (or industry) is a net importer or exporter of oil and whether there is a rise or fall in the price of oil.
Figure 5: Single deflation, changes in fuel prices or exchange rates and the direction of gross domestic product bias
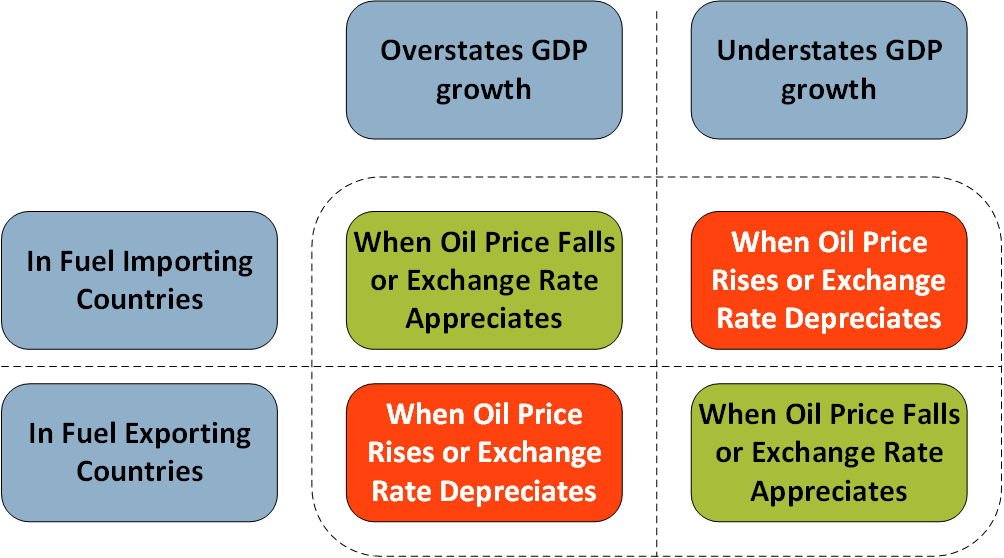
Source: Adapted from (IMF, 2017)
Download this image Figure 5: Single deflation, changes in fuel prices or exchange rates and the direction of gross domestic product bias
.png (54.9 kB)
A similar logic can be applied to understand the impact of a change in the exchange rate. If there is an exchange rate depreciation, the initial effect is for the cost of an industry’s imported intermediate inputs to rise relative to the price of its output. As with the previous example, this leads to there being negative bias and so the volume GDP for that industry is expected to be understated. This size of the bias will vary by industry, depending on the proportion of intermediate inputs that are imported.
Annex B provides further information but it can be shown that the relative size of the single deflation bias for an industry is more pronounced if:
there is a greater the share of intermediate consumption of GVA
there is a difference between output prices and intermediate consumption prices
The bias is only zero if there is no intermediate consumption or if the output and input deflators grow at the same rate.
Single extrapolation
In the UK, we produce volume GVA using single extrapolation. Volume GVA is estimated by assuming it grows at the same rate as the volume of output. Double Deflation: Theory and Practice provides a theoretical framework for understanding why double-deflated estimates of GVA at the industry level can differ from those estimates that are produced by single extrapolation. If we take the previous example of a shock to the exchange rate, it is helpful to see how this bias compares with that under single deflation. An exchange rate depreciation would increase the cost of imported inputs, leading to a shift in the relative prices of output and input. Single deflation will lead to a negative bias in industry-level volume GVA when input prices are increasing at a faster rate than output prices. However, under single extrapolation, we need to consider the response to this relative price change, as a rise in the price of the intermediate input could lead to a fall in the quantity of that input being used. In other words, single extrapolation requires that output grow at a constant ratio to GVA, which may no longer hold.
For example, a fall in the exchange rate would lead to a rise in the sterling value of those imported inputs. Depending on its price elasticity, that may lead to a slowing in how much intermediate inputs are imported. This may be offset by import substitution as UK firms shift to using domestically-produced inputs, or alternatively it could lead to a change in how output is produced, if it is more efficient for output to be produced in-house by firms. In this example, the bias in the estimates of volume GVA produced by single extrapolation may not be the same as that shown previously.
Back to table of contents7. Changes to source data
Two important surveys will also be introduced to improve the quality of the current price data within the supply and use tables (SUTs) framework at Blue Book 2019. These are the Purchases Survey (as set out in Development of the Annual Purchases Survey) and the Annual Survey of Goods and Services (as set out in Development of the Annual Survey of Goods and Services).
Double deflation requires updated information on the intermediate inputs into the production processes for each industry, the pattern of which is likely to have changed over time. The Purchases Survey provides a detailed breakdown of the goods and services purchased by businesses by product and therefore provides the detailed breakdown in the intermediate consumption matrix. The Annual Business Survey does include a broad breakdown by product but this is enhanced by the richer detail provided by the Purchases Survey. The survey was last run for the reference year 2004 and was re-introduced as an annual survey for the reference year 2015. This will provide a much richer understanding of the pattern of intermediate consumption by industry, thereby providing more accurate estimates of current price GVA added for each industry.
The Annual Survey of Goods and Services is a new survey that estimates the goods and services produced by each industry in the services sector. This builds upon the UK Manufacturers' Sales by Product (ProdCom) survey, which has existed for many years for the manufacturing industries. Services comprise around 80% of the UK economy by gross value added (GVA), so this will provide a much more reliable estimate of activity in the UK economy. This provides a near economy-wide breakdown of output by product, thereby improving estimates of current price output.
Both surveys improve both the quality of the product breakdown of the SUTs framework at current prices and also ensure that the production approach to measuring gross domestic product (GDP) is deflated more accurately to derive volume GDP.
Back to table of contents8. Benefits, challenges and next steps
This new approach will increase the quality of UK volume gross domestic product (GDP) estimates as follows:
by deflating within the supply and use tables (SUTs) framework, we achieve consistency between current price and volume balancing; this leads to a coherent set of supply and use estimates at the disaggregated level, coherent estimates of current price and volume industry output and coherent deflation of GDP
double deflation leads to improved quality estimates of volume GDP and productivity analysis, which is both more accurate and more comparable with other leading countries
a full description of how economic relationships have evolved is captured by measuring the real flow of goods and services between producers and consumers, showing the real contribution of each towards volume GDP
the new approach streamlines the business process where both current price and volume are embedded into the central production of the national accounts, which reduces the potential for inconsistencies
the new process integrates the institutional sector accounts at an earlier stage in the balancing process, allowing for the simultaneous population of the sectorised parts of the SUTs; this can be reconciled with other sectorised data, leading to better quality assurance of the data and therefore improved coherence between GDP and the institutional sectors and the sectors themselves
it provides an integrated framework for identifying the main areas of weakness in deflation, which can be targeted in future development work
it fulfils legislative requirements of the European System of Accounts 2010 Data Transmission Programme (Eurostat, 2014)
The UK implementation of the “H-Approach” to the UK National Accounts culminates in improving quality by:
compiling current price and volume GDP through the SUTs framework
using the “H-Approach” to balance current price and volume GDP at a detailed level
generating volume estimates of gross value added (GVA) using double deflation
Potential challenges
The new approach requires much more data than the current approach, not just in terms of deflators, but the information needed to disaggregate use tables from purchasers’ prices to basic prices.
Deflation through the SUTs framework provides a coherent total, but can be at the cost of some components, particularly at the more detailed level than that compiled within the SUT framework. This is the nature of producing a coherent set of macroeconomic accounts where the top-level data are the greater good. For example, detailed volume estimates of household expenditure that are below the level of deflation in the SUTs framework will be constrained to the higher-level deflation – potentially leading to some loss of quality at a very detailed level. This issue can be resolved by a more detailed product detail (beyond the 112 level). As part of the development of deflators, Office for National Statistics (ONS) will consider the most appropriate level to deflate in the SUTs framework in the future.
An important recommendation of the Independent Review of UK Economic Statistics was the need to improve the quality of deflators. As noted previously, this implementation of the “H-Approach” uses mostly the deflators that are already available. This is the first step in the journey to improve deflators. Improved deflators will be integrated into the SUTs framework in the coming years. The SUTs framework also provides an excellent basis for identifying areas for development and for prioritising (through the current price values).
The implementation of the “H-Approach” may lead to some revisions to volume GDP at the economy and the industry level. An important take-away is that any revisions will not simply reflect the introduction of double deflation into the UK National Accounts, but wider improvements that underpin the transformation of the production of volume GDP through the implementation of the “H-Approach” and new source data. There are also other changes being incorporated into the UK National Accounts, which may have an impact on GDP.
The changes here are part of a wider transformation of the UK National Accounts. As the programme of work continues, further updates will be provided to users, particularly of the potential impacts of the new approach, compared with the present approach, as well as identifying the main current price changes.
Back to table of contents9. Conclusions
This article sets out the planned improvements to the way in which volume estimates of gross domestic product (GDP) will be compiled in the UK from September 2019:
the changes outlined here are transformational in the approach to measuring GDP and represent the biggest change to the compilation method in a generation
compilation through the supply and use tables (SUTs) framework and the introduction of double deflation of gross value added (GVA) will bring the UK in line with international best practice and will greatly improve the coherence of the volume estimates across the national accounts
the new approach also integrates the institutional sector accounts at an earlier stage in the balancing process, which enables confrontation of both the SUTs framework and the Institutional Sector Accounts
this forms part of a wider transformation of the UK National Accounts, which will form part of the development plan to improve the quality of economic statistics over the coming years
The improvements that have been explained here may lead to the revisions of current price and volume estimates of GDP, both at the economy level and by industry. Preliminary findings of these impacts will be published in advance of their formal implementation in the UK National Accounts next autumn (Table 5), which will provide early indications of how the profile of volume output and productivity has been affected by these transformational improvements.
Table 5: Provisional publication schedule for Blue Book and Pink Book 2019
| Content of article | Provisional date of publication |
|---|---|
| Impact on GDP Current Price and Chained Volume Measure quarterly and annual estimates 1997-2014 | End April 19 |
| Detailed assessment of changes to Sector and Financial Accounts: 1997 to 2014 | May-19 |
| Detailed assessment of changes to Balance of Payments: 1997 to 2014 | May-19 |
| Impact on GDP Current Price and Chained Volume Measure quarterly and annual estimates 1997-2017 | Late July/ August 19 |
| Detailed assessment of changes to Sector and Financial Accounts: 1997 to 2017 | Aug-19 |
| Detailed assessment of changes to Balance of Payments: 1997 to 2017 | Aug-19 |
| Publication of Blue Book and Pink Book 2019 consistent Quarterly National Accounts, Quarterly Sector Accounts and Balance of Payments | Sept-19 |
| Publication of Blue Book 2018 and Pink Book 2019 | Oct-19 |
| Source: Office for National Statistics | |
Download this table Table 5: Provisional publication schedule for Blue Book and Pink Book 2019
.xls (35.8 kB)11. References
Ahmad N (1999), Experimental constant price input–output supply–use balances: an approach to improving the quality of the national accounts
Bean C (2016), Independent review of UK economic statistics: final report
Drew S (2011), Deflation improvements in the UK National Accounts
Drew S, Lewis P and McLaren C (2016), Chain-linking methods used within the UK National Accounts
Eurostat (2014), European System of Accounts 2010: ESA 2010 – Transmission programme of data
Eurostat (2016), Handbook on Price and Volume Measures in National Accounts
Gibbs C, Thompson G and Olney J (2018), Development of the Annual Survey of Goods and Services
Gough J (2017), Development of the Annual Purchases Survey
IMF (2017), Measure up: A better way to calculate GDP
Lee P (2012), Balancing the three approaches to measuring gross domestic product
Li J and Kuroko M (2016), Single Deflation Bias in Value Added: Verification Using Japanese Real Input-Output Tables (1960 to 2000)
Office for National Statistics (2014), National Statistics Quality Review: National Accounts and Balance of Payments
Oulton N (2018), Double Deflation: Theory and Practice
Powell M (2002), A report on current and planned ONS work on constant price input output supply-use balances
Stoneman P and Francis N (1994), Double Deflation and the Measurement of Output and Productivity in UK Manufacturing 1979 to 1989
United Nations (2009), System of National Accounts 2008
United Nations (2018), United Nations Handbook on Supply, Use and Input-Output Tables with Extensions and Applications
Back to table of contents12. Glossary of terms
Alignment
An alignment approach involves bringing the measures of gross domestic product (GDP) together at the top level. However, below that level, different components of the accounts adjust independently, which means that the detailed data are less coherent. This approach is less resource intensive.
Balancing
A balancing approach involves a detailed reconciliation of data sources to generate a coherent set of accounts. It is a resource intensive process, but yields a set of accounts that are coherent in a lot more detail.
Base year period
The year or period in which volume series are expressed using the value of the average prices.
Basic prices
The basic price is the price receivable by the producers from the purchaser for a unit of a good or service produced as output minus any tax payable on that unit as a consequence of its production or sale (such as taxes on products), plus any subsidy receivable on that unit as a consequence of its production or sale (such as subsidies on products). It excludes any transport charges invoiced separately by the producer. It includes any transport margins charged by the producer on the same invoice, even when they are included as a separate item on the invoice.
Chain volume measures
The result of joining together two indices that overlap in one period by rescaling one of them to make its value equal to that of the other in the same period, thus combining them into a single time series. Also referred to as “chain-linked volume”.
Chain-linking
The process of linking together volume series using link factors to form a consistent chain volume measure time series. There are three main linking methods: quarterly overlap, annual overlap and over the year.
Constant prices
Term referring to expressing values in terms of a base period. Also used to refer to the practice of five-yearly chain-linking as used before 2003 in the UK. Also referred to as “fixed base”.
Current prices
Estimates valued in the prices of the period when the activity occurred. Also referred to as “nominal prices”.
Deflator
"A "deflator" captures the changes in prices over time and is applied to revalue its quantities at the prices of the price reference period or to revalue the aggregate at the general price level of the price reference period.
Double deflation
Double deflation is a method whereby gross value added is measured in volume terms by subtracting intermediate consumption in volume terms from output in volume terms. Outputs and inputs are deflated separately using relevant deflators. This method is feasible only for constant price estimates, which are additive, such as those calculated using a Laspeyres’ formula (either fixed-base or for estimates expressed in the previous year’s prices).
“H-Approach”
The process of transforming the supply table by taking the balanced supply and use table (SUT) at purchasers’ prices, and decomposing it to basic prices, by splitting the use table into matrices for domestic output, imports, margins and taxes less subsidies. Each product is effectively split into lower-level elements, which are deflated separately before re-aggregation. This method means that both the supply and use side are therefore deflated on the same price basis, that is, the amounts received by the seller is the same as the amounts paid by the purchaser.
Import use matrix
The import matrix is required for the transformation of the use table from purchasers’ prices to basic prices and to input-output tables. It provides an expanded product view of imports of goods and services to show the industries that consume imports as part of intermediate consumption, as well as the decomposition to final uses.
Last base year or period
This is the last year or period in a chain volume series that is used as a base year or period. Series in the last base year are additive.
Market output
Output of goods and services sold at economically significant prices.
Non-market output
Output of own account production of goods and services provided free or at prices that are not economically significant. Non-market output is produced mainly by the general government and non-profit institutions serving households sectors.
Nominal prices
See Current prices.
Output for own final use
Production of output for final use or gross fixed capital formation by the producer. Also known as own-account production.
Previous years’ prices
The average price in the year preceding the period in which the activity took place. The series derived from multiplying the volume series in the current period, by the average price of the previous year. This process is also known as unchaining. Previous years’ prices are additive and are the method by which volume series can be aggregated together.
Purchasers’ prices
At the point of purchase, the purchaser's price is the price the purchaser actually pays for the products; including any taxes less subsidies on the products (but excluding deductible taxes like Value Added Tax (VAT) on the products); including any transport charges paid separately by the purchaser to take delivery at the required time and place; after deductions for any discounts for bulk or off-peak purchases from standard prices or charges; excluding interest or services charges added under credit arrangements; and excluding any extra charges incurred as a result of failing to pay within the period stated at the time the purchases were made.
Real terms
See Volume measure.
Reference year or period
The year or period in which the chain volume measure is equal to the current price value or for index numbers, where the index number is 100. In the reference year, the implied deflator is equal to one and series are additive.
Single deflation
Single deflation is a method whereby gross value added in volume terms is calculated by deflating it directly (usually using an output deflator).
Single extrapolation
A single indicator method of deflation is a means of estimating the volume movements of value added directly using only one time series as an indicator (for example, deflated output or deflated value added) instead of double deflation.
Supply table
Table of estimates of domestic industries’ output by type of product. Compiled at basic prices and includes columns for imports of goods and services, for trade and transport margins and for taxes less subsidies on products. The final column shows the value of the supply of goods and services at purchasers’ prices. This table shows which industries make which products. Columns represent the supplying industries; rows represent the products supplied.
SUT112
The generic term that refers to the industry and product breakdown at which the supply and use tables are compiled. The industry classification is consistent with Standard Industrial Classification 2007: SIC 2007 (which concords with NACE Rev 2) and Classification of Products by Activity 2008: CPA 2008 (which concords with CPA 2.1). It is also worth clarifying that whilst it is called SUT112, it is defined as 114 products due to the fact that whilst two groupings are defined, they are outside the national accounts production boundary.
Tail
Refers to the fixed base volume calculation used after the last base year for a chained volume measure (CVM) series – also referred to as “fixed base tail”. In effect, two methods joined together in the last base year.
Transition matrices
The transition matrices and generically describes import use matrices, trade and transport margins and taxes and subsidies matrices.
Use table
Table of the use for products by each industry group or sector, whether from domestic production or imports, estimated at purchasers’ prices. It displays the inputs used by each industry to produce their total output and separates out intermediate uses of goods and services. The table shows which industries use which products. Columns represent the purchasing industries; rows represent the products purchased.
Valuation matrix
The valuation matrix is required for the transformation of the use table from purchasers’ prices to basic prices. It provides an expanded product view of taxes, subsidies and trade and transport margins to the industries that consume it as part of intermediate use, as well as the decomposition to final uses.
Volume measure
At the detailed disaggregated level a volume index is most commonly presented as a weighted average of the proportionate changes in the quantities of a specified set of goods or services between two periods of time. In a volume measure, the estimates for all periods are in the same price.
Back to table of contents13. Annex A: “H-Approach”: Full framework
Figure 6 shows the “H-Approach” as laid out in the United Nations Handbook on Supply, Use and Input-Output Tables with Extensions and Applications. It is the recommended compilation approach as it brings together the compilation of SUTs in current prices and in volume terms, the valuation at basic prices, producers’ prices and purchasers’ prices, as well as the links with the compilation of input output tables (IOTs).
The full application of the “H-Approach” also allows for volume gross value added (GVA) to be estimated using a “double deflation” method as well as greater coherence linking supply and use tables (SUTs) to various other parts of the SNA 2008 framework including the institutional sector accounts and the environmental-extended IOTs and physical SUTs. More information on this can be found in the System of National Accounts 2008 (PDF, 9.08MB).
Figure 6: The “H-Approach”

Source: Office for National Statistics
Download this image Figure 6: The “H-Approach”
.png (1.9 MB)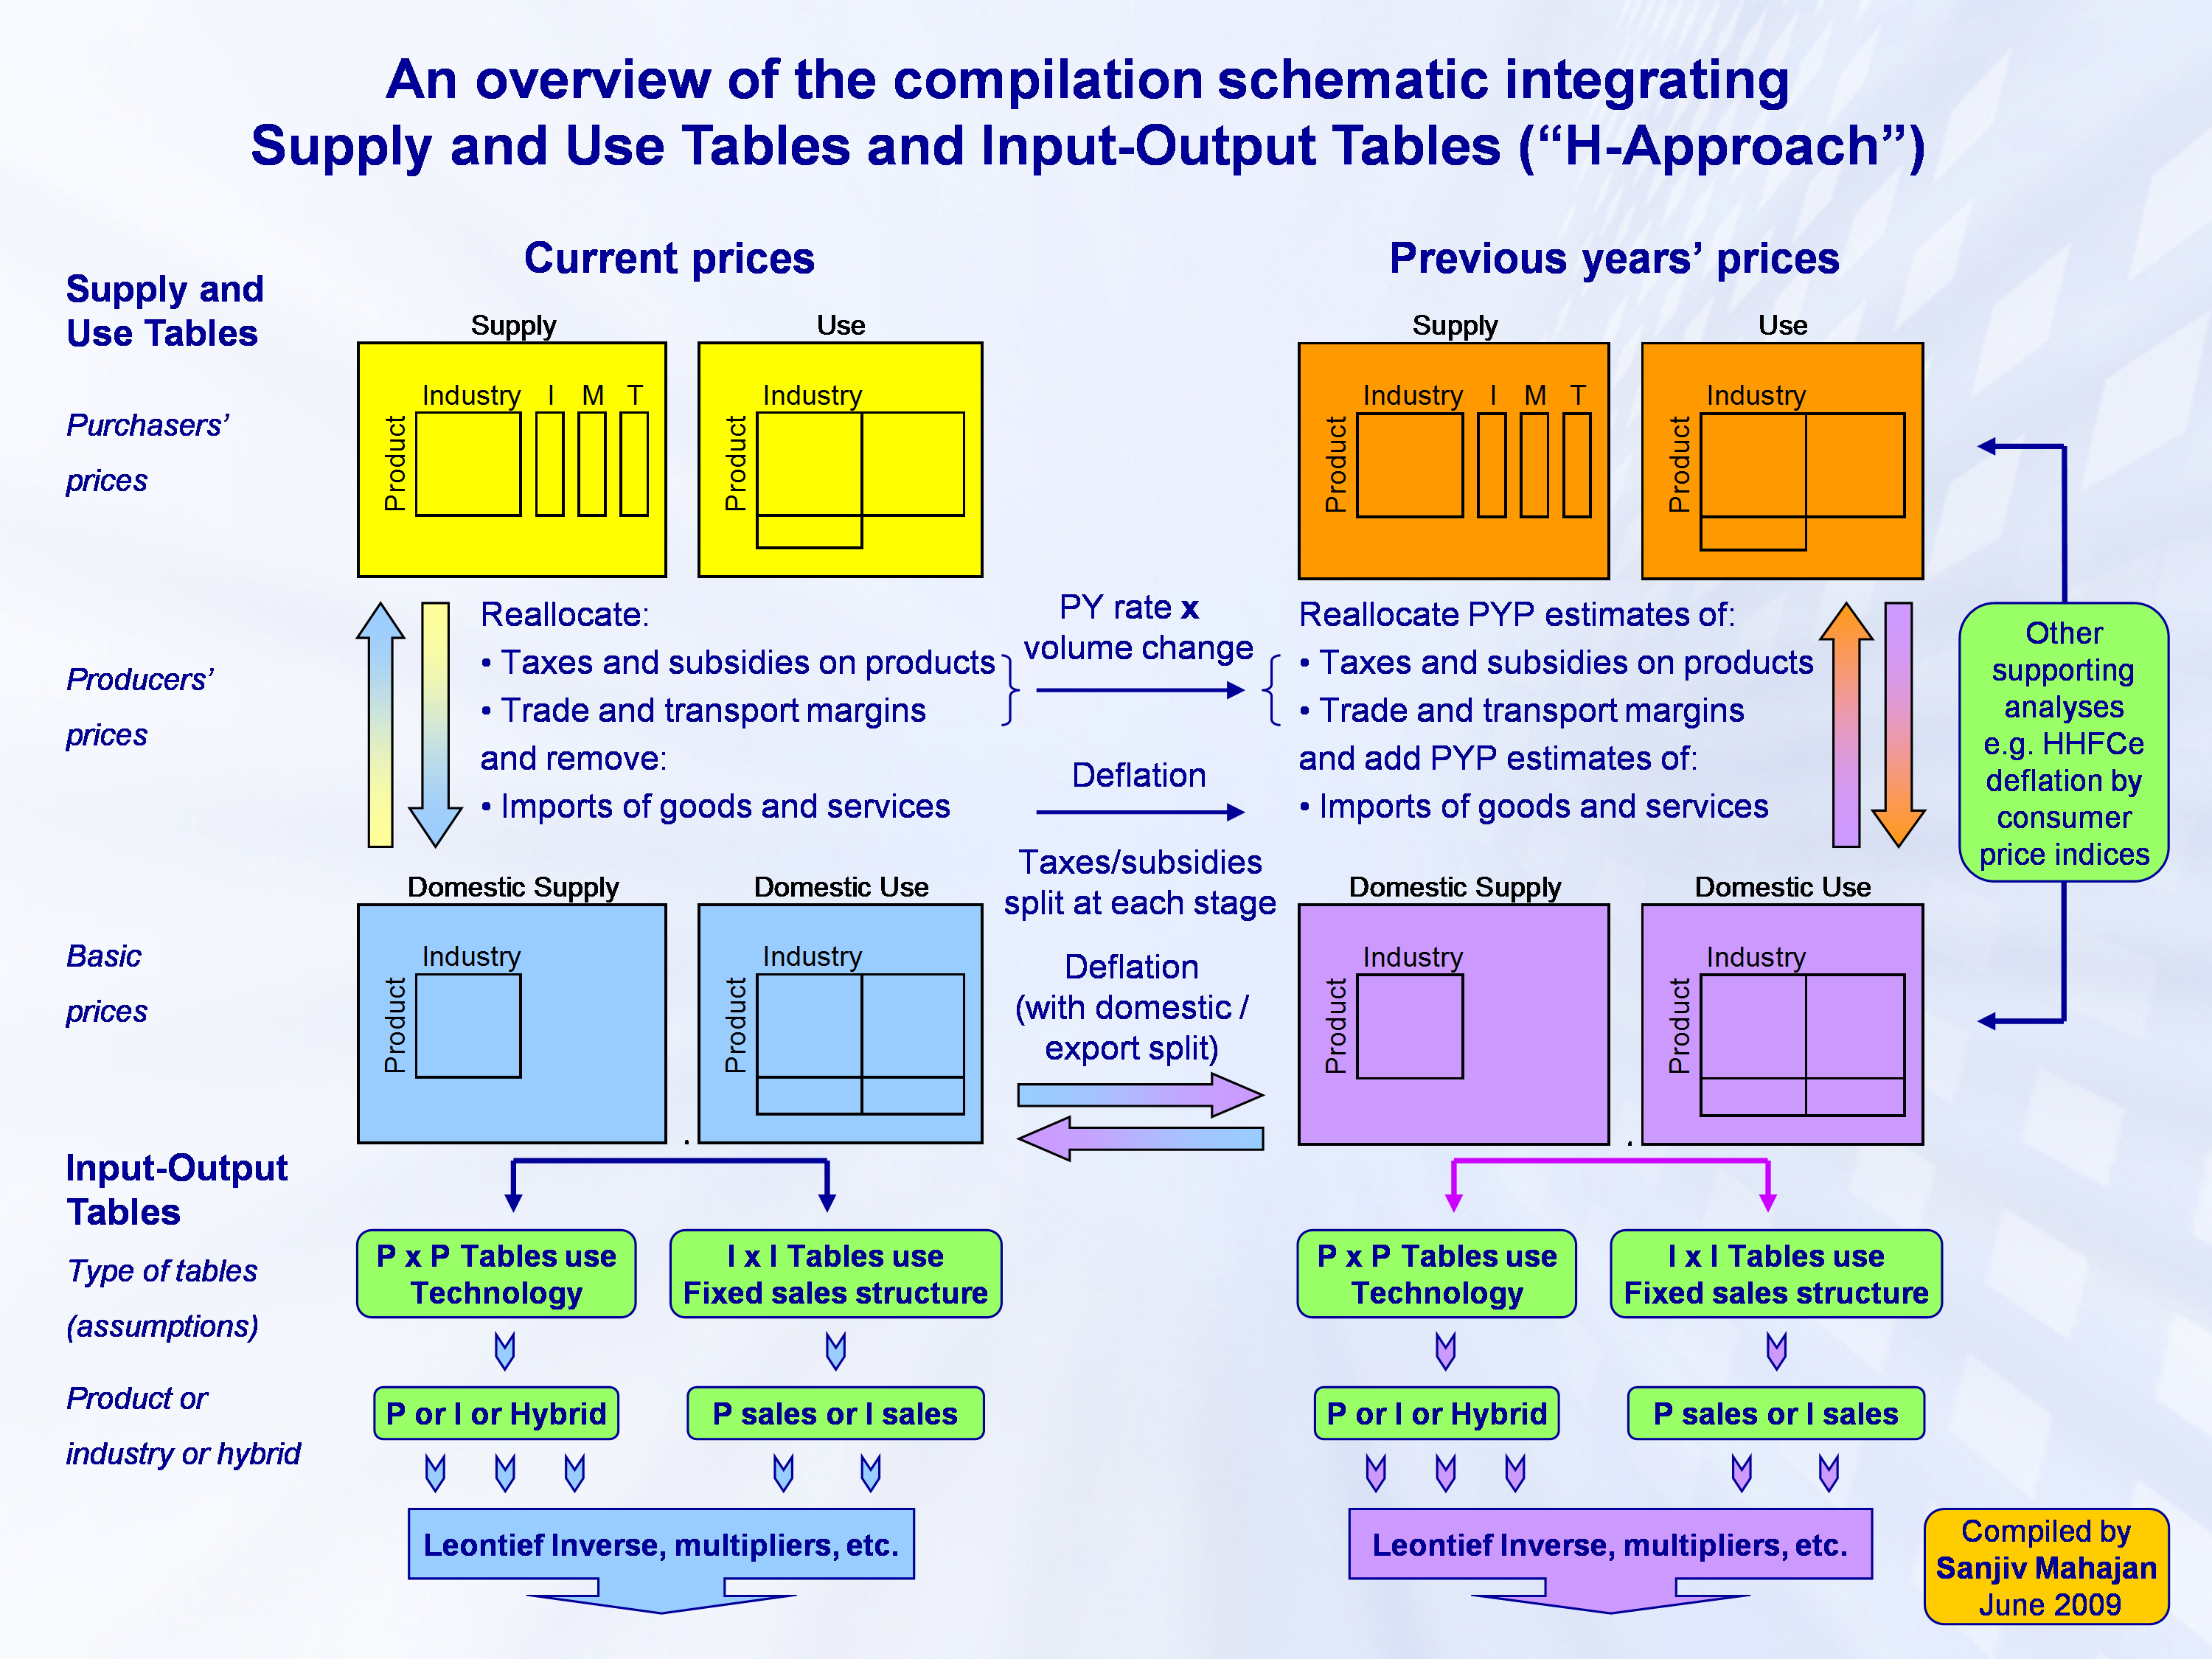
14. Annex B: Single deflation bias
Under double deflation, industry-level volume gross value added (GVA) is estimated as the nominal value of output for that industry deflated by an output price index less the value of that industry’s intermediate inputs deflated by a corresponding input price index – see Equation 1. In contrast, under single deflation, an output price index is applied to deflate both output and intermediate consumption of that industry – see Equation 2.
Double deflation: Equation 1
Single deflation: Equation 2
Single deflation implicitly assumes that prices for intermediate consumption change at the same rate as for output. As such, single and double deflation estimates will produce different estimates of volume gross domestic product (GDP), whenever this assumption is not fulfilled. As input prices will not necessarily move in the same way as output prices for an industry, the production of industry-level volume GVA is subject to bias under single deflation. The size and direction of this bias relates to the relative change of output and input prices respectively – see Equation 3.
Single deflation bias: Equation 3
This shows that the single deflation will lead to a positive bias in industry-level volume GVA when
that is, when output prices are increasing at a faster rate than input prices. Similarly, single deflation will lead to a negative bias in industry-level volume GVA when
that is, when output prices are increasing at a slower rate than input prices.
This is also intuitive in comparing Equation 1 and 2, by looking at the implications of how intermediate consumption in volume terms is estimated when
Intermediate consumption in volume terms is underestimated (overestimated) under single deflation, when
and so volume GVA is overestimated (underestimated) – that is, there is a positive (negative) bias.
This can then be modified further to show where estimates of volume GVA produce by double deflation will differ more than those produced by single deflation.
Equation 4
The relative size of the single deflation bias for an industry is more pronounced:
the greater share of intermediate consumption of GVA
the greater difference between output prices and intermediate consumption prices
The bias is only zero if there is no intermediate consumption or if the output and input deflators grow at the same rate.
Back to table of contents