1. Introduction
This article provides an update to data for the experimental Alternative measures of Real Household Disposable Income and the Saving Ratio: December 2015 that was published on 9 February 2016. In that article we presented an update to the adjusted measure of real households and non-profit institutions serving households (NPISH) disposable income and the saving ratio which estimated disposable income less the parts that are imputed and unobserved by households.
Following user feedback, this article compares experimental cash based measures of the real household disposable income and saving ratio with the National Accounts defined methodology as published in the Quarterly National Accounts.
The data within this article are consistent with the Quarterly National Accounts published on 31 March 2016.
Back to table of contents2. Real Households Disposable Income (RHDI)
There are 2 measures of households and NPISH income, in real terms or in current prices (these are sometimes known as nominal prices, meaning that they include the effects of price changes).
Gross households and NPISH disposable income (GDI) is the estimate of the total amount of income that households and NPISH have available from wages received, revenue of the self-employed, social benefits and net property income (such as net interest on savings and dividends from shares) less taxes on income and wealth. All the components that make up GDI are estimated in current prices.
However, by adjusting GDI to remove the effects of price inflation, we are able to estimate another useful measure of disposable income called real households disposable income (RHDI). This is a measure of the real purchasing power of households and NPISH incomes, in terms of the quantity of goods and services they would be able to purchase. We use the households and NPISH expenditure deflator to remove the effects of price inflation.
We publish a measure of RHDI within the quarterly United Kingdom Economic Accounts (UKEA).
2.1 Making adjustments to RHDI
The measure of RHDI published within the United Kingdom Economic Accounts (UKEA) contains elements which, despite being required for compiling a sequence of national accounts, are not directly observed by households.
For example, imputed rentals represent the value of housing services that owner occupiers derive from their homes. This is the amount that they would have to pay in rent to achieve the same consumption of housing services. Whilst this concept is important when measuring economic output, it is not expenditure directly observed by home owners. As a result the national accounts measure of RHDI can differ from the perceived experience of households.
We therefore consider ‘”cash RHDI”. This measure removes imputed rental and other imputed components resulting in a measure of RHDI which is a closer representation of disposable income as measured by social surveys. This is mainly achieved by following guidance within the Organisation for Economic Co-operation and Development Framework for Statistics on the Distribution of Households Income, Consumption and Wealth and the United Nations Economic Commission for Europe (UNECE) Canberra Group Handbook on Households Income Statistics.
For a full list of those components which have been excluded from the cash measure please see Annex A.
2.2 Alternative measures of RHDI comparisons
Figure 1 shows the percentage change of real households disposable income per head on a national accounts basis and a cash basis, quarter on quarter, Quarter 1 (Jan to Mar) 1998 to quarter 4 (Oct to Dec).
Figure 1: Cash RHDI per head and National Accounts RHDI per head, Quarter 1 (Jan to Mar),1998 to Quarter 4 (Oct to Dec) 2015
UK
Source: Office for National Statistics
Download this chart Figure 1: Cash RHDI per head and National Accounts RHDI per head, Quarter 1 (Jan to Mar),1998 to Quarter 4 (Oct to Dec) 2015
Image .csv .xlsThe level of real households disposable income per head decreased by 0.8% in Quarter 4 (Oct to Dec) 2015, following an increase of 1.4% in Quarter 3 (July to Sept) 2015. On a cash basis, real households disposable income per head decreased by 1.1% in Quarter 4 (Oct to Dec) 2015, following an increase of 1.7% in Quarter 3 (July to Sept) 2015.
For the year 2015, real households disposable income per head increased by 2.5% following a decrease of 0.1% in 2014. This is the highest annual increase in real households disposable income per head since 2001, when it increased by 4.6%. On a cash basis, for the year 2015, real households disposable income per head decreased by 0.2% following a decrease of 0.7% in 2014.
Real households disposable income per head increased by 1.5% between Quarter 4 (Oct to Dec) 2014 and Quarter 4 (Oct to Dec) 2015, following an increase of 4.1% between Quarter 3 (July to Sept) 2014 and Quarter 3 (July to Sept) 2015. On a cash basis, real households disposable income per head increased by 1.7% between Quarter 4 (Oct to Dec) 2014 and Quarter 4 (Oct to Dec) 2015, following an increase of 4.5% between Quarter 3 (July to Sept) 2014 and Quarter 3 (July to Sept) 2015.
Real households disposable income per head increased by 2.8% between Quarter 1 (Jan to Mar) 2008 and Quarter 4 (Oct to Dec) 2015. On a cash basis, real households disposable income per head increased by 2.1% during the same period.
Back to table of contents3. What is the saving ratio?
The saving ratio estimates the amount of money households and NPISH have available to save (known as gross saving) as a percentage of their total disposable income (known as total available resources).
Gross saving is the difference between households and NPISH total available resources (mainly wages received, revenue of the self-employed, social benefits and net property income such as interest on savings and dividends from shares, less taxes on income and wealth) and their current consumption (expenditure on goods and services).
All of the components that make up gross saving and total available resources are estimated in current prices.
3.1 Making adjustments to the saving ratio
Following the cash RHDI approach, the components of the saving ratio were also assessed on whether they would be directly observed by households and then certain components were removed to create a cash saving ratio. For the cash saving ratio on a net interest basis the components removed were the adjustment for the change in pension entitlements , imputed rentals of owner occupiers and charges for financial intermediation services indirectly measured (FISIM) from households and NPISH final consumption expenditure (see Annex A).
3.2 Alternative measures of saving ratio comparisons
Figure 2: Cash saving ratio and National Accounts saving ratio, quarter on quarter, Q1 (Jan to Mar),1997 to Q4 (Oct to Dec) 2015
UK
Source: Office for National Statistics
Download this chart Figure 2: Cash saving ratio and National Accounts saving ratio, quarter on quarter, Q1 (Jan to Mar),1997 to Q4 (Oct to Dec) 2015
Image .csv .xlsThe saving ratio on a national accounts basis and a cash basis follows broadly the same pattern throughout the time series. Between Quarter 1 (Jan to Mar) 1997 and Quarter 1 (Jan to Mar) 2008, the saving ratio was on a broadly downward trend, falling from 13.5% to 4.5% on a national accounts basis, and falling from 5.2% to -6.8% on a cash basis.
There are two prolonged periods during which the saving ratio on a cash basis is negative. The saving ratio on a cash basis was negative between Quarter 1 (Jan to Mar) 2004 and Quarter 1 (Jan to Mar) 2009, and between Quarter 3 (July to Sept) 2013 and Quarter 4 (Oct to Dec) 2015.
During these periods expenditure exceeded income. This can occur either by drawing down existing savings or by borrowing. Prior to 2009 there was an increase in consumer debt and in particular mortgage debt and such increases are likely to have had an impact on falling saving ratios during this period.
Between Quarter 1 (Jan to Mar) 2008 and Quarter 3 (July to Sept) 2010 on a national accounts basis, and between Quarter 1 (Jan to Mar) 2008 and Quarter 2 (Apr to June) 2009 on a cash basis, the saving ratio rose sharply. The saving ratio on a national accounts basis peaked at 11.9% in Quarter 3 (July to Sept) 2009, and peaked at 5.7% on a cash basis in Quarter 2 (Apr to June) 2009. During this time, households experienced greater economic and financial uncertainty which typically results in households decreasing expenditure and increasing their level of saving.
From Quarter 2 (Apr to June) 2013 to Quarter 1 (Jan to Mar) 2014 there was a sharp decrease in the saving ratio on a cash basis compared with the saving ratio on a national accounts basis which reflects differences due to the removal of non-cash transactions.
The saving ratio on a national accounts basis fell to 3.8% in Quarter 4 (Oct to Dec) 2015 from 4.8% in Quarter 3 (July to Sept) 2015. This is the lowest quarterly saving ratio on a national accounts basis on record. On a cash basis, the saving ratio fell to -1.8% in Quarter 4 (Oct to Dec) 2015 from -0.5% in Quarter 3 (July to Sept) 2015.
Back to table of contents4. Annex A
Transactions which feature in the calculation of gross disposable income and saving ratio
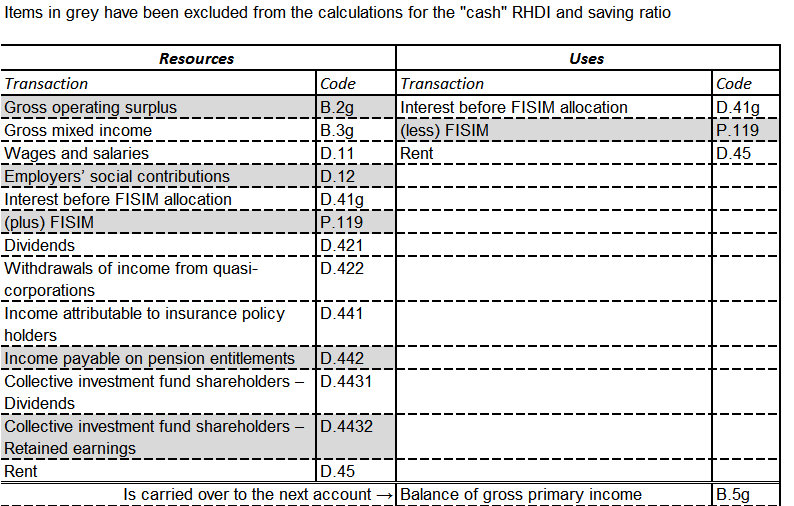
In order to calculate gross disposable income we have to work through the first 2 accounts of the households and NPISH sector, adding up all the resources and subtracting all the uses in each of the accounts.
Items in grey have been excluded from the calculations for the cash RHDI and cash saving ratio.
Allocation of primary income table
Source: Office for National Statistics
Download this image Allocation of primary income table
.png (32.2 kB)
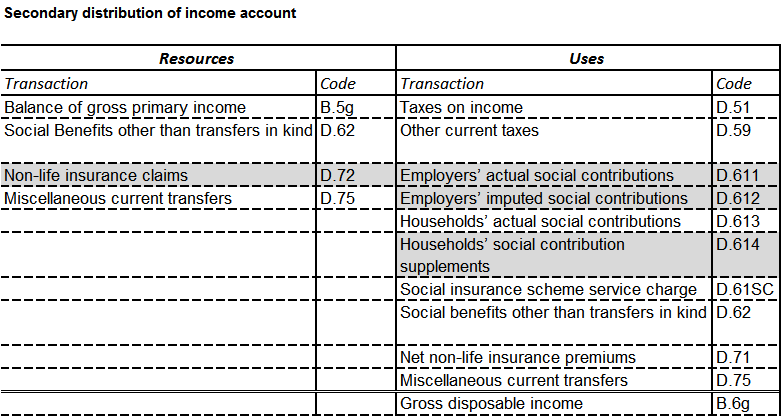
Secondary distribution of income account
Source: Office for National Statistics
Download this image Secondary distribution of income account
.png (26.4 kB)
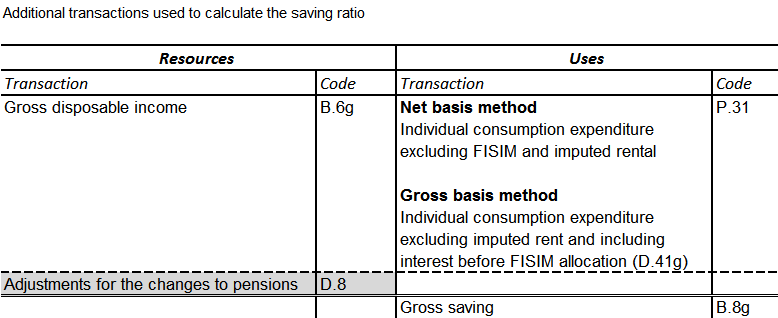
Use of disposable income account
Source: Office for National Statistics
Download this image Use of disposable income account
.png (17.1 kB)
For more information on all of these transactions, please see the European System of Accounts 2010.
Those transactions which are shaded in the tables, are excluded from the calculation of cash RHDI in line with the OECD Framework for Statistics on the Distribution of Households Income, Consumption and Wealth:
Gross operating surplus (B.2g) – This is comprised almost entirely of imputed rental, a national accounts concept which captures the value to owner-occupiers of living in their own home. This is not expenditure that households would see on a bank statement and is therefore excluded.
Employers’ social contributions (D.12) – This refers to the contributions made by employers towards social insurance schemes held by their employees. This is excluded is it not seen by households until they draw their pension, which falls under a separate transaction.
FISIM (resource and use) – FISIM, or financial intermediation services indirectly measured, refers to charges made by financial corporations acting as intermediaries which are implicitly included in the interest rates offered on loans and savings. Within the national accounts FISIM adjustments are made to return these implicit charges back to households, however, as these charges are real, the adjustment is excluded from cash RHDI.
Income payable on pension entitlements (D.442) – This comprises the earnings which arise from the investment of “technical funds” held by pension providers. These earnings are not actually seen by households as they are returned to the pension fund later in the accounts and as such have been excluded from the cash measure of RHDI.
Retained earnings attributable to collective investment fund shareholders (D.4432) – This represents the earnings made by collective investment funds which are not paid out as dividends. These are paid to households, such that the investment fund is left with no saving. These retained earnings are then paid back to the investment fund in the financial account. Again, this is a transfer which households do not really see and as such it has been excluded from cash RHDI.
Non-life insurance claims (D.72) – This refers to the funds received by households when making claims on non-life insurance policies. Whilst within the system of national accounts these are treated as current transfers, within social survey sources these sorts of transfers are not normally captured as income and have therefore been excluded from cash RHDI (See Canberra Group Handbook).
Employers’ actual social contributions (D.611) and Employers’ imputed social contributions (D.612) – Excluded as these transactions are the use counterpart to D.12 which was excluded above.
Households and NPISH social contribution supplements (D.614) – Excluded as this is the use counterpart to D.442 which was excluded above.
Adjustments to transactions which calculate the saving ratio
Adjustments for the change in pensions (D.8) – The saving ratio calculated in this analysis excludes this adjustment as it is not something that is directly observed by households as saving. This adjustment adds back in the amount that households have paid into pension schemes net of any payments they have received from these schemes. This is because the contributions that households make to pension schemes are effectively a form of saving whilst the benefits received from these schemes effectively reduce savings.
Households and NPISH final consumption expenditure (P.3) – To calculate savings, households and NPISH expenditure is deducted from Households and NPISH disposable income. To reflect some of the changes made to the measurement of RHDI above, there are also corresponding changes which need to be made to the measurement of households and NPISH expenditure. Imputed rental of owner occupiers is deducted from expenditure as it is not directly observed by households.
D.41g interest paid before FISIM allocation has been added to households and NPISH final consumption expenditure so that the gross saving ratio accounts for households expenditure on interest payments. As this transaction incorporates expenditure on FISIM on loans by households and NPISH, the element of households final consumption expenditure (P.3) which already captures households expenditure on FISIM has been excluded from the calculation of the saving ratio to avoid double counting.
Back to table of contents