1. Introduction
This article provides an update to data for the Alternative measures of Real Households Disposable Income and the Saving Ratio that was published on 2 November 2015. In this article we presented an update to the adjusted measure of real households and non-profit institutions serving households (NPISH) disposable income and the saving ratio which attempted to quantify disposable income less the parts that are imputed and unobserved by households.
This data within this article is consistent with the Quarterly National Accounts published on 23 December 2015.
Following user feedback, improvements have been made to the cash saving ratio on a gross interest basis.The current methodology reflects interest paid before financial intermediation services indirectly managed (FISIM) allocation (D.41g) as a component of the households and NPISH final consumption expenditure (P.3). Consequently, the cash saving ratio on a gross interest basis includes households and NPISH expenditure on interest payments.
Future publications of the alternative measures of real households disposable income and the saving ratio will present the cash saving ratio on a net interest basis only.
Back to table of contents2. Real Households Disposable Income (RHDI)
There are 2 measures of households and NPISH income, in real terms or in current prices (these are sometimes known as nominal prices, meaning that they include the effects of price changes).
Gross households and NPISH disposable income (GDI) is the estimate of the total amount of income that households and NPISH have available from wages received, revenue of the self-employed, social benefits and net property income (such as net interest on savings and dividends from shares) less taxes on income and wealth. All the components that make up GDI are estimated in current prices.
However, by adjusting GDI to remove the effects of inflation, we are able to estimate another useful measure of disposable income called real disposable income. This is a measure of real purchasing power of households and NPISH incomes, in terms of the quantity of goods and services they would be able to purchase. We use the households and NPISH expenditure deflator to remove the effects of price inflation.
We publish a measure of RHDI within the quarterly United Kingdom Economic Accounts (UKEA).
Back to table of contents3. Making adjustments to RHDI
The measure of RHDI published within the United Kingdom Economic Accounts (UKEA) contains certain elements which, though they are required for compiling a sequence of national accounts, are not directly observed by households.
For example, imputed rentals represent the value of housing services that owner occupiers derive from their homes. This is amount that they would have to pay in rent to achieve the same consumption of housing services. Whilst this concept is important when measuring economic output, it is not directly observed by home owners. As a result the national accounts measure of RHDI can differ from the perceived experience of households.
We therefore consider "cash RHDI". This measure removes imputed rental and other non-cash components resulting in a measure of RHDI which is a closer representation of disposable income as measured by social surveys. This is mainly achieved following guidance within the Organisation for Economic Co-operation and Development (OECD) Framework for Statistics on the Distribution of Households Income, Consumption and Wealth and the United Nations Economic Commission for Europe (UNECE) Canberra Group Handbook on Households Income Statistics.
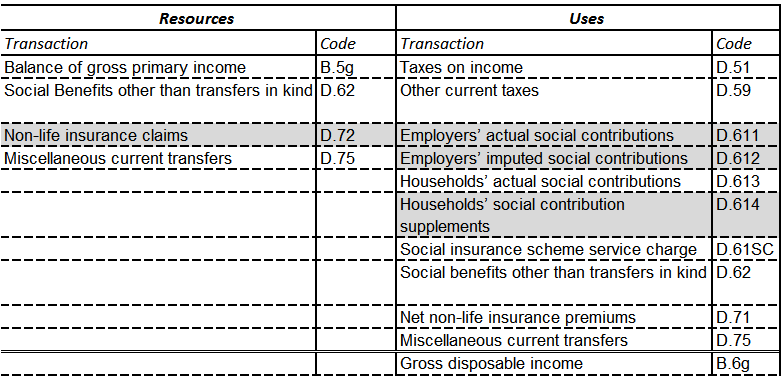
For a full list of those components which have been excluded from the cash measure please see Annex A.
Interest payments
While many of the decisions about which transactions should be included in the calculation of cash RHDI are relatively straightforward, one transaction for which the case is finely balanced is interest paid (D41g-use). This refers to the interest paid by households on loans and other forms of credit.
On the one hand, interest payments are an expense that households directly observe and therefore should be included in the calculation of a "cash" measure of RHDI. However a different view is that decisions about paying interest, for example deciding whether or not to take out a loan, are taken after knowing how much disposable income you have.
Therefore, throughout the following analysis we present cash RHDI on 2 different basis:
net interest basis – this measure includes both interest paid and interest received by households
gross interest basis – this measure includes only interest received by households and not interest paid by households
The former is consistent with the treatment in the national accounts. The only difference between the series and that published in the national accounts, therefore, is the exclusion of the imputed income components. The latter measure differs from these 2 by removing interest payments from the net interest measure to deliver RHDI on a gross interest received basis.
Figure 1: Net, gross interest and published RHDI per capital growth rates
Quarter 1 (Jan to Mar) 2007 to Quarter 3 (July to Sept) 2015, UK
Source: Office for National Statistics
Download this chart Figure 1: Net, gross interest and published RHDI per capital growth rates
Image .csv .xlsFigure 1 shows the growth rates of households and NPISH cash RHDI per capita on a gross and net interest basis alongside RHDI per capita as published in the UKEA, comparing quarters with the same quarter of the previous year.
Comparing the level of RHDI per capita for each of the three measures in Quarter 3 (July to Sept) 2015 with RHDI per capita in Quarter 1 (Jan to Mar) 2008, the national accounts measure estimates RHDI per capita increased by 2.8%. The cash RHDI measure on a net basis estimates RHDI per capita increased by 2.3% during this time, however, cash RHDI per capita on a gross interest basis fell 4.0% during the period.
The main sustained period during which the growth rates of each measure diverge is between Quarter 1 (Jan to Mar) 2009 and Quarter 4 (Oct to Dec) 2010. During this period the growth rate for cash RHDI per capita on a gross interest basis is significantly lower than the other two measures. The gross interest measure shows lower growth than the net interest measure because the gross interest measure excludes interest paid by households and NPISH from its calculation of income. When interest rates fell in 2008 and 2009, this measure recorded the fall in interest received by households but not the corresponding fall in interest paid by households. As the base rate has remained unchanged since March 2009 (0.5%) there has been little opportunity for the gross interest measure to show stronger growth than the other measures.
Comparing Quarter 3 (July to Sept) 2015 with Quarter 3 (July to Sept) 2014, RHDI per capita as measured on a net interest basis is estimated to have increased by 3.6%, whilst RHDI per capita as measured on a gross interest basis is estimated to have increased by 3.1%. RHDI per capita estimated on a national accounts basis increased by 3.2% during the year.
Back to table of contents4. What is the saving ratio?
The saving ratio estimates the amount of money households and NPISH have available to save (known as gross saving) as a percentage of their total disposable income (known as total available resources).
Gross saving is the difference between households and NPISH total available resources (mainly wages received, revenue of the self-employed, social benefits and net property income such as interest on savings and dividends from shares, less taxes on income and wealth) and their current consumption (expenditure on goods and services).
All of the components that make up gross saving and total available resources are estimated in current prices.
Back to table of contents5. Making adjustments to the saving ratio
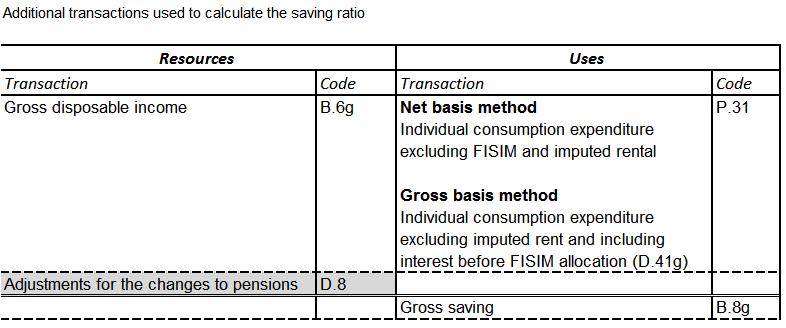
Following the cash RHDI approach, the components of the saving ratio were also assessed on whether they would be directly observed by households and then certain components were removed to create a cash saving ratio. For the cash saving ratio on a net interest basis the components removed were the adjustment for the change in pension entitlements (D.8), imputed rentals of owner occupiers and charges for FISIM from households and NPISH final consumption expenditure (P.3) (see Annex A).
Following user feedback, improvements have been made to the cash saving ratio on a gross interest basis. As with previous editions of this analysis, the components removed were the adjustment for the change in pension entitlements (D.8) and imputed rentals of owner occupiers from households and NPISH final consumption expenditure (P.3). In the current methodology interest paid before FISIM allocation (D.41g) is added to households and NPISH final consumption expenditure (P.3) so that the cash saving ratio on a gross interest basis includes households and NPISH expenditure on interest payments. Given that this transaction incorporates expenditure on FISIM on loans by households and NPISH, the element of households and NPISH final consumption expenditure (P.3) which already captures households and NPISH expenditure on FISIM has been excluded from the calculation of the saving ratio to avoid double counting.
As there is little deviation between the new methodology for the cash saving ratio on a gross interest basis and the cash saving ratio on a net interest basis, future updates of the cash saving ratio will present the net interest measure only.
Figure 2: Comparisons between latest published saving ratio and cash saving ratio on a net and gross interest basis
Quarter 1 (Jan to Mar) 1997 to Quarter 3 (July to Sept) 2015, UK
Source: Office for National Statistics
Download this chart Figure 2: Comparisons between latest published saving ratio and cash saving ratio on a net and gross interest basis
Image .csv .xlsFigure 2 shows the national accounts consistent saving ratio alongside the 2 cash saving ratios; on a net and a gross interest basis. The 3 measures follow broadly the same pattern throughout the time series from Quarter 1 (Jan to Mar) 2007 through to Quarter 3 (July to Sept) 2015.
The estimates on a gross and net interest basis show a negative saving ratio between Quarter 4 (Oct to Dec) 1998 and Quarter 1 (Jan to Mar) 1999, in Quarter 1 (Jan to Mar) 2000, Quarter 3 (July to Sept) 2003, and from Quarter 1 (Jan to Mar) 2004 to Quarter 1 (Jan to Mar) 2009.
During these periods expenditure exceeded income. This can occur by either drawing down existing savings or by borrowing. We know that during this period there was an increase in consumer debt and in particular mortgage debt, so increases in borrowing are likely to have had an impact on falling saving ratios over this period.
From the beginning of Quarter 1 (Jan to Mar) 2008 to Quarter 2 (Apr to June) 2009, all 3 measures of the saving ratio rose sharply. There was greater economic and financial uncertainty which typically results in households cutting back on expenditure and increasing their level of saving.
From Quarter 2 (Apr to June) 2009 onwards, there has been an overall decline in the long term trend of the cash saving ratio estimate on a net and gross interest basis. This trend can also be seen in the published national accounts saving ratio from Quarter 3 (July to Sept) 2010. From Quarter 3 (July to Sept) 2013 to Quarter 1 (Jan to Mar) 2014, there was a sharp decrease in the net and gross interest cash measures compared to the published national accounts saving ratio which reflects differences due to the removal of imputed transactions.
On a net and gross basis, the cash saving ratio has remained negative between Quarter 3 (July to Sept) 2013 to Quarter 3 (July to Sept) 2015.
Back to table of contents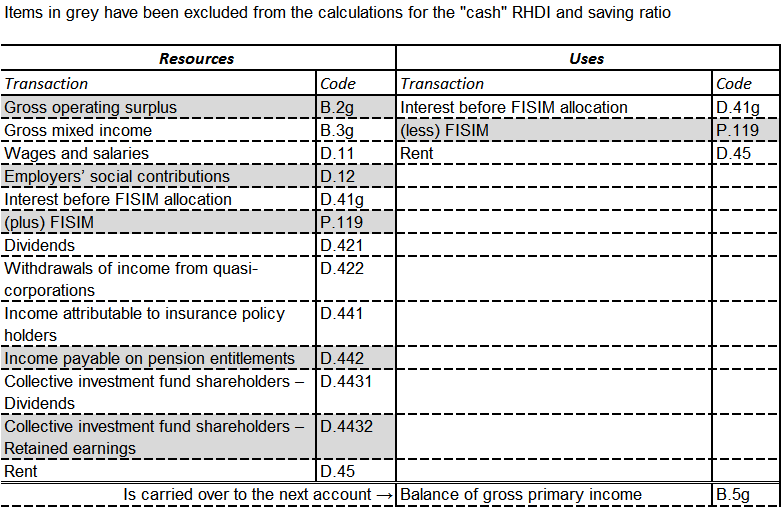
