2. Introduction
This article provides an update to data for the experimental Alternative measures of real households disposable income and the saving ratio: March 2016 that was published on 14 April 2016. These data estimate disposable income less the parts that are imputed and unobserved by households.
This article compares experimental cash-based measures of real households disposable income and the saving ratio with the National Accounts defined methodology as published in the Quarterly National Accounts.
The data within this article are consistent with the Quarterly National Accounts published on 30 June 2016.
Back to table of contents3. Real households disposable income (RHDI)
3.1 What is real households disposable income?
There are 2 measures of households and non-profit institutions serving households (NPISH) disposable income, in real terms or in current prices (these are sometimes known as nominal prices).
Gross households disposable income (GDI) is the estimate of the total amount of income that households and NPISH have available from wages received, revenue of the self-employed, social benefits and net property income (such as net interest on savings and dividends from shares) less taxes on income and wealth. All the components that make up GDI are estimated in current prices.
However, by adjusting GDI to remove the effects of price inflation, we are able to estimate another useful measure of disposable income called real households disposable income (RHDI). This is a measure of the real purchasing power of households and NPISH incomes, in terms of the quantity of goods and services they would be able to purchase. We use the households and NPISH expenditure implied deflator to remove the effects of price inflation.
We publish a measure of RHDI within the Quarterly Sector Accounts bulletin.
3.2 Making adjustments to RHDI
The measure of real households disposable income (RHDI) published within the Quarterly Sector Accounts contains elements which, despite being required for compiling a sequence of national accounts, are not directly observed by households.
For example, imputed rentals represent the value of housing services that owner-occupiers derive from their homes. This is the amount that they would have to pay in rent to achieve the same consumption of housing services. Whilst this concept is important when measuring economic output, it is not expenditure directly observed by homeowners. As a result, the national accounts measure of RHDI can differ from the perceived experience of households.
We therefore consider “cash RHDI”. This measure removes imputed rentals and other imputed transactions resulting in a measure of RHDI that is a closer representation of disposable income as measured by social surveys. This is mainly achieved by following guidance within the Organisation for Economic Co-operation and Development Framework for Statistics on the Distribution of Households Income, Consumption and Wealth and the United Nations Economic Commission for Europe (UNECE) Canberra Group Handbook on Household Income Statistics.
For a full list of those transactions that have been excluded from the cash measure please see Annex A.
3.3 National accounts RHDI compared to the alternative cash measure of RHDI
Real households disposable income (RHDI) on a National Accounts basis increased by 2.0% in Quarter 1 (Jan to Mar) 2016, following a decrease of 0.5% in Quarter 4 (Oct to Dec) 2015. On a cash basis, real households disposable income increased by 2.2% in Quarter 1 (Jan to Mar) 2016, following a decrease of 0.3% in Quarter 4 (Oct to Dec) 2015.
Figure 1: National Accounts RHDI and Cash RHDI, percentage change quarter on quarter
UK, Quarter 1 (Jan to Mar) 1998 to Quarter 1 (Jan to Mar) 2016
Source: Office for National Statistics
Download this chart Figure 1: National Accounts RHDI and Cash RHDI, percentage change quarter on quarter
Image .csv .xlsThere are relatively small differences between the quarterly growths of RHDI on a national accounts basis and a cash basis but the difference between the levels of the 2 series range between £44.1 billion to £60.6 billion each quarter. The difference in levels reflect the removal of imputed transactions. The removal of imputed rentals from RHDI on a national accounts basis has the largest impact as it reduces the households income in the cash RHDI by more than any other imputed transaction compared to the National Accounts method.
Figure 2: Impacts of removing the imputed components from the National Accounts measure of RHDI to derive the cash basis measure
UK, Quarter 2 (Apr to June) 2012 to Quarter 1 (Jan to Mar) 2016
Source: Office for National Statistics
Download this chart Figure 2: Impacts of removing the imputed components from the National Accounts measure of RHDI to derive the cash basis measure
Image .csv .xls4. Households and non-profit institutions serving households (NPISH) saving ratio
4.1 What is the saving ratio?
The saving ratio estimates the amount of money households and NPISH have available to save (known as gross saving) as a percentage of their total disposable income (known as total available resources).
Gross saving is the difference between households and NPISH total available resources (mainly wages received, revenue of the self-employed, social benefits and net property income, such as interest on savings and dividends from shares, less taxes on income and wealth) and their current consumption (expenditure on goods and services).
All of the components that make up gross saving and total available resources are estimated in current prices.
The households and NPISH saving ratio is published in the Quarterly Sector Accounts bulletin.
4.2 Making adjustments to the saving ratio
Using the same approach applied to the cash real households disposable income (RHDI), the components of the saving ratio have also been assessed to determine whether they would be directly observed by households and transactions have been removed accordingly to create a “cash saving ratio”. The adjustment for the change in pension entitlements has been removed from the use of disposable income account; imputed rentals of owner occupiers and charges for financial intermediation services indirectly measured (FISIM) have been removed from households and NPISH final consumption expenditure (see Annex A).
4.3 National Accounts saving ratio compared to the cash basis saving ratio
The saving ratio on a National Accounts basis rose to 5.9% in Quarter 1 (Jan to Mar) 2016 from 5.8% in Quarter 4 (Oct to Dec) 2015. On a cash basis, the saving ratio rose to 2.2% in Quarter 1 (Jan to Mar) 2016 from 0.9% in Quarter 4 (Oct to Dec) 2015. The saving ratio on a national accounts basis has been relatively flat over recent quarters whereas on a cash basis it has been showing some growth, albeit to a lower level.
Figure 3: Cash saving ratio and National Accounts saving ratio, quarter on quarter
UK, Quarter 1 (Jan to Mar) 1997 to Quarter 1 (Jan to Mar) 2016
Source: Office for National Statistics
Download this chart Figure 3: Cash saving ratio and National Accounts saving ratio, quarter on quarter
Image .csv .xlsThe differing trends in recent quarters have largely been driven by the difference in how the 2 series treat social benefits other than transfers in kind received by households and NPISH. This series grew by £11.8 billion between Quarter 1 (Jan to Mar) 2015 and Quarter 1 (Jan to Mar) 2016. On a cash basis this, along with changes to other transactions, caused an increase in total available resources of £16.5 billion, which was partially offset by a £7.8 billion increase in final consumption expenditure (excluding imputed elements) over the same period. The overall effect was to increase gross savings by £8.7 billion.
On a National Accounts basis this increase in social benefits other than transfers in kind does not feed through into total available resources as it is offset by the adjustment for the change in pension entitlements, an adjustment that is omitted from the cash measure.
Therefore, between Quarter 1 (Jan to Mar) 2015 and Quarter 1 (Jan to Mar) 2016, the increase in total available resources was £5.2 billion lower on a national accounts basis than on a cash basis.
On a National Accounts basis, between Quarter 1 (Jan to Mar) 2015 and Quarter 1 (Jan to Mar) 2016, an increase in total available resources of £11.3 billion was largely offset by a £9.3 billion increase in final consumption expenditure. This meant that gross saving increased by £2.0 billion, far less than on a cash basis.
Since, the publication of Alternative measures of real households disposable income and the saving ratio: March 2016, data have been revised to reflect methodological changes introduced in Blue Book 2016.
From Quarter 2 (Apr to Jun) 2013 to Quarter 1 (Jan to Mar) 2016, revisions to the saving ratio on a cash basis have been upward. These revisions are as a result of upward revisions to wages and salaries, dividends and gross mixed income and downward revisions to withdrawals from the income of quasi-corporations and final consumption expenditure. The net effect of these revisions has contributed to a rise in gross saving on a cash basis.
An article was published on 7 June 2016, Detailed assessment of changes to SFA 1997-2014 to explain these changes.
Figure 4: Current and previously published estimates of the saving ratio on a cash basis
UK, Quarter 1 (Jan to Mar) 1997 to Quarter 4 (Oct to Dec) 2015
Source: Office for National Statistics
Download this chart Figure 4: Current and previously published estimates of the saving ratio on a cash basis
Image .csv .xls5. Annex A
Transactions that feature in the calculation of gross disposable income and the saving ratio
To calculate gross disposable income we have to work through the first 2 accounts of the households and NPISH sector, adding up all the resources and subtracting all the uses in each of the accounts.
The transactions in grey in the tables have been excluded from the calculations of cash RHDI and the saving ratio in line with the OECD Framework for Statistics on the Distribution of Household Income, Consumption and Wealth:
Allocation of primary income account
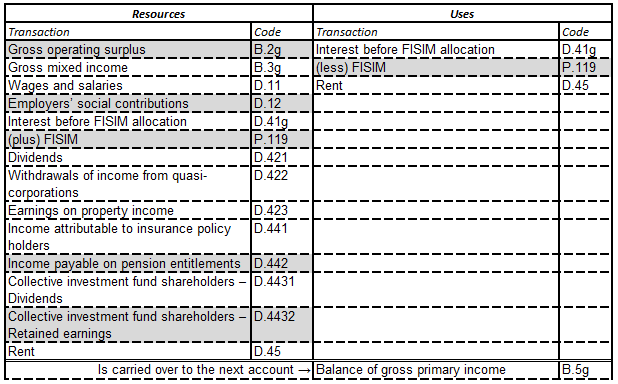
Source: Office for National Statistics
Download this image Allocation of primary income account
.png (28.3 kB)
Secondary distribution of income account

Source: Office for National Statistics
Download this image Secondary distribution of income account
.png (26.2 kB)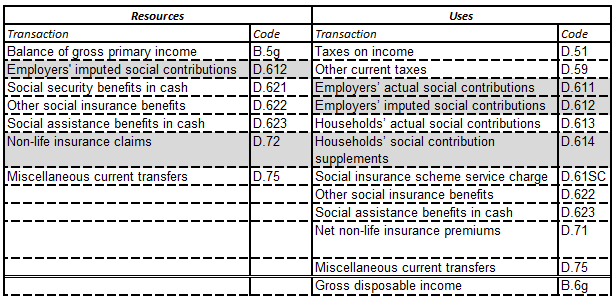
Use of disposable income account
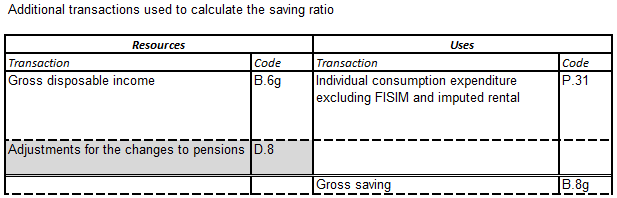
Source: Office for National Statistics
Download this image Use of disposable income account
.png (10.1 kB)
For more information on all of these transactions, please see the European System of Accounts 2010.
Adjustments to transactions that calculate RHDI
Allocation of primary income account
Gross operating surplus (B.2g) – This is comprised almost entirely of imputed rental, a national accounts concept that estimates the value to owner-occupiers of living in their own home. This is not expenditure that households would see on a bank statement and is therefore excluded.
Employers’ social contributions (D.12) - This refers to the contributions made by employers towards social insurance schemes held by their employees. This is excluded as it is not seen by households until they draw their pension, which falls under a separate transaction.
FISIM resource and use (P.119) - FISIM, or financial intermediation services indirectly measured, refers to charges made by financial corporations acting as intermediaries that are implicitly included in the interest rates offered on loans and savings. Within the national accounts FISIM adjustments are made to return these implicit charges back to households, however; as these charges are real, the adjustment is excluded from cash RHDI.
Income payable on pension entitlements (D.442) - This comprises the earnings that arise from the investment of “technical funds” held by pension providers. These earnings are not actually seen by households as they are returned to the pension fund later in the accounts and as such have been excluded from cash RHDI.
Retained earnings attributable to collective investment fund shareholders (D.4432) - This represents the earnings made by collective investment funds that are not paid out as dividends. These are paid to households, such that the investment fund is left with no saving. These retained earnings are then paid back to the investment fund in the financial account. Again, this is a transfer that households do not directly observe and as such it has been excluded from cash RHDI.
Secondary distribution of income account
Non-life insurance claims (D.72) - This refers to the funds received by households when making claims on non-life insurance policies. Whilst within the system of national accounts these are treated as current transfers, within social survey sources these sorts of transfers are not normally captured as income and have therefore been excluded from cash RHDI (See Canberra Group Handbook).
Employers’ actual social contributions (D.611) and Employers’ imputed social contributions (D.612) - Excluded as these transactions are the use counterparts to D.12, which was excluded above.
Households social contribution supplements (D.614) - Excluded as this is the use counterpart to D.442, which was excluded above.
Adjustments to transactions that calculate the saving ratio
Adjustment for the change in pension entitlements (D.8) – This adjustment adds the amount that households have paid into pension schemes net of any payments they have received from these schemes back into the accounts. This is because the contributions that households make to pension schemes are effectively a form of saving whilst the benefits received from these schemes effectively reduce savings. The cash saving ratio excludes this adjustment as it is not something that is directly observed by households.
Households and NPISH individual consumption expenditure (P.31) – To calculate saving, households and NPISH expenditure is deducted from households and NPISH disposable income. To reflect some of the changes made to the measurement of RHDI above, there are also corresponding changes that need to be made to the measurement of households and NPISH expenditure. Imputed rental of owner-occupiers and FISIM are deducted from expenditure as they are not directly observed by households.
Back to table of contents