1. Main points
- The UK unemployment rate fell to 4.3% in the 3 months to July 2017, the lowest since 1975.
- The inactivity rate declined by 0.3 percentage points in the 3 months ending July 2017, to a record low of 21.2%.
- Real average weekly earnings fell by 0.4% in the 3 months to July 2017, both including and excluding bonuses compared with a year earlier.
- The underemployment rate declined by 0.7 percentage points on the previous quarter, to its lowest since the 3 months to September 2008.
2. Main labour market indicators
UK unemployment rate continues to fall
Latest estimates from the Labour Force Survey show that the UK unemployment rate declined by 0.2 percentage points to 4.3% in the 3 months to July 2017 compared with 3 months ago. The total unemployment level decreased by 175,000 compared with a year earlier and by 75,000 compared with 3 months ago.
Figure 1 shows that the level of unemployment has been falling at an increasing rate over the 3 months to July 2017 compared with the previous quarter. The magnitude of decline in the unemployment level was 3.2% in the 3 months to April 2017 compared with the previous quarter, increasing to 4.9% in the 3 months to July 2017 compared with the previous quarter. The unemployment level was down by 50,000 in the 3 months ending April 2017 compared with the previous quarter, whereas the unemployment level was down by 75,000 in the 3 months ending July 2017 compared with the previous quarter.
By age category, there was a fall in unemployment for four age groups: 16 to 17, 18 to 24, 25 to 34 and 35 to 49, whereas unemployment increased for two age groups: 50 to 64 and 65 and over. For the 16-to-17-year-old group this represents the lowest level of unemployment (104,000) since comparable records began. In the 3 months to July 2017 the unemployment rate was 3.7% for the age group 25 to 34 and 2.9% for the age group 35 to 49, both lower than the national average unemployment rate in the same period.
Figure 1: Quarterly changes in unemployment level and unemployment rate
UK, seasonally adjusted, May to July 1995 to May to July 2017
Source: Office for National Statistics, Labour Force Survey
Download this chart Figure 1: Quarterly changes in unemployment level and unemployment rate
Image .csv .xlsBy duration, short-term unemployment (below 6 months) fell by 12.2% in the 3 months ending July 2017 compared with a year earlier. The short-term unemployment level (below 6 months) is at its lowest level at 837,000 since comparable records began. The number of people who were unemployed for over 12 months as well as those who were unemployed for over 24 months decreased by 14.7% and 19.7% respectively in the 3 months to July 2017 compared with a year earlier.
Figure 2 shows that the unemployment level for all over 12 months has been following a downward trend since February to April 2013. The share of unemployed people who were unemployed for over 12 months decreased by 3.7 percentage points to 26.3% in the 3 months to July 2017 compared with the same period in 2015. The number of unemployed people per vacancy declined marginally to 1.9 in the 3 months to July 2017 compared with the previous quarter. The total number of vacancies decreased by 7,000 in the 3 months to August 2017 to 774,000 on the previous quarter, but was up by 24,000 compared with the same period a year ago.
Figure 2: Unemployment level by duration
UK, seasonally adjusted, May to July 1995 to May to July 2017
Source: Office for National Statistics, Labour Force Survey
Download this chart Figure 2: Unemployment level by duration
Image .csv .xlsUK employment level reached a new record high
The number of people in work in the UK increased by 181,000 in the 3 months to July 2017 to a new record high of 32.1 million, following 3 consecutive quarters (including the current quarter) of growth. The employment rate reached a new record high of 75.3% (up 0.5 percentage points) in the quarter. The number of employees and self-employed both increased in the 3 months to July 2017 and are also at record levels (27.1 million and 4.8 million respectively).
In addition, full time employment increased by 96,000 in the quarter to a record high of 23.6 million, and part-time employment increased by 86,000 in the quarter to 8.5 million. The increase in employment coincides with a fall in inactivity. The total inactivity level decreased by 107,000 since the 3 months to April 2017, while the inactivity rate declined by 0.3 percentage points to a record low of 21.2%. These latest figures highlight some strengths in the UK labour market.
Total weekly hours increased by 1.5% in the 3 months to July 2017 (up 15.7 million hours) compared with a year earlier, coinciding with the recent growth in employment. The majority (72.1%) of all people in employment worked 31 hours or more as their usual weekly hours. The average weekly hours for full-time workers remained unchanged at 37.5 hours. The average weekly hours for those on zero hour contracts were 21.4 hours in the 3 months to June 2017, higher than for part-time workers who worked 16.3 hours on average during the same period.
Average weekly earnings increased by 2.1% (excluding bonuses) in the 3 months to July 2017 compared with a year earlier. Once adjusted for CPIH inflation (measured using the Consumer Prices Index including owner occupiers’ housing costs (CPIH)), average weekly earnings fell by 0.4% on the previous year (both including and excluding bonuses).
Back to table of contents3. Different types of employment
This section focuses on different types of employment. Figure 3 shows changes in levels in full-time, part-time and self employment indexed from 2000. Most people in the UK work as full-time employees, however, the numbers have shifted in recent years as growth in part-time and self employment has been much more rapid.
The level of full-time employment increased by 12.3% since the 3 months to July 2000 compared with the same period in 2017. The number of self employed increased by 47.6% and the total number of part-time employees increased by 15.1%. The number of temporary agency workers increased by 14.4% in the 3 months ending June 2017 (the latest available period) compared with the same period in 2000. In the 3 months to June 2017, there were 883,000 people employed on zero hour contracts, four times more than in the 3 months to December 2000. Hence, during the past 17 years there has been a shift towards more non-traditional pattern of work (that is, self employed, agency workers and zero hour contracts).
Figure 3: Different types of employment
UK, seasonally adjusted, May to July 2000 to May to July 2017
Source: Office for National Statistics, Labour Force Survey
Download this chart Figure 3: Different types of employment
Image .csv .xlsNon-traditional pattern of work is more prevalent in certain industries. In the 3 months to June 2017, of all people on a zero hour contract, 23.1% worked in health and social work, and 21.1% worked in the accommodation and food sector. Furthermore, the North East, the South West and the East Midlands had a considerably higher share of people in employment who were on zero hour contracts, at 3.7%, 3.6% and 3.4% respectively, compared with the national average of 2.8%.
Back to table of contents4. Underemployment in the UK labour market
This section considers the extent of underemployment in the UK labour market. It begins by using part-time working figures, showing potential labour supply in the UK economy. Analysis that uses underemployment estimates from the Labour Force Survey (LFS) is presented; the estimates consider additional hours that people in employment (including part-time and full-time employees) want to work, and are another useful indicator of potential capacity in the economy. The economy has extra capacity as people already in employment may prefer to work additional hours.
Underemployment statistics complement employment and unemployment statistics by providing insights into the extent to which labour resources are available and used in the economy. Underemployment figures are more comprehensive than statistics on part-time workers who could not find a full-time job. In the context of this article, the term underemployment is used to describe a scenario where a person wants to work more hours than is usual or stated under their current employment contract.
In the UK, the figures for part-time workers who could not find a full-time job are published as part of the Labour Market monthly statistical bulletin. These estimates, for the latest available quarter (May to July 2017), are shown in Figure 4.
Figure 4 shows that most part-time workers had taken a part-time job for personal reasons, because they did not want a full-time job, they were students, or they had health problems, while others had done so because they could not find a full-time job. The latter group is referred to as involuntary part-time workers. Figure 4 shows that in the 3 months to July 2017, of all part-time workers, 13% were involuntary part-time workers. The number of involuntary part-time workers decreased by 21,000 in the 3 months to July 2017 compared with the previous quarter. In the 3 months to July 2013 there were 1.5 million involuntary unemployed part-time workers, whereas this number was down to 1.0 million in the 3 months to July 2017.
Figure 4: Reasons for part-time working
UK, seasonally adjusted, May to July 2017
Source: Office for National Statistics, Labour Force Survey
Download this chart Figure 4: Reasons for part-time working
Image .csv .xlsThe estimates of underemployment based on part-time workers who could not find a full-time job do not quantify the extent to which full-time or part-time workers are underemployed. To analyse the extent of underemployment, this section considers the labour supply decision of all employees.
To be classified as underemployed a person must satisfy all three of the underemployment criteria (willing to work more hours, available to do so and worked less than the specified hours of work threshold). The Labour Force Survey collects information on the numbers of employed people who: were looking for an additional job in the reference week; were looking for a new job with longer hours to replace their current (main) job in the reference week; and wanted to work longer hours in their current job (at their basic rate of pay). These three categories can be combined to give the total number of people wanting to work more hours.
In addition to responding positively to these three criteria, employed people were classified as underemployed when they were: available to start working longer hours within 2 weeks and their actual weekly hours worked were 40 or less (for people aged under 18) or 48 or less (for people aged 18 or over). It should be noted that underemployment level and rates are generally higher than the number and rates of involuntary part-time workers. This is because a person may be willing and available to work longer hours even if their job is full-time.
According to the Labour Force Survey estimates there were 2.5 million underemployed people in the UK in the 3 months to June 2017 (the latest available period). The underemployment rate1 (underemployed as a proportion of all in employment) was 7.7%. The level of underemployment2 decreased by 205,000 in the 3 months to June 2017 compared with the previous quarter, and the underemployment rate declined by 0.7 percentage points on the previous quarter, to its lowest since the 3 months to September 2008.
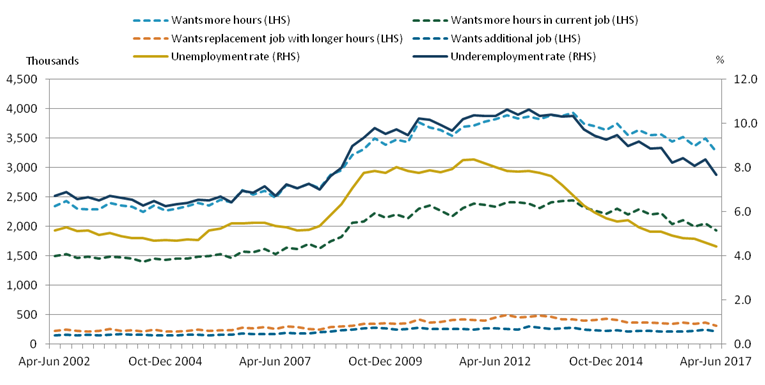
Figure 5 shows that between 2012 and 2014, the underemployment rate fell more slowly than the unemployment rate; however, during the past 15 years a decrease in underemployment generally corresponded to a decrease in unemployment. Figure 5 also shows that the number of people who wanted more hours in the 3 months to June 2017 fell by 4.9% to 3.3 million compared with the same period a year earlier. The number of people who wanted more hours in their current job fell by 5.4% to 1.9 million in the 3 months to June 2017 compared with a year earlier. Furthermore, the number of people who wanted a replacement job with longer hours decreased by 9.6% to 312,000, whereas the number of people who wanted an additional job increased by 1.5% to 217,000 in the 3 months to June 2017 compared with a year earlier.
Figure 5: Underemployment rate and unemployment rate
UK, April to June 2002 to April to June 2017
Source: Office for National Statistics, Labour Force Survey
Download this image Figure 5: Underemployment rate and unemployment rate
.PNG (93.5 kB) .xls (24.6 kB)
These Labour Force Survey estimates measuring underemployment can be explained in the context of an economic outlook. As labour demand strengthens, underemployment and unemployment both tend to decrease.
Notes for: Underemployment in the UK labour market
- Rate is the proportion of total employment, with no adjustment for unknowns.
- The total excludes those workers with unknown underemployment status.