1. Main points
The latest estimate of gross domestic product (GDP) suggests that the economy grew by 0.2% in Quarter 1 (Jan to Mar) 2017 compared with growth of 0.7% in Quarter 4 (Oct to Dec) 2016.
Services output grew by 0.2% in Quarter 1 2017, a slower rate than the average of 0.7% seen over the preceding 16 quarters.
Total production output saw positive growth of 0.1% in Quarter 1 2017 – monthly declines across the quarter were not sufficient to take the average for Quarter 1 2017 below average Quarter 4 2016 levels.
The trade deficit has widened on a monthly and quarterly basis, mainly due to increased imports of oil, chemicals, mechanical machinery and cars.
Increased consumer prices continue to reflect a range of factors, such as upward pressure from seasonally-related air fares and clothing, and an easing of pressure from recent changes in the oil price and sterling exchange rate.
The number of full-time employees as a share of those aged 16 and over in the UK has increased to 38% in the 3 months to March 2017, up from 36% in 2012.
Real average weekly earnings increased by 0.1% including bonuses in the 3 months to March 2017, but fell by 0.2% excluding bonuses, compared with a year earlier.
2. Summary
The slowdown in economic growth was mainly due to some consumer-facing services, such as retail and accommodation, while manufacturing and construction grew slowly. Business services and finances, meanwhile, continued to grow strongly. Net trade continued to provide a negative contribution to gross domestic product (GDP) growth in Quarter 1 (Jan to Mar) 2017 while household spending growth slowed.
Overall the rate of prices growth for consumers continued to increase in April but recent downward moves in dollar and sterling-equivalent oil prices saw oil and fuel prices drop. Average growth in nominal wages, excluding bonuses, in the 3 months to March 2017 did not keep pace with inflation over the same period, resulting in the first decline in real earnings since the 3 months to September 2014.
More detailed theme day economic commentary is available for:
Back to table of contents3. Second estimate of gross domestic product (GDP) Quarter 1 (Jan to Mar) 2017
Today’s UK gross domestic product (GDP) release shows a slight downward revision to UK economic growth in Quarter 1 (Jan to Mar) 2017. The UK economy is now estimated to have grown by 0.2%, following growth of 0.7% in Quarter 4 (Oct to Dec) 2016 (Figure 1). In addition, new data on services output in March 2017 have been published.
Figure 1: GDP growth, quarter-on-quarter and quarter on previous year’s quarter growth rate
Quarter 1 (Jan to Mar) 2008 to Quarter 1 (Jan to Mar) 2017, UK
Source: Office for National Statistics
Download this chart Figure 1: GDP growth, quarter-on-quarter and quarter on previous year’s quarter growth rate
Image .csv .xlsThe second estimate of GDP includes a detailed picture of expenditure in Quarter 1 2017 and shows that private consumption, government consumption and gross fixed capital formation (GFCF) all contributed positively to GDP growth in Quarter 1 2017.
Private consumption (expenditure of households and non-profit institutions serving households) increased by 0.3% in the quarter, the slowest rate of quarterly growth since Quarter 4 (Oct to Dec) 2014. Compared with the same quarter a year ago, private consumption increased by 2.5% (Figure 2). The slowdown in Quarter 1 2017 compared with Quarter 4 2016 reflected a decline in output from consumer focused industries, including the retail industry. As a result, private consumption was a smaller contributor to GDP growth than in recent periods, adding 0.2 percentage points. In contrast, government consumption grew by 0.8% and contributed 0.1 percentage points, the largest quarterly increase since Quarter 2 (Apr to June) 2015. Net trade made a negative contribution to GDP growth in the quarter. However, in recent years, the contribution of net trade to quarter-on-quarter GDP growth has been relatively volatile compared with private and government consumption.
Figure 2 also shows that growth in GFCF (97% of gross capital formation) on a quarter on same quarter a year ago basis was relatively strong in Quarter 1 2017, increasing by 2.2%. Investment by general government grew by 6.3%, contributing 0.2 percentage points to overall GDP, the largest contribution from the components of GFCF. Business investment, the largest component of GFCF, grew by 0.8%, contributing 0.1 percentage points to GDP growth.
Figure 2: Contributions to GDP growth, expenditure component, quarter on same quarter of previous year, chained volume measure
Quarter 1 (Jan to Mar) 2006 to Quarter 1 (Jan to Mar) 2017, UK
Source: Office for National Statistics
Notes:
- Contributions to GDP growth do not sum to the total because the statistical discrepancy is not displayed.
Download this chart Figure 2: Contributions to GDP growth, expenditure component, quarter on same quarter of previous year, chained volume measure
Image .csv .xls4. Services
Total services output rose by 0.2% in Quarter 1 (Jan to Mar) 2017, driven by 0.6% growth in business services and finance, and 0.4% growth in government and other services (Figure 3). Meanwhile, distribution, hotels and restaurants, and transport, storage and communication both recorded negative quarterly growth – falling by 0.6% and 0.2% respectively. This is the first negative quarter-on-quarter growth rate in each series since Quarter 4 (Oct to Dec) 2012 and Quarter 3 (July to Sep) 2013. In addition, 3-month on 3-month total services output growth has continued to slow since the 1.0% growth recorded in October 2016.
Figure 3: Index of Services by selected components and total services
Quarter 1 (Jan to Mar) 2007 to Quarter 1 (Jan to Mar) 2017, UK
Source: Office for National Statistics
Download this chart Figure 3: Index of Services by selected components and total services
Image .csv .xlsOn a monthly basis, total services output grew by 0.2% in March 2017 following a rise of 0.1% in February 2017. The main driver of growth this month was the transport, storage and communication sector, which grew by 1.7%. Within this sector, publishing, audiovisual and broadcasting activities made a large contribution to total services growth (0.2 percentage points), mainly reflecting successful box office takings.
Adding downward pressure on services output this month was the distribution, hotels and restaurants sector, which fell by 0.8%. The largest driver was retail trade, which fell by 1.8% – contributing negative 0.1 percentage points towards monthly total services growth. Similar to February 2017, both business services and finance, and government and other services were virtually flat this month.
Back to table of contents5. Other short-term output indicators
Production
March 2017 saw a 0.5% monthly decrease in total production output, due to falls in energy supply and manufacturing of 4.2% and 0.6% respectively. The largest downward pressure on manufacturing – which accounts for 70% of total production – were basic metals and metal products, which saw a month-on-month fall of 3.0%. The 4.2% fall in the energy supply sector in March 2017 followed a 3.4% fall in February 2017, with continuing warmer-than-average temperatures leading to a decrease in domestic energy demand and, subsequently, gas and electricity production.
On a quarterly basis, total production output saw positive growth of 0.1% in Quarter 1 (Jan to Mar) 2017, despite monthly declines across the quarter. These declines were not sufficient for average production output in Quarter 1 (Jan to Mar) 2017 to fall below the average for Quarter 4 (Oct to Dec) 2016.
Trade
The overall UK trade deficit (goods and services) widened by £2.3 billion in March 2017 compared with February 2017, with exports values growing by 1.3% and imports values growing by 5.6%. In addition, the total trade deficit widened by £5.7 billion to £10.5 billion between Quarter 4 2016 and Quarter 1 2017. Both the monthly and quarterly widening of the trade deficit were mainly due to increased imports of oil, chemicals, mechanical machinery and cars.
The erratics balance totalled only negative £0.4 billion in the most recent quarter, compared with £3.2 billion in Quarter 4 2016. This was due to a fall in exports and a rise in imports of erratic commodities between the quarters. As a result, changes in the erratics balance between Quarter 4 2016 and Quarter 1 2017 impacted the movements in the total trade balance, as well as an increase in imports of the commodities mentioned in this section.
Movements in sterling continue to have an impact on trade prices with goods export and import prices increasing by 1.5% and 1.4% respectively in March 2017 compared with February 2017. This coincided with sterling depreciating by 1.3% in March 2017 against a basket of currencies (Sterling Exchange Rate Index).
Construction
Construction output fell by 0.7% on a monthly basis in March 2017, marking a third consecutive period of negative month-on-month growth – following a 0.1% and 1.3% fall in January 2017 and February 2017 respectively. Infrastructure had the largest contribution towards the month-on-month fall in March 2017, contracting by 5.4%.
Despite the monthly fall, construction output rose by 0.2% in Quarter 1 2017, recording a fifth consecutive month of positive 3-month on 3-month growth. The quarterly growth was mainly due to a 0.4% increase in all new work, partially offset by a 0.2% fall in repair and maintenance. Similar to the production output – with three consecutive month-on-month falls – these were not sufficient for the average Quarter 1 2017 construction output to fall below the average for Quarter 4 2016.
Back to table of contents6. Prices
The rate of growth in prices, measured by the Consumer Prices Index including owner occupiers’ housing costs (CPIH) rose from 2.3% in March 2017 to 2.6% in April 2017. Air fares were the main contributors to the increase in the rate in April 2017, although this balanced out a downward effect of similar magnitude in March 2017 and is due to Easter falling later than last year. Rising prices for clothing, vehicle excise duty and electricity also contributed to the increase in the rate. These upward contributions were partially offset by a fall in motor fuel prices between March 2017 and April 2017, compared with a rise between the same two months a year ago.
Figures 4a and 4b look at the relationship between the global price of Brent crude oil (in sterling and US dollars) and relevant components of the Producer Prices Index (PPI) and the Consumer Prices Index including owner occupiers’ housing costs (CPIH). All data series are indexed to January 2015 equals 100.
Figure 4a: Brent crude oil (in pounds and US dollars) and crude oil (input PPI)
January 2015 to April 2017, UK
Source: Office for National Statistics, Financial Times
Download this chart Figure 4a: Brent crude oil (in pounds and US dollars) and crude oil (input PPI)
Image .csv .xls
Figure 4b: Refined petroleum products (output PPI) and fuels and lubricants (CPIH)
January 2015 to April 2017, UK
Source: Office for National Statistics, Financial Times
Download this chart Figure 4b: Refined petroleum products (output PPI) and fuels and lubricants (CPIH)
Image .csv .xlsFigure 4a shows the relationship between the global price of Brent crude oil (in sterling and US dollars) and the price of the PPI input component crude oil. As most commodities traded on world markets (including crude oil) are priced in US dollars, a fall in the dollar to sterling exchange rate would likely lead to an upward pressure on import prices on a sterling basis. While crude oil in US dollars and sterling closely tracked each other between January and December 2015, the two indicators started to deviate at the beginning of 2016. This gap widened further as a result of the depreciation of sterling during 2016 and has remained through 2016 and the beginning of 2017.
Figure 4b shows the relationship between the refined petroleum products component of producer output prices and the fuels and lubricants component of CPIH. These two components have tracked each other closely over the period since January 2015 and both have slowed since February 2017. This reflects the fall in Brent crude oil prices seen since February 2017, as well as the recent strengthening of sterling, with the slight increase in the dollar price of Brent crude oil in April 2017 not reflected in the sterling price. In April 2017, the 12-month growth rate for the fuels and lubricants component of CPIH was 11.5%, down from 17.1% in March 2017.
Back to table of contents7. Labour market
The unemployment rate dropped to 4.6% in the 3 months to March 2017, down from 5.1% a year earlier, and is now at its lowest since 1975.
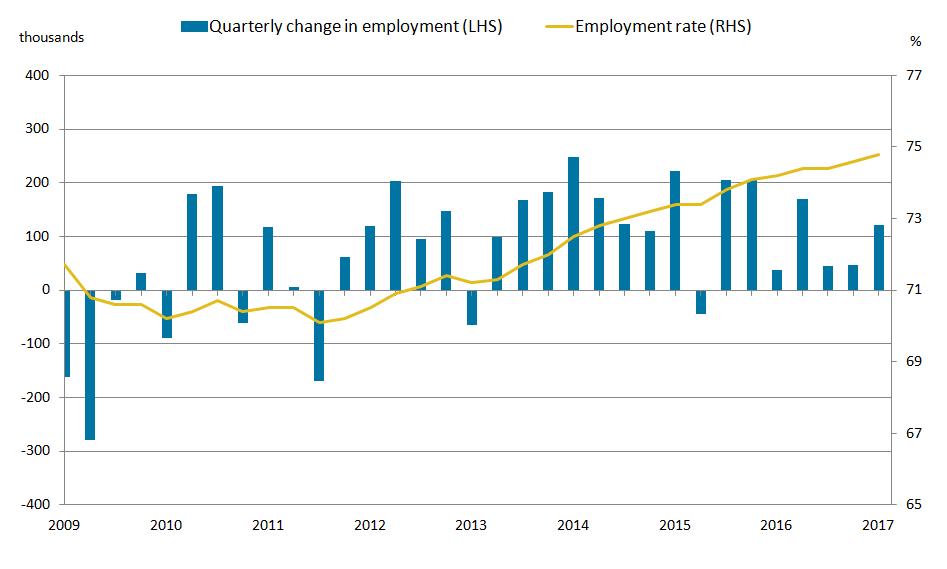
The number of people in work in the UK increased by 122,000 in the 3 months to March 2017 to 31.95 million, with an increase in full-time employment (200,000) partly offset by a fall in part-time employment (78,000). Following 7 consecutive quarters of growth, the employment rate reached a new record high of 74.8% (Figure 5). The employment rate is the ratio of employment to the aged 16 to 64 Labour Force Survey (LFS) population.
Figure 5: Quarterly change in employment (thousands), and employment rate
Jan to Mar 2009 to Jan to Mar 2017, UK
Source: Office for National Statistics
Notes:
Following 7 consecutive quarters of growth, the employment rate reached a new record high of 74.8% in the 3 months to March 2017.
Download this image Figure 5: Quarterly change in employment (thousands), and employment rate
.png (26.6 kB) .xls (30.2 kB)
To examine the composition of employment, Figures 6a and 6b present the ratio of full-time employees, part-time employees and self-employed to the 16 and over LFS population. Following the financial crisis, the number of full-time employees as a share of the age 16 and over LFS population fell to 36.0% (in 2012) but has since increased to 38.0% in the 3 months to March 2017.
In recent quarters, the increase in full-time employment has occurred alongside a fall in part-time employment: the number of part-time employees as a share of the 16 and over LFS population declined from 13.5% in the 3 months to August 2016 to 13.2% in the most recent quarter. Meanwhile, the share of self-employed has been relatively stable in the period since the 3 months to May 2016.
Figure 6a: Share of full-time employees in Labour Force Survey population
January to March 2002 to January to March 2017, UK
Source: Office for National Statistics
Download this chart Figure 6a: Share of full-time employees in Labour Force Survey population
Image .csv .xls
Figure 6b: Share of part-time employees and self employed in Labour Force Survey population
January to March 2002 to January to March 2017, UK
Source: Office for National Statistics
Download this chart Figure 6b: Share of part-time employees and self employed in Labour Force Survey population
Image .csv .xlsAverage hours worked per week increased slightly from 32.1 to 32.2 hours in the 3 months to March 2017, reflecting an increase in the average hours worked by part-time employees, as well as a shift from part time to full-time employment.
The number of vacancies increased by 22,000 to 777,000 in the 3 months to April 2017, a new record high. The number of unemployed people per vacancy declined to 2.0 in the 3 months to March 2017, the lowest on record. The unemployment rate declined to 4.6% in the 3 months ending March 2017, the lowest since 1975. This fall occurred alongside an unchanged participation rate (the proportion of people aged 16 and over who were economically active) and a slight increase in the headline economic activity rate (the proportion of people aged 16 to 64 who were economically active). The economic activity rate is now 78.5%, the equal highest since records began in 1971.
Wage growth
The rate of regular wage growth (excluding bonuses) slowed in the 3 months to March 2017 (Figure 7). Average weekly total pay for employees in Great Britain increased by 2.4% in the 3 months to March 2017 compared with a year earlier, supported by bonuses in the finance and insurance sector. Excluding bonuses, average weekly earnings increased by 2.1% over the same period, the weakest growth since the 3 months to July 2016. Private sector regular pay grew by 2.3% in the 3 months to March 2017, while public sector pay grew by 1.3%, compared with the same period a year ago.
Adjusted for consumer price inflation including owner occupiers’ housing costs (CPIH), average weekly earnings increased by 0.1% including bonuses, but fell by 0.2% excluding bonuses, compared with a year earlier. This is the first decline in real earnings (excluding bonuses) since the 3 months to September 2014.
Figure 7: Regular average weekly earnings growth, real and nominal, seasonally adjusted, 3 month on 3 month a year ago (3 month average periods)
March 2006 to March 2017, Great Britain
Source: Office for National Statistics
Notes:
- p = provisional, r = revised