1. Main points
- The preliminary estimate of gross domestic product (GDP) suggests that the economy grew by 0.3% in Quarter 1 (Jan to Mar) 2017 compared with growth of 0.7% in Quarter 4 (Oct to Dec) 2016.
- The slower GDP growth is mainly due to a slowdown in output from the services sector, from 0.8% in Quarter 4 2016 to 0.3% in Quarter 1 2017.
- Within the 12-month growth rate of 2.3% in the consumer price inflation including owner occupiers’ housing costs (CPIH) in February, there is ongoing growth in food and fuel, and lubricant prices.
- The number of people working full-time increased by 146,000 in the 3 months to February 2017.
2. Changes to publication schedule for economic statistics
The Office for National Statistics introduced its new economic "theme days" in January, which will ensure that related economic statistics are released together.
This article provides a summary of the data released on each theme day alongside a particular focus on the latest gross domestic product (GDP) estimate.
More detailed theme day economic commentary is available for:
Back to table of contents3. Preliminary estimate for gross domestic product Quarter 1 (Jan to Mar) 2017
Today’s gross domestic product (GDP) release contains new information regarding UK economic growth in Quarter 1 (Jan to Mar) 2017. In addition, data on services output in February have been published, as well as an early indication of output growth in production, construction and services in March.
Figure 1: GDP growth, quarter-on-quarter and quarter on previous year's quarter growth rate
UK, Quarter 1 (Jan to Mar) 2008 to Quarter 1 (Jan to Mar) 2017
Source: Office for National Statistics
Download this chart Figure 1: GDP growth, quarter-on-quarter and quarter on previous year's quarter growth rate
Image .csv .xlsThe preliminary estimate of GDP estimates that the UK economy grew by 0.3% in Quarter 1 2017, following growth of 0.7% in Quarter 4 (Oct to Dec) 2016, as shown in Figure 1.
Services output grew by 0.3% in Quarter 1 2017, a slower rate than the average of 0.7% seen over the preceding 16 quarters. The latest data for services in March – which is based on early responses to the Monthly Business Survey – suggest output was flat in March following a 0.1% contraction in January and 0.2% growth in February. Of the growth over the whole quarter, the majority of the growth in services was driven by business services and finance (contributing 0.3 percentage points to total services growth).
The headline GDP figure also reflects growth of 0.3% in production and 0.2% in construction (these two components account for around 21% of total gross value added (GVA) combined). Within production, manufacturing rose by 0.5% while output in the energy supply sector (electricity, gas, steam and air conditioning) fell, partially in response to relatively warm weather in February and March.
Consumer-focused services
Part of the slowdown in services growth this quarter is due to a decline in the output of ‘consumer-focused’ industries, such as retail trade. This is consistent with retail sales data released earlier this month, which showed a 1.4% fall in total retail sales volumes for Quarter 1 2017.
Figure 2 shows an index of output in consumer-focused service industries compared with the total index of services. Up until this quarter, growth in consumer-focused services had been consistently outpacing that of total services since early 2015. In 2016, consumer-focused services contributed 0.8 percentage points of the 2.5% annual output GVA growth (a disproportionately large contribution given their weight of around 12.6% of GDP).
Figure 2: Output in consumer-focused service industries and total Index of Services
Quarter 1 2009 to Quarter 1 2017
Source: Office for National Statistics
Notes:
- ‘Consumer-focused services’ defined here include retail trade (Standard Industrial Classification (SIC) codes 45 and 47), food and beverage SIC code (56), publishing, audiovisual and broadcasting activities SIC (58-60; including motion pictures), and arts, entertainment and recreation SIC (90-93).
Download this chart Figure 2: Output in consumer-focused service industries and total Index of Services
Image .csv .xlsWith the exception of food and beverage (standard industrial classification (SIC) 56), which saw a 2.7% rise between Quarter 4 2016 and Quarter 1 2017, output in the remaining consumer-focused service industries contained in Figure 2 fell in Quarter 1 2017. However, in some cases, this did coincide with a relatively high level of growth in previous quarters (for example, SIC 59: motion pictures).
Figure 3 places the recent growth of the UK’s consumer-focused services in an international context. Although each country in Figure 3 has seen growth in consumer-focused services, which is greater than that of total services, the UK and Italy show a relatively large gap between the two growth rates.
Figure 3: Growth in total services and consumer-focused service industries, by country
Quarter 1 2015 to Quarter 4 2016

Source: Organisation for Economic Co-operation and Development, Office for National Statistics
Notes:
- To be consistent across countries, the measure of 'consumer-focused services' used include the wholesale, retail, repair of motor vehicles (G), transportation and storage (H) and accommodation and food services (I) industries. This includes some components, such as repairs and some forms of transport that, conceptually, should not be interpreted as consumer-focused.
Download this image Figure 3: Growth in total services and consumer-focused service industries, by country
.png (9.6 kB) .xls (32.8 kB)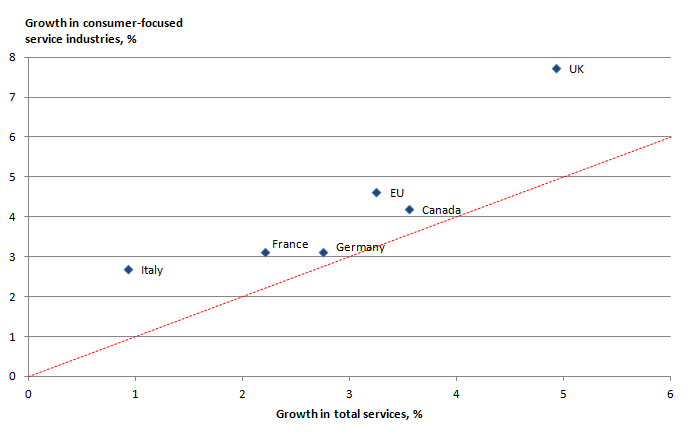
Production
Production output was estimated to have grown by 0.3% in Quarter 1 2017, compared with the previous quarter, down slightly from growth of 0.4% in Quarter 4 2016. Compared with the same quarter a year ago, production output was estimated to have grown by 2.5%, up from 1.9% in Quarter 4 2016. While production output made virtually no contribution to quarter-on-quarter growth of GDP (a 0.04 percentage point contribution), it contributed 0.4 percentage points to quarter-on-year growth.
Manufacturing output grew by 0.5% in Quarter 1 2017, down from growth of 1.2% in Quarter 4 2016. The growth in production output was driven primarily by manufacturing, and previous analysis has shown that this can be partially attributed to the manufacture of motor vehicles (particularly those produced for export). The manufacture of textiles and leather products also grew, up 6.5% compared with the previous quarter, contributing 0.1 percentage points to total production growth; however, output in this industry is relatively volatile.
Warmer than normal temperatures in Quarter 1 2017 led to a decrease in domestic energy demand, and subsequently, gas and electricity production fell by 3.2% compared to Quarter 4 2016. However, gas and electricity production increased by 1.7% compared with Quarter 1 2016. Further analysis into trends in energy consumption and production can be found in the Short-term indicators economic commentary: Apr 2017.
Construction
The preliminary estimate of construction suggests that total output volumes rose by 0.2% in Quarter 1 2017 compared with the previous quarter. For the preliminary estimate, figures for March are largely forecasted so a breakdown of the components of construction is not available (official figures for March will be published on 11 May 2017). The previously published monthly path for construction in Quarter 1 2017 shows flat growth in January, followed by a decline of 1.7% in February. More detailed analysis of the construction industry can be found in the short-term indicators economic commentary.
Back to table of contents4. Services
Following a monthly fall of 0.1% in January 2017, February saw a 0.2% increase in total services output. In the most recent 3 months to February, services output rose by 0.5% compared with the 3 months to November 2016. However, this 3-month on 3-month figure has slowed in each consecutive month since the 1.0% growth recorded in October 2016.
Figure 4 shows that the 0.2% rise in February was driven wholly by an increase in distribution, hotels and restaurants activity (up 1.2%), with the other main components of the services industry remaining largely unchanged – transport, storage and communication fell slightly by 0.1%, while both business services and finance, and government and other services were virtually flat. Within distribution, hotels and restaurants, the main contributors to growth were retail trade, and food and beverage service activities, contributing 0.7 percentage points and 0.4 percentage points respectively.
Figure 4: Index of services by selected components and total services
UK, February 2014 to February 2017
Source: Office for National Statistics
Download this chart Figure 4: Index of services by selected components and total services
Image .csv .xlsThe rise in services output in February is in contrast to other short-term indicators of economic activity released earlier this month, which showed production and construction output both falling in February (by 0.7% and 1.7% respectively). However, output in the production, construction and services industries all recorded positive 3-month on 3-month growth in February.
Back to table of contents5. Consumer prices
Figure 5 shows the consumer price inflation including owner occupiers’ housing costs (CPIH), and the more erratic components of the index – food and non-alcoholic beverages, alcohol and tobacco, and energy. By excluding these more volatile components we can look at the underlying “core” CPIH inflation, also shown in Figure 5.
Over the last 5 years, the 12-month growth in core CPIH has remained relatively flat. Headline CPIH growth fell close to 0% in 2015, as prices of energy and food and non-alcoholic beverages fell. Despite the more volatile components driving the fall in the CPIH 12-month rate, core CPIH also fell in 2015.
Figure 5: 12-month growth in CPIH, core CPIH, and components excluded from core CPIH
UK, March 2012 to March 2017
Source: Office for National Statistics
Notes:
1.The “Energy” category includes the Classification of Individual Consumption According to Purpose (COICOP) group Electricity, gas and other fuels, and the fuels and lubricants class.
Download this chart Figure 5: 12-month growth in CPIH, core CPIH, and components excluded from core CPIH
Image .csv .xlsBoth the headline CPIH and core CPIH 12-month rates have increased gradually since November 2015. For headline CPIH, this has been largely driven by the energy component, primarily from fuels and lubricants. More recently, prices of food and non-alcoholic beverages have also started to rise following nearly 3 years of deflation.
The increase in core CPIH over this period has largely come from recreation and culture, and restaurants and hotels. The increased contribution from recreation and culture has been largely driven by technological products, particularly information processing equipment
Back to table of contents6. House prices
Figure 6 depicts the average mortgage deposit for first-time buyers and former owner-occupiers as a percentage of the dwelling price – the deposit ratio. For both first-time buyers and former owner-occupiers, the deposit ratio increased in the period immediately following the economic downturn. These data show that for first-time buyers, the deposit ratio rose from 19.9% in Quarter 1 (Jan to Mar) 2008 to 33.0% in Quarter 1 2010, compared with 38.5% in Quarter 1 2008 to 42.8% in Quarter 1 2010 for former owner-occupiers. Former owner-occupiers generally have a higher deposit ratio compared with first-time buyers because they can re-invest the value of their existing property.
Figure 6: Average deposit as a percentage of average dwelling price
UK, Quarter 1 (Jan to Mar) 2003 to Quarter 4 (Oct to Dec) 2016
Source: Regulated Mortgage Survey, Matrix Solutions/Council of Mortgage Lenders
Download this chart Figure 6: Average deposit as a percentage of average dwelling price
Image .csv .xlsDeposits for first-time buyers increased from an average of £32,000 at the beginning of 2008 to £61,000 in Quarter 1 2010. The increase in the deposit ratio was also driven by the fall in house prices over the same period.
As discussed in the prices economic commentary, the amount of new residential loans to borrowers fell over this period. The composition of these loans also changed, with a decline in the proportion of loans with high loan-to-value (LTV) ratios.
Since 2010, the deposit ratio for both first-time buyers and former owner-occupiers has been decreasing steadily. By Quarter 4 (Oct to Dec) 2016, the deposit ratio has returned to around the same level seen in mid-2008. In particular, first-time buyers have seen a decrease in the average deposit paid, from £61,000 in Quarter 1 2010 to £50,000 by the end of 2016.
Back to table of contents7. Labour market
Headline labour market indicators show 39,000 more people in work in the 3 months to February 2017, driving the employment rate to 74.6%. As shown in Figure 7, the overall employment rate has been increasing since 2011.
Figure 7: Quarterly changes in employment, and employment rate, seasonally adjusted
UK, December to February 2009 to December to February 2017
Source: Office for National Statistics
Download this chart Figure 7: Quarterly changes in employment, and employment rate, seasonally adjusted
Image .csv .xlsThe number of people working full-time increased by 146,000 in the 3 months to February 2017. In contrast, the number of people working part-time decreased by 107,000. Reflecting this change, the part-time share of employment declined to 26.5%.
Average hours worked per week increased from 32.0 to 32.4 in the 3months to February 2017. There was an increase in the average hours worked by full-time employees and an increase in the average hours worked by part-time employees, as well as a shift from part-time to full-time employment.
Vacancies
The number of vacancies reached 767,000, up 14,000 from the same period a year ago. Similarly, the number of unemployed people per vacancy declined to 2.0 in the 3 months to February 2017. By industry, accommodation and food service activities (up 8,000) was the largest contributor to the increase in vacancies in the quarter, as shown in Figure 8.
Figure 8: Vacancies for selected industries
UK, April to June 2001 to January to March 2017
Source: Office for National Statistics
Download this chart Figure 8: Vacancies for selected industries
Image .csv .xlsThe headline 16 to 64 years economic activity rate was 78.4%, slightly higher than for September to November 2016 (78.3%). In contrast, the aged 16 and over participation rate declined to 63.5%. The recent divergence between the aged 16 and over participation rate and the 16 to 64 economic activity rate reflects a falling number of economically active individuals aged over 65: in the 3 months to February 2017, this number decreased by 3.9%.
Wages
Figure 9 shows rates of seasonally-adjusted nominal and real wage growth since 2007, using 3-month averages compared with the previous year. Average weekly earnings, including bonuses, grew by 2.3% in the 3-month period to February 2017 compared with a year earlier. Wages have been adjusted for inflation using the consumer price inflation including owner occupiers’ housing costs (CPIH). Once adjusted for inflation, in this analysis, average weekly earnings increased by 0.3% including bonuses compared with a year earlier. Estimates of growth in total real pay (including bonuses), in this analysis, differ slightly from the published estimates in Analysis of real earnings: Apr 2017 due to a different method of implementing the seasonal adjustment.
Figure 9: Growth in nominal earnings (total pay), consumer price inflation and real earnings, three-month average year-on-year growth, seasonally adjusted
Great Britain, December 2006 to February 2007 to December 2016 to February 2017
Source: Monthly Wages and Salaries Survey
Notes:
- CPIH is inverted to display its subtraction from real wage growth.
- CPIH is a 3 month average of the current month and two preceding months.
- Estimates of growth in total real pay (including bonuses) differ slightly from published estimates in "Analysis of real earnings: Apr 2017" due to the different method of implementing the seasonal adjustment.