1. Overview
The UK National Accounts include fully balanced estimates of current price and volume gross domestic product (GDP) in a supply and use tables (SUTs) framework. This includes the use of double deflation when producing volume estimates for industry gross value added (GVA).
This article details this framework including the volume reconciliation process and double deflation, which was introduced as part of Blue Book 2021. It also gives a brief history of the implementation of this process.
Historically, we have published annual supply and use tables in current prices each year as part of Blue Book. Now, with the implementation of double deflation, we are publishing a detailed set of annual volume data in the SUT framework for the first time. This includes both the data in chain volume measures (CVMs) and the deflated data in previous year's prices (PYPs). This SUTs-consistent volume data will continue to be published alongside our current price data in future Blue Books.
Back to table of contents2. Double deflation and the supply and use framework
Double deflation
Gross domestic product (GDP) is our main measure of the size of the economy. When we calculate changes in GDP over time, we need to remove the impact of any underlying price changes. Estimates with the effect of price changes removed are often called real or volume GDP.
The production approach to measuring GDP centres on measuring total gross value added (GVA). This is defined as output less intermediate consumption for all the institutions in the UK. Double deflation is widely recognised as the best approach for producing volume estimates of GVA. Under double deflation, for every industry, the current price estimate of its output is deflated by a price index for output, and the current price estimate of its inputs (also known as intermediate consumption) is deflated by an input price index. For more information on deflators, please see our Deflators and how we use them in economic estimates methodology. Equation 1 and 2 show the calculations for GVA and what this means under double deflation. In current price terms, GVA is calculated as:
Equation 1
Prior to the adoption of double deflation, GVA was deflated by output prices. This meant that intermediate consumption (spending on goods and services used in production) was implicitly deflated by the price of the output rather than the price of the input. In this way, double deflation is a clear improvement over the previous approach.
With the appropriate price information for both output and intermediate consumption, we can derive our double-deflated estimates for GVA. Real or volume GVA (that is, after price impacts have been removed) is defined as:
Equation 2
Current price data are deflated at the detailed product level, and this is done for each component and sector. This means that, in industry GVA terms, deflators for output and intermediate consumption are composites of product deflators. Output of products are generally associated with the corresponding industry, so an industry output deflator mainly reflects the deflator for the main product it produces. The intermediate consumption deflator, however, tends to reflect a wider range of inputs. We calculate real GVA for each industry and aggregating up hierarchies allows us to derive total GDP. The process for this is detailed in "Supply and use tables (SUTs) framework" in this section.
Output data are collected in the short-term surveys and are available a lot earlier in the reporting window, allowing us to produce monthly and quarterly estimates of GDP. Our annual data sources, however, provide a richer dataset from surveys and certain administrative sources, and include data on intermediate consumption. These data allow us to adjust for prices (deflation) at a far more detailed level. Through this framework, we are also able to confront industry GVA against other annual sources through the balancing process.
Supply and use tables (SUTs) framework
International best practice is to produce current price and volume estimates of GDP within the SUTs framework, including the process of double deflation.
Figure 1 illustrates the SUTs framework and the identities that need to hold. The Supply and use tables data sources catalogue details the data sources that feed into the process across the different measures.
Figure 1: Supply and use tables framework

Source: Office for National Statistics
Download this image Figure 1: Supply and use tables framework
.png (53.1 kB)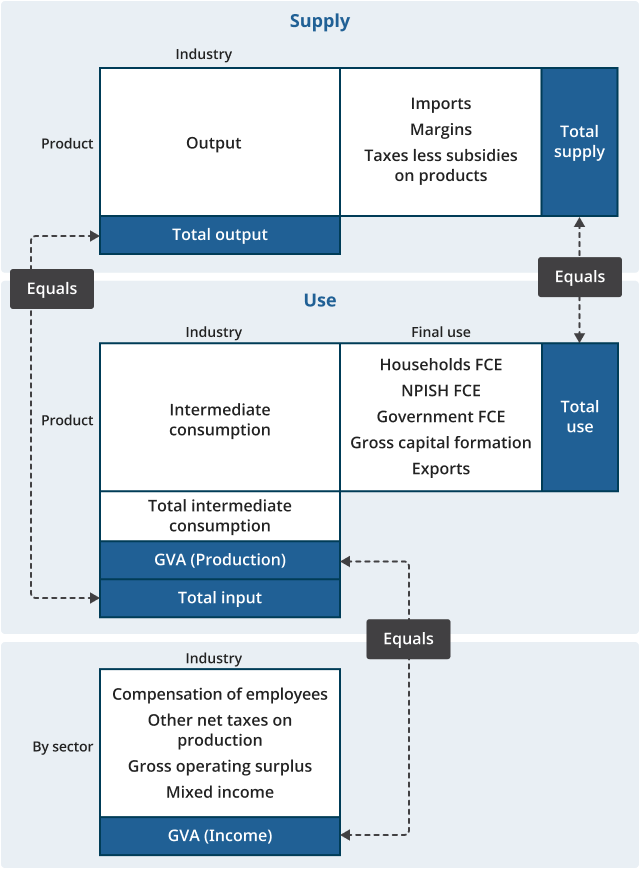
Notes:
- GVA refers to gross value added.
- NPISH refers to non-profit institutions serving households.
- FCE refers to final consumption expenditure.
More information about the SUTs framework is available in Section 6 of A guide to the UK National Accounts: March 2020.
Producing SUTs allows an examination of consistency and coherency of national accounts components within a single detailed framework.
We start with a set of SUTs in current prices. The identities shown in Figure 1 do not automatically hold, because of the use of different data sources and availability of data, and therefore there is a process of reconciling the components within this framework. In the UK, this is an annual process and is done both through data confrontation and validation, which is known as balancing. At the end of the balancing process:
the supply of each product (goods and services) is reconciled with uses of that product
the total output of each industry is reconciled with its inputs
the three approaches to GDP are reconciled, producing a single balanced estimate
Following the production of a full set of balanced SUTs in current prices, we produce volume estimates through deflation and chain-linking. One implication is that SUTs then require balancing again, as the identities such as total supply equalling total use (Figure 1) will no longer hold. However, chain volume measures (CVMs) are not additive over an aggregation of industries or products, and so it is not possible to create CVMs and balance them in the SUTs framework.
Instead, we deflate components by product separately, using the best available deflator. This produces transactions in previous year's prices (PYPs), which are used in the calculation for CVMs. The SUTs identities in Figure 1 should hold regardless of which price basis is used, so we can confront the deflated data to reach a balance in PYP terms. The balanced CVM is then calculated from components that have all been balanced in the supply and use framework.
This balancing process draws heavily on the quality of the deflators used. Broadly speaking, this results in more emphasis given to the expenditure approach for balanced years – that is, the years for which the SUTs have been compiled. This is because it allows the volume estimates to draw more heavily upon the higher-quality Consumer Prices Index (CPI) deflators used within the expenditure approach.
The annual estimates for both current price and CVM included in the UK National Accounts follow the same publication time frame. We produce the first SUTs-based estimate 18 to 24 months after the year end, although some of the data content is still provisional. The previous two years are fully re-balanced to accommodate new and revised data. Earlier years are revised to incorporate changes required under new international standards and guidelines, as well as to make sure the data are comparable and meet user needs. The Office for National Statistics (ONS) revisions policy details further how revisions are incorporated into the UK National Accounts.
For most transactions (for example, household expenditure), estimates for both current price and volume were available prior to Blue Book 2021. Some components, however, were not previously deflated. The following information details the methods adopted as part of Blue Book 2021.
Domestic output
Market output and output for own final use deflators are broadly consistent with those used in the gross domestic product output approach GDP(O), applied at a detailed product level. We use direct volume measures for Classification of Products by Activity (CPA) products such as agriculture (A01), mining and quarrying (B05 and B06), coke and refined petroleum products (C19), electricity (D35.1), land transport services (H49), and air transport services (H51). For non-market output, we use existing direct volume measures from general government final consumption expenditure.
Intermediate consumption
Intermediate consumption is the value of goods and services consumed as inputs by a production process (excluding the use of fixed assets). It consists of the use of domestically produced products and imported products. As such, we use weighted domestic output and import prices for deflation at a detailed product level.
Distributor trading margins
Distributor trading margins (DTMs) play an important role in the transformation from basic to purchasers' prices. At basic prices, the margins made by wholesalers and retailers are captured as separate products. This covers three products:
wholesale and retail trade of motor vehicles (part of CPA G45, which also includes motor vehicle repair)
wholesale trade (CPA G46)
retail trade (CPA G47)
At purchasers' prices, this margin is recorded on the product that was actually traded. The role of DTMs is to reallocate this margin from the margin products at basic prices to the products actually traded at purchasers' prices.
To deflate DTMs, we follow a widely used international approach and assume that volume of margins follows volume of sales. More specifically, the following "rate of the previous year" formula is used:
Equation 3
Where t is the year, CP is the current price estimate, PYP is the previous year’s price estimate, DO is domestic output, and IMP is imports.
The “rate of the previous year” formula is applied, by product, using supply side data, with each of the three margin types processed separately.
Taxes and subsidies
The “rate of the previous year” formula is similarly used to calculate the volume of taxes and subsidies. This can be represented as:
Equation 4
Where DO represents domestic output, IMP represents imports, and DTM represents distributors trading margins (DTM).
Back to table of contents3. History of the implementation of double deflation
Prior to Blue Book 2021, the UK National Accounts only produced annual estimates of current price gross domestic product (GDP) using the supply and use tables (SUTs) framework. In Blue Book 2021, we produced annual volume estimates of GDP in the SUTs framework for the first time. The impacts of this change were detailed in our Indicative impact of a new framework including double deflation on industry volume estimates of GDP: Blue Book 2021 article and our Impact of Blue Book 2021 changes on current price and volume estimates of gross domestic product article.
The application of this new framework for volume estimates of gross value added (GVA) affected the estimates of productivity at the industry level. This was explored in our Impact of double deflation on UK labour productivity: 1997 to 2018 article.
To arrive at this point, a large amount of development work was undertaken to implement this new framework. An earlier outline of the package of work before Blue Book 2019 is available in our National Accounts articles: Transformation of gross domestic product in Blue Book 2019 release. However, certain challenges faced meant that further work was required.
The original planned approach for double deflation to achieve this new framework for volume estimates was the H-approach. However, we determined that implementing double deflation through this approach was not the optimum method in the UK without additional data to compile the underlying valuation matrices required by the H-approach. A progress update describing the change in approach to double deflation is available, and there is also more information about this alternative approach available in Section 4.
Double deflation was first implemented as part of Blue Book 2021 and is now embedded into the production of the UK National Accounts. Further reviews and refinements to deflation used for particular products will be implemented as part of the regular annual Blue Book process.
Back to table of contents5. Cite this methodology
Office for National Statistics (ONS), released 2 December 2022, ONS website, methodology, Double deflation and the supply and use framework in the UK National Accounts