Table of contents
- Main points
- Things you need to know about this release
- The total trade deficit narrowed in the three months to November 2018
- Removing the effect of inflation, the trade deficit widened in the three months to November 2018
- The trade in goods deficit widened with EU countries and narrowed with non-EU countries in the three months to November 2018
- Explore UK trade in goods country-by-commodity data via our interactive tools
- The total trade deficit widened in the 12 months to November 2018
- The UK trade in goods deficit narrowed with the EU and widened with non-EU countries in the 12 months to November 2018
- Links to related statistics
- Quality and methodology
1. Main points
The total trade deficit (goods and services) narrowed £0.2 billion to £7.9 billion in the three months to November 2018 as both goods and services exports each increased £0.1 billion more than their respective imports.
Excluding erratic commodities (mainly aircraft) the total trade deficit widened £1.2 billion to £9.5 billion in the three months to November 2018.
Large increases in export prices of oil and aircraft drove the narrowing of the total trade deficit; removing the effect of inflation, the total trade deficit widened £0.3 billion to £6.5 billion in the three months to November 2018.
The trade in goods deficit widened £0.8 billion with EU countries and narrowed £0.9 billion with non-EU countries in the three months to November 2018, due mainly to increases in imports from EU countries and exports to non-EU countries.
The total trade deficit widened £4.1 billion in the 12 months to November 2018 due mainly to a £4.4 billion narrowing in the trade in services surplus.
2. Things you need to know about this release
Data revision policy
Data within this release have been revised in accordance with the National Accounts Revisions Policy. Services data in this release have been revised back to January 2017, while goods data have been revised back to October 2018, compared with trade figures published in our previous trade bulletin on 10 December 2018. Data in this release are consistent with estimates published in the Quarterly national accounts release also published on 21 December 2018 for Quarter 3 (July to Sept) 2018.
National Statistics designation status
The UK Statistics Authority suspended the National Statistics designation of UK trade (PDF 72.8KB) on 14 November 2014. We have now responded to all of the specific requirements of the reassessment of UK trade and are in the final stages of providing evidence to the Authority. We are undertaking a programme of improvements to UK trade statistics in line with the UK trade development plan, including more detail and improvements now published to address anticipated future demands. On 24 October 2018 we published an article outlining our achievements so far and forward look with regards to the transformation of our trade statistics. We continue to work with the Office for Statistics Regulation team to regain National Statistics status for UK trade statistics. We welcome feedback on our new trade statistics, developments and future plans. If you have any comments, please email trade@ons.gov.uk.
Trade figures
Unless otherwise specified, data within this bulletin are in current prices.
Erratic commodities
Trade statistics for any one month can be erratic. For that reason, we recommend comparing the latest three months against the preceding three months, and the same three months of the previous year.
Oil and other “erratic” commodities can make a large contribution to trade in goods, but often mask the underlying trend in the export or import values due to their volatility. The “erratics” series includes ships, aircraft, precious stones, silver and non-monetary gold. Non-monetary gold can have a particularly large impact on growth rates, due to the large volumes of gold traded on the London markets. Therefore, we also publish data exclusive of these commodities, which may provide a better guide to the emerging trade picture.
Back to table of contents3. The total trade deficit narrowed in the three months to November 2018
Figure 1 shows the changes to goods, services and total trade balances along with exports and imports in the three months to November 2018 compared with the three months to August 2018.
The total trade deficit (goods and services) narrowed £0.2 billion to £7.9 billion in the three months to November 2018, as exports of both goods and services increased more than the increase in imports.
The trade in goods deficit narrowed £0.1 billion to £34.7 billion in the three months to November 2018, as exports increased £1.5 billion, while imports increased by a lesser £1.4 billion.
Trade in services also contributed to the narrowing of the total trade deficit, as the services surplus widened £0.1 billion, due to a £0.6 billion increase in exports more than offsetting a £0.5 billion increase in services imports.
Figure 1: Changes in the UK trade balances, exports and imports, three months to November 2018 compared with three months to August 2018

Source: Office for National Statistics
Notes:
The arrow direction indicates whether a component has increased or decreased, while the colour denotes the impact the direction of a movement has on the trade balance.
For example, an increase in imports is denoted by an upward red (darker) arrow, as a rise in imports has a negative impact on the trade balance, while an increase in exports is denoted by an upward green (lighter) arrow, as a rise in exports has a positive impact on the trade balance.
Download this image Figure 1: Changes in the UK trade balances, exports and imports, three months to November 2018 compared with three months to August 2018
.PNG (45.6 kB)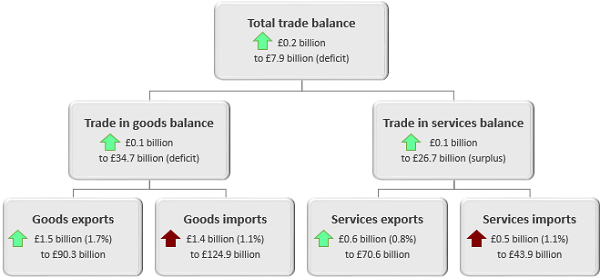
Figure 2 shows the UK trade balance on a three-month on three-month basis between November 2016 and November 2018.
The narrowing of the trade in goods balance in the three months to November 2018 was driven primarily by a £0.8 billion narrowing of the trade deficit in machinery and transport equipment. Exports of machinery and transport equipment increased by £1.0 billion, while imports increased £0.2 billion.
Aircraft was the main driver in the increase in the balance of machinery and transport equipment. The balance of aircraft rose £1.4 billion in the three months to November 2018, due mainly to a £1.2 billion fall in imports. The increase in the balance of aircraft was partially offset by a fall in the balance of cars, which decreased by £0.7 billion.
Aircraft are defined as erratic commodities, in that an increase or decrease in trade of a small number of physical units can result in large fluctuations in current price estimates due to the high value that each unit represents. Excluding erratic commodities, the total trade deficit widened £1.2 billion to £9.5 billion in the three months to November 2018.
Figure 2: UK trade balances, three-month on three-month, November 2016 to November 2018
Source: Office for National Statistics
Download this chart Figure 2: UK trade balances, three-month on three-month, November 2016 to November 2018
Image .csv .xls4. Removing the effect of inflation, the trade deficit widened in the three months to November 2018
This section presents volume and price estimates of the UK trade balances, exports and imports, using chained volume measures (CVMs) and implied deflators (IDEFs). A CVM is a measure that has had the effect of inflation removed. An IDEF shows the implied change in average prices for the respective components of the trade balance.
Figure 3 shows the UK trade balances on a CVM basis, three-month on three-month from November 2016 to November 2018.
In CVM terms, the total UK trade deficit (goods and services) widened £0.3 billion to £6.5 billion in the three months to November 2018; this was due to a £0.8 billion widening in the trade in goods deficit, which was partially offset by a £0.6 billion widening in the services surplus.
Goods exports fell £0.1 billion, while goods imports rose £0.7 billion in the three months to November 2018; services exports increased £1.0 billion, while services imports increased £0.4 billion.
Figure 3: Total trade balances, chained volume measures, three-month on three-month, November 2016 to November 2018
UK
Source: Office for National Statistics
Download this chart Figure 3: Total trade balances, chained volume measures, three-month on three-month, November 2016 to November 2018
Image .csv .xlsFigure 4 shows CVMs and IDEFs for goods exports on a three-month on three-month basis between November 2016 and November 2018.
In volume terms, goods exports fell £0.1 billion compared with a £1.5 billion increase in current prices in the three months to November 2018. The impact of the increase in the goods export IDEF (1.8%) in the three months to November 2018 outweighed the decrease in goods exports CVM.
This divergence between volume and current price estimates for goods exports was due mainly to large increases in export prices of machinery and transport, and fuels. The IDEF for exports of machinery and transport equipment increased 2.0% while the IDEF for fuels exports increased 7.2% in the three months to November 2018.
The increase in the export price of machinery and transport equipment was driven by aircraft. The increase in the fuels export price in the three months to November 2018 was due mainly to increases in oil prices up to October 2018, despite prices falling sharply in November. The fuels export price, which in October 2018 reached the highest level since September 2014, reflects recent trends in oil prices.
Figure 4: Goods exports, chained volume measure and implied deflator, three-month on three-month, November 2016 to November 2018
UK
Source: Office for National Statistics
Download this chart Figure 4: Goods exports, chained volume measure and implied deflator, three-month on three-month, November 2016 to November 2018
Image .csv .xls5. The trade in goods deficit widened with EU countries and narrowed with non-EU countries in the three months to November 2018
Figure 5 shows the changes in goods exports, imports and trade balances with EU and non-EU countries between the three months to August 2018 and the three months to November 2018.
The trade in goods deficit narrowed £0.9 billion with non-EU countries and widened £0.8 billion with EU countries in the three months to November 2018, due mainly to increases in exports to non-EU countries and imports from EU countries.
The £0.9 billion narrowing in the trade in goods deficit with non-EU countries was due mainly to exports, which increased £1.7 billion, while imports increased by a lesser £0.8 billion in the three months to November 2018. The rise in exports was due mainly to increases of £0.7 billion and £0.5 billion for machinery and transport equipment, and fuels respectively.
The £0.8 billion widening in the trade in goods deficit with EU countries was due primarily to imports, which increased £0.6 billion, while exports fell £0.1 billion in the three months to November 2018.
The main contributor to the increase in imports from EU countries was machinery and transport equipment, which increased £0.7 billion. This was due to imports of cars, which increased £0.8 billion in the three months to November 2018. The increase in car imports was offset partially by a £0.2 billion fall in aircraft imports.
Figure 5: Changes in UK goods exports, imports and trade balance with EU and non-EU countries, three months to November 2018 compared with the three months to August 2018
Source: Office for National Statistics
Download this chart Figure 5: Changes in UK goods exports, imports and trade balance with EU and non-EU countries, three months to November 2018 compared with the three months to August 2018
Image .csv .xlsThe trade in fuels balance decreased with EU countries and increased with non-EU countries in the three months to November 2018. The trade in fuels surplus with EU countries narrowed £0.4 billion as exports decreased £0.3 billion and imports increased £0.1 billion, while the trade in fuels deficit with non-EU countries narrowed £0.6 billion as exports increased £0.5 billion and imports fell £0.1 billion in the three months to November 2018.
The trade in aircraft balance had a large impact on the overall balance and the balance with non-EU countries in the three months to November 2018. The £0.9 billion narrowing in the trade in goods deficit with non-EU countries was due primarily to a £1.2 billion increase in the balance of machinery and transport equipment and a £0.6 billion increase in the fuels balance in the three months to November 2018. Exports of fuels rose £0.5 billion while imports fell £0.1 billion.
Of the £1.2 billion increase in the balance of machinery and transport equipment with non-EU countries, £1.1 billion was due to aircraft; imports of aircraft from non-EU countries fell £1.0 billion while exports increased £0.1 billion in the three months to November 2018.
Back to table of contents6. Explore UK trade in goods country-by-commodity data via our interactive tools
What goods do the UK trade with the rest of the world? Our data break down UK trade in goods with 234 countries by 125 commodities.
Use our map to get a better understanding of UK trade in goods with a particular country. Select a country by hovering over it or using the drop-down menu.
Embed code
For more information about our methods and how we compile these statistics, please see Trade in goods, country-by-commodity experimental data: 2011 to 2016. Users should note that the data published alongside this release are no longer experimental.
What about trade in a particular commodity? What percentage of UK car exports goes to the EU? Where does the UK's imported tea and coffee come from?
Use our interactive tools to understand UK trade of a particular commodity.
Select a commodity from the drop-down menu, or click through the levels to explore the data.
Embed code
Embed code
For more information about our methods and how we compile these statistics, please see Trade in goods, country-by-commodity experimental data: 2011 to 2016. Users should note that the data published alongside this release are no longer experimental.
Back to table of contents7. The total trade deficit widened in the 12 months to November 2018
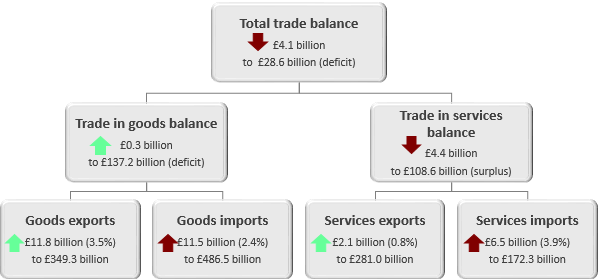
Figure 6 shows the changes to goods, services and total trade balance along with exports and imports in the 12 months to November 2018, compared with the 12 months to November 2017.
The total UK trade deficit (goods and services) widened £4.1 billion to £28.6 billion in the 12 months to November 2018. The widening of the trade deficit was due mainly to a £4.4 billion narrowing in the trade in services surplus; the goods deficit narrowed by a lesser £0.3 billion.
The narrowing of the services surplus was due to a £6.5 billion increase in services imports in the 12 months to November 2018; exports of services increased £2.1 billion. The largest contributors to the increase in services imports were transport, other business services and travel services.
Figure 6: Change to UK trade balances, exports and imports, 12 months to November 2018 compared with 12 months to November 2017
Source: Office for National Statistics
Notes:
The arrow direction indicates whether a component has increased or decreased, while the colour denotes the impact the direction of a movement has on the trade balance.
For example, an increase in imports is denoted by an upward red (darker) arrow, as a rise in imports has a negative impact on the trade balance, while an increase in exports is denoted by an upward green (lighter) arrow, as a rise in exports has a positive impact on the trade balance.
Download this image Figure 6: Change to UK trade balances, exports and imports, 12 months to November 2018 compared with 12 months to November 2017
.png (19.2 kB)
8. The UK trade in goods deficit narrowed with the EU and widened with non-EU countries in the 12 months to November 2018
Figure 7 shows the changes in UK goods exports, imports and trade balances with EU and non-EU countries in the 12 months to November 2018 compared with the 12 months to November 2017.
The UK trade in goods deficit widened £1.3 billion with non-EU countries but narrowed £1.6 billion with EU countries in the 12 months to November 2018.
Exports to EU countries grew £8.0 billion in the 12 months to November 2018 compared with a £6.4 billion increase in imports. Exports rose £3.8 billion to non-EU countries while imports increased £5.1 billion.
Figure 7: Changes in UK goods exports, imports and trade balance with EU and non-EU countries, 12 months to November 2018 compared with 12 months to November 2017
Source: Office for National Statistics
Download this chart Figure 7: Changes in UK goods exports, imports and trade balance with EU and non-EU countries, 12 months to November 2018 compared with 12 months to November 2017
Image .csv .xls10. Quality and methodology
Trade is measured through both exports and imports of goods and/or services. Data are supplied by over 30 sources including several administrative sources, HM Revenue and Customs (HMRC) being the largest.
This monthly release contains tables showing the total value of trade in goods together with chained volume measures (CVMs) and implied deflators (IDEFs). Figures are analysed by broad commodity group (CVMs and IDEFs) and according to geographical area (values only). In addition, the UK trade statistical bulletin also includes early monthly estimates of the value of trade in services.
Further qualitative data and information can be found in the attached datasets. This includes data on:
Detailed methodological notes are published in the UK Balance of Payments, The Pink Book 2018.
The UK trade methodology web pages have been developed to provide detailed information about the methods used to produce UK trade statistics.
The UK trade Quality and Methodology Information report contains important information on:
the strengths and limitations of the data and how it compares with related data
uses and users of the data
how the output was created
the quality of the output including the accuracy of the data