Table of contents
- Main points
- The total trade balance, excluding precious metals, reached a surplus in the three months to February 2020
- The trade in goods deficit, excluding precious metals, narrowed with both EU and non-EU countries in the three months to February 2020
- Removing the effect of inflation, the total trade balance, excluding unspecified goods, reached a surplus in the three months to February 2020
- Explore UK trade in goods country-by-commodity data for 2019 with our interactive tools
- The total trade deficit narrowed in the 12 months to February 2020
- The trade in goods deficit narrowed with both EU and non-EU countries in the 12 months to February 2020
- Revisions
- UK trade data
- Glossary
- Measuring the data
- Strengths and limitations
- Related links
1. Main points
- The total trade balance (goods and services), excluding non-monetary gold and other precious metals, increased by £6.6 billion to a surplus of £1.4 billion in the three months to February 2020; this is the first underlying three-month total trade surplus since comparable records began.
- The trade in goods deficit, excluding non-monetary gold and other precious metals, narrowed by £6.4 billion to £23.2 billion in the three months to February 2020, caused by falling imports of machinery and transport equipment, chemicals, and miscellaneous manufactures.
- Excluding non-monetary gold and other precious metals, EU countries led the narrowing of the trade in goods deficit in the three months to February 2020, narrowing by £6.1 billion to £18.4 billion.
- Removing the effect of inflation, the total trade balance in volume terms, excluding unspecified goods (which includes non-monetary gold), increased by £5.4 billion to a surplus of £1.0 billion in the three months to February 2020.
- Including non-monetary gold and other precious metals, the total trade balance increased by £7.0 billion to a surplus of £5.9 billion in the three months to February 2020.
- The total trade deficit narrowed by £29.9 billion to £11.7 billion in the 12 months to February 2020.
2. The total trade balance, excluding precious metals, reached a surplus in the three months to February 2020
The total trade balance (goods and services), excluding non-monetary gold and other precious metals, increased by £6.6 billion to a surplus of £1.4 billion in the three months to February 2020 (Figure 1). This was because of imports falling by £10.1 billion to £170.7 billion, which was partly offset by exports falling by a lesser £3.5 billion to £172.1 billion.
The £1.4 billion total trade surplus seen in the three months to February 2020 is the first underlying total trade surplus, on a three-month basis, since comparable records began.
The £6.6 billion increase in the total trade balance was largely because of a £6.4 billion narrowing of the trade in goods deficit to £23.2 billion, as imports fell by more than exports.
Goods imports fell by £9.2 billion to £112.4 billion, largely because of machinery and transport equipment, chemicals, and miscellaneous manufactures, which fell by £4.3 billion, £1.9 billion and £1.4 billion respectively.
The fall in imports of machinery and transport equipment was largely because of a £1.8 billion fall in road vehicles. The fall in imports of chemicals was largely because of a £1.0 billion fall in medicinal and pharmaceutical products.
Imports remained relatively low in the three months to February 2020, following large falls in November 2019. Rising imports of machinery and transport equipment and chemicals were seen in Quarter 3 (July to Sept) 2019, followed by falls in the month of November. This trend is consistent with activity being brought forward ahead of the UK’s intended departure date from the EU on 31 October 2019, but we are unable to quantify the effect of this. There was no evidence of activity being brought forward ahead of the departure date on 31 January 2020.
The £9.2 billion fall in goods imports was partly offset by a £2.7 billion fall in goods exports to £89.2 billion in the three months to February 2020. Falling exports were largely seen in machinery and transport equipment, chemicals, and miscellaneous manufactures, which fell by £1.6 billion, £0.6 billion and £0.5 billion respectively.
The trade in services surplus widened by £0.1 billion to £24.6 billion in the three months to February 2020, caused by a £0.9 billion fall in services imports to £58.4 billion. Exports of services fell by a lesser £0.8 billion to £82.9 billion.
Precious metals, which includes non-monetary gold, saw a £2.0 billion rise in exports to £7.8 billion in the three months to February 2020. Imports of precious metals rose by a lesser £1.5 billion to £3.3 billion.
Including precious metals, the total trade balance increased by £7.0 billion to a surplus of £5.9 billion in the three months to February 2020. The trade in goods deficit, including precious metals, narrowed by £6.9 billion to £18.7 billion (Figure 2, Table 1).
This release covers trade for the three months to February 2020, which, for most of the world, was ahead of rigorous lockdown measures for the coronavirus (COVID-19) being put in place. There is currently a low level of evidence suggestive of COVID-19-related impacts on UK trade. The month of February 2020 saw small falls in imports from China, for example, in machinery and transport equipment, miscellaneous manufactures, and material manufactures. However, there is currently no conclusive evidence regarding whether this was because of COVID-19. It should also be noted that monthly data can be erratic and small movements in the monthly series should be taken with caution. For more information regarding the impacts of COVID-19 on the UK’s production industries, please see the Index of Production, UK: February 2020 release.
Figure 1: The total trade balance, excluding precious metals, reached a surplus in the three months to February 2020
UK trade balances, three months on three months, February 2018 to February 2020
Source: Office for National Statistics – UK trade
Download this chart Figure 1: The total trade balance, excluding precious metals, reached a surplus in the three months to February 2020
Image .csv .xls
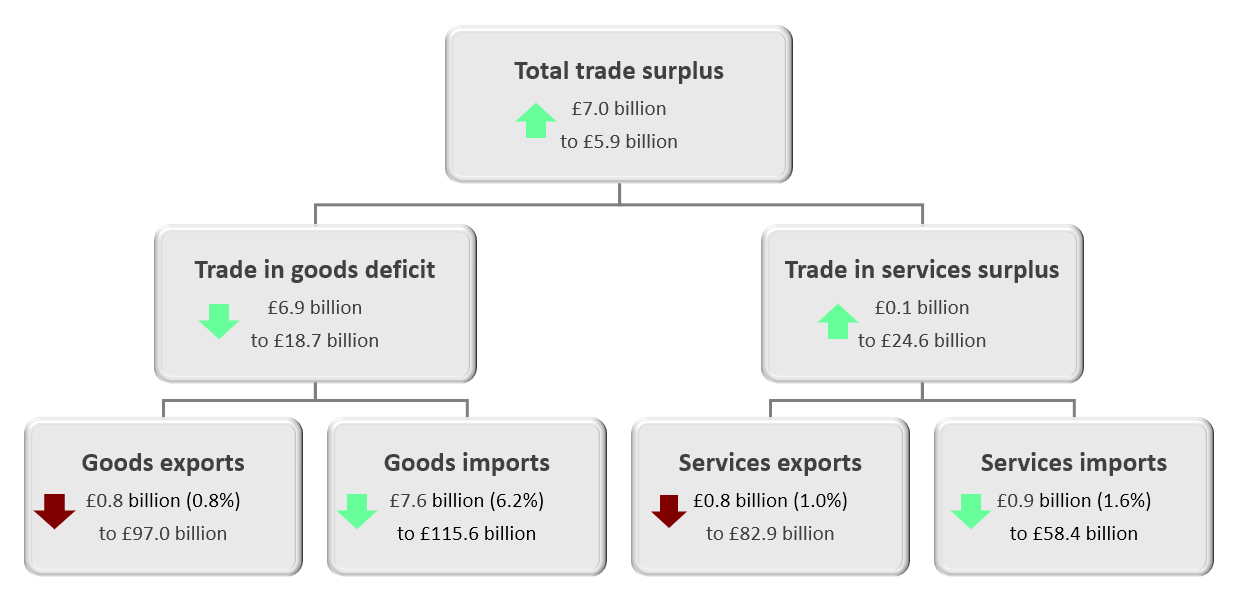
Figure 2: The three months to February 2020 saw a total trade surplus, largely because of a narrowing of the trade in goods deficit
Changes in the UK trade balances, exports and imports, three months to February 2020 compared with three months to November 2019
Source: Office for National Statistics – UK trade
Notes:
- The arrow direction indicates whether a component has increased or decreased, while the colour denotes the impact the direction of a movement has on the trade balance. For example, an increase in imports is denoted by an upward red (dark) arrow, as a rise in imports has a negative impact on the trade balance. An increase in the trade in goods deficit is indicated by an upwards red (dark) arrow, as this would have a negative impact on the balance.
Download this image Figure 2: The three months to February 2020 saw a total trade surplus, largely because of a narrowing of the trade in goods deficit
.png (44.8 kB) .pptx (57.8 kB)
| Three months to February 2020 compared with three months to November 2019 | |||
|---|---|---|---|
| Exports | Imports | Balance | |
| Total trade | Decreased £1.6 billion (0.9%) to £179.9 billion | Decreased £8.6 billion (4.7%) to £174.0 billion | Increased £7.0 billion to £5.9 billion (surplus) |
| Trade in goods | Decreased £0.8 billion (0.8%) to £97.0 billion | Decreased £7.6 billion (6.2%) to £115.6 billion | Narrowed £6.9 billion to £18.7 billion (deficit) |
| Trade in services | Decreased £0.8 billion (1.0%) to £82.9 billion | Decreased £0.9 billion (1.6%) to £58.4 billion | Widened £0.1 billion to £24.6 billion (surplus) |
Download this table Table 1: The total trade balance reached a surplus in the three months to February 2020
.xls .csv3. The trade in goods deficit, excluding precious metals, narrowed with both EU and non-EU countries in the three months to February 2020
The £6.4 billion narrowing of the trade in goods deficit, excluding non-monetary gold and other precious metals, in the three months to February 2020 was largely because of a £6.1 billion narrowing of the deficit with EU countries to £18.4 billion. The trade in goods deficit with non-EU countries, excluding precious metals, narrowed by a lesser £0.3 billion to £4.8 billion (Figure 3).
The narrowing of the deficit with both EU and non-EU countries was caused by imports falling by more than exports.
Goods imports from EU countries fell by £6.9 billion, largely because of machinery and transport equipment, chemicals, and material manufactures, which fell by £3.0 billion, £1.8 billion and £0.8 billion respectively.
The fall in imports of machinery and transport equipment to EU countries was largely because of a £1.7 billion fall in road vehicles. The fall in imports of chemicals was largely because of a £1.0 billion fall in medicinal and pharmaceutical products.
Exports to EU countries fell by a lesser £0.8 billion to £41.2 billion. Falling exports were seen largely in machinery and transport equipment and miscellaneous manufactures, which fell by £0.6 billion and £0.5 billion respectively, partly offset by a £0.8 billion rise in fuels.
Goods imports from non-EU countries fell by £2.3 billion to £52.8 billion, largely because of machinery and transport equipment and miscellaneous manufactures, which fell by £1.3 billion and £0.8 billion respectively.
The £2.3 billion fall in goods imports from non-EU countries was largely offset by a £1.9 fall in goods exports to £48.0 billion. Falling exports were seen in machinery and transport equipment, chemicals, and fuels, which fell by £1.0 billion, £0.6 billion and £0.6 billion respectively.
Including precious metals, the trade in goods deficit with EU countries narrowed by £6.8 billion to £17.6 billion, while the deficit with non-EU countries narrowed by £0.1 billion to £1.1 billion.
Figure 3: The narrowing of the trade in goods deficit was largely because of a narrowing of the deficit with EU countries
Changes in UK goods exports, imports and trade balance with EU and non-EU countries, three months to February 2020 compared with the three months to November 2019
Source: Office for National Statistics – UK trade
Download this chart Figure 3: The narrowing of the trade in goods deficit was largely because of a narrowing of the deficit with EU countries
Image .csv .xls4. Removing the effect of inflation, the total trade balance, excluding unspecified goods, reached a surplus in the three months to February 2020
This section presents volume and price estimates of UK trade exports, imports and balances, using chained volume measures (CVMs) and implied deflators (IDEFs). For more details on these terms, see Section 10 of this release.
In volume terms, the total trade balance (goods and services), excluding unspecified goods (which includes non-monetary gold), increased by £5.4 billion to a surplus of £1.0 billion in the three months to February 2020, largely because of a narrowing of the trade in goods deficit (Figure 4).
The trade in goods deficit, excluding unspecified goods, narrowed by £4.9 billion to £21.9 billion, as imports fell by £6.9 billion to £101.2 billion, while exports fell by a lesser £2.1 billion to £79.3 billion. Falling goods imports were largely seen in machinery and transport equipment, chemicals, and miscellaneous manufactures, which fell by £3.4 billion, £1.3 billion and £1.1 billion respectively.
The trade in services surplus widened by £0.5 billion to £22.9 billion, largely because of a £1.6 billion fall in services imports, partly offset by a £1.1 billion fall in services exports.
Unspecified goods saw a £2.1 billion rise in exports, in volume terms, in the three months to February 2020, while imports rose by a lesser £1.9 billion. The total trade balance in volume terms, including unspecified goods, increased by £5.5 billion to a surplus of £4.7 billion in the three months to February 2020, caused by a £5.1 billion narrowing of the trade in goods deficit to £18.2 billion.
Total trade import prices fell by 0.8% in the three months to February 2020. This was mainly because of a 1.7% fall in goods import prices, partly offset by a 1.0% rise in services import prices.
Figure 4: The trade balance in volume terms, excluding unspecified goods, increased to a surplus in the three months to February 2020
Total trade balances, chained volume measures, three months on three months, February 2018 to February 2020
Source: Office for National Statistics – UK trade
Download this chart Figure 4: The trade balance in volume terms, excluding unspecified goods, increased to a surplus in the three months to February 2020
Image .csv .xls5. Explore UK trade in goods country-by-commodity data for 2019 with our interactive tools
Explore the 2019 trade in goods data using our interactive tools. Our data break down UK trade in goods with 234 countries by 125 commodities.
Use our map to get a better understanding of what goods the UK traded with a particular country. Select a country by hovering over it or using the drop-down menu.
Embed code
Data download
Notes:
For more information about our methods and how we compile these statistics, please see Trade in goods, country-by-commodity experimental data: 2011 to 2016. Users should note that the data published alongside this release are official statistics and no longer experimental.
These data are our best estimate of these bilateral UK trade flows. Users should note that alternative estimates are available, in some cases, through the statistical agencies for bilateral countries or through central databases such as UN Comtrade.
Interactive maps denote country boundaries in accordance with statistical classifications set out within Appendix 4 of the Balance of Payments (BoP) Vademecum (PDF, 1.1MB).
You can also explore the 2019 trade in goods data by commodity, for example, car exports to the EU and UK tea or coffee imports.
Select a commodity from the drop-down menu or click through the levels to explore the data.
Embed code
Embed code
Notes:
For more information about our methods and how we compile these statistics, please see Trade in goods, country-by-commodity experimental data: 2011 to 2016. Users should note that the data published alongside this release are no longer experimental.
These data are our best estimate of these bilateral UK trade flows. Users should note that alternative estimates are available, in some cases, via the statistical agencies for bilateral countries or through central databases such as UN Comtrade.
Interactive maps denote country boundaries in accordance with statistical classifications set out within Appendix 4 of the Balance of Payments (BoP) Vademecum (PDF, 1.1MB).
6. The total trade deficit narrowed in the 12 months to February 2020
The total trade deficit (goods and services) narrowed by £29.9 billion to £11.7 billion in the 12 months to February 2020, mainly because of a narrowing of the trade in goods deficit of £37.4 billion to £114.1 billion. Exports of goods increased by £22.4 billion to £374.3 billion, while imports decreased by £15.1 billion to £488.4 billion (Figure 5, Table 2). Excluding non-monetary gold and other precious metals, the total trade deficit narrowed by £16.3 billion to £15.8 billion.
Total exports increased by £40.3 billion to £702.4 billion, whereas imports increased by £10.3 billion to £714.2 billion, in the 12 months to February 2020.
Rising exports were largely because of precious metals and miscellaneous manufactures, which increased by £14.6 billion and £8.8 billion respectively.
The £15.1 billion decrease of goods imports to £488.4 billion was caused by fuels, chemicals, and machinery and transport, which decreased by £8.0 billion, £4.5 billion and £3.0 billion respectively.
The trade in services surplus narrowed by £7.5 billion to £102.4 billion in the 12 months to February 2020, as imports increased by £25.4 billion to £225.8 billion and exports increased by a lesser £17.9 billon to £328.2 billion.
Figure 5: The trade deficit narrowed in the 12 months to February 2020, largely because of a narrowing of the trade in goods deficit
Changes to the UK trade balances, exports and imports, 12 months to February 2020 compared with 12 months to February 2019

Source: Office for National Statistics – UK trade
Notes:
- The arrow direction indicates whether a component has increased or decreased, while the colour denotes the impact the direction of a movement has on the trade balance. For example, an increase in imports is denoted by an upward red (dark) arrow, as a rise in imports has a negative impact on the trade balance. An increase in the trade in goods deficit is indicated by an upward red (dark) arrow, as this would have a negative impact on the balance.
Download this image Figure 5: The trade deficit narrowed in the 12 months to February 2020, largely because of a narrowing of the trade in goods deficit
.png (45.6 kB) .pptx (57.8 kB)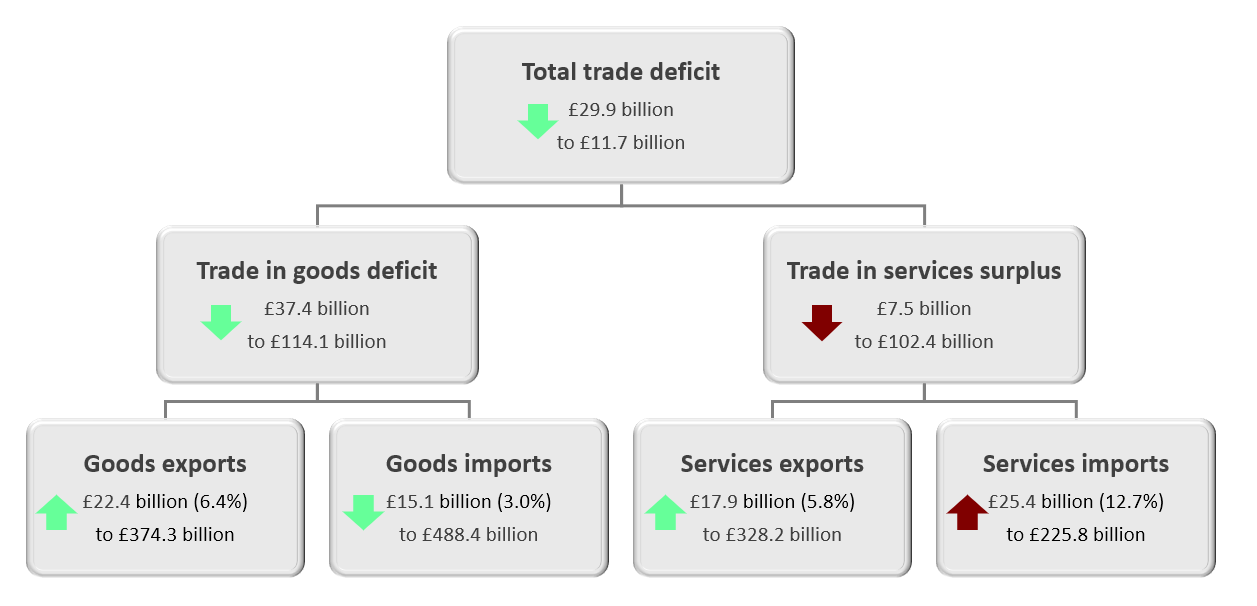
| 12 months to February 2020 compared with 12 months to February 2019 | |||
|---|---|---|---|
| Exports | Imports | Balance | |
| Total trade | Increased £40.3 billion (6.1%) to £702.4 billion | Increased £10.3 billion (1.5%) to £714.2 billion | Narrowed £29.9 billion to £11.7 billion (deficit) |
| Trade in goods | Increased £22.4 billion (6.4%) to £374.3 billion | Decreased £15.1 billion (3.0%) to £488.4 billion | Narrowed £37.4 billion to £114.1 billion (deficit) |
| Trade in services | Increased £17.9 billion (5.8%) to £328.2 billion | Increased £25.4 billion (12.7%) to £225.8 billion | Narrowed £7.5 billion to £102.4 billion (surplus) |
Download this table Table 2: The trade deficit narrowed in the 12 months to February 2020, largely because of a narrowing of the trade in goods deficit
.xls .csv7. The trade in goods deficit narrowed with both EU and non-EU countries in the 12 months to February 2020
The trade in goods deficit with non-EU countries narrowed by £31.1 billion to £24.5 billion in the 12 months to February 2020, while with EU countries it narrowed by £6.4 billion to £89.6 billion (Figure 6).
The narrowing of the trade in goods deficit with non-EU countries was mainly because of a £27.8 billion increase in exports to £205.9 billion, while imports fell by a lesser £3.2 billion to £230.4 billion. Rising exports to non-EU countries were largely caused by non-monetary gold and other precious metals and miscellaneous manufactures, which rose by £13.6 billion and £8.2 billion respectively.
The decrease in non-EU imports was largely caused by fuels and chemicals, which fell by £5.2 billion and £1.4 billion respectively. This was partially offset by a rise in imports of machinery and transport equipment and miscellaneous manufactures of £1.1 billion and £1.0 billion respectively.
The narrowing of the trade in goods deficit with EU countries in the 12 months to February 2020 was because of a £11.8 billion fall in imports to £258.0 billion, whereas exports fell by £5.4 billion to £168.3 billion.
Falling imports from EU countries were largely because of machinery and transport equipment, chemicals, and fuels, which decreased by £4.1 billion, £3.1 billion and £2.8 billion respectively.
The fall in EU exports was caused by chemicals, fuels and material manufactures, which fell by £2.8 billion, £1.9 billion and £1.4 billion respectively.
Figure 6: The narrowing of the trade in goods deficit in the 12 months to February 2020 was largely because of a narrowing of the deficit with non-EU countries
Changes in UK goods exports, imports and trade balances with EU and non-EU countries, 12 months to February 2020 compared with 12 months to February 2019
Source: Office for National Statistics – UK trade
Download this chart Figure 6: The narrowing of the trade in goods deficit in the 12 months to February 2020 was largely because of a narrowing of the deficit with non-EU countries
Image .csv .xls8. Revisions
In accordance with the National Accounts Revisions Policy, goods data in this release have been revised from January 2020 and services data have been revised from January 2019.
The total trade surplus for January 2020 was revised down by £1.8 billion (narrowing of the surplus) to £2.4 billion. The downward revision to the total trade surplus was caused by a £2.2 billion downward revision to total goods exports, largely because of a £2.0 billion downward revision of unspecified goods (which includes non-monetary gold).
Back to table of contents9. UK trade data
UK trade: goods and services publication tables
Dataset | Released 9 April 2020
Monthly data on the UK’s trade in goods and services, including trade inside and outside the EU.
UK trade time series
Dataset MRET | Released 9 April 2020
Monthly value of UK exports and imports of goods and services by current price, chained volume measures (CVMs) and implied deflators (IDEFs).
Other related trade data
Released 9 April 2020
Other UK trade data related to this publication. These include trade in goods for all countries with the UK, monthly export and import country-by-commodity trade in goods data, and revisions triangles for monthly trade data.
10. Glossary
Trade balance
The trade balance is the difference between exports and imports or exports minus imports. When the value of exports is greater than the value of imports, the trade balance is in surplus. When the value of imports is greater than the value of exports, the trade balance is in deficit. The balance is sometimes referred to as “net exports”.
Inflation
Inflation is the change in the average price level of goods and services over a period of time.
Chained volume measures (CVMs)
A CVM is a “real” measure in that it has had the effect of inflation removed to measure the change in volume between consecutive periods, fixing the prices of goods and services in one period (the base year).
Implied deflators (IDEFs)
An IDEF shows the implied change in average prices for the respective components of the trade balance, for example, the IDEF for imports will show the average price movement for imports.
Erratics
Erratics are a specific group of commodities that are extremely influential on trade in goods. They often mask the underlying trend in the export or import values because of their volatility. The “erratics” series includes ships, aircraft, precious stones, silver and non-monetary gold.
Non-monetary gold
Non-monetary gold is the technical term for gold bullion not owned by central banks.
Precious metals
Precious metals includes non-monetary gold, silver, platinum and palladium, and it forms part of the commodity group “unspecified goods”. Non-monetary gold comprises the majority of this group.
A full Glossary of economic terms is available.
Back to table of contents11. Measuring the data
Coronavirus (COVID-19) data impacts
The survey returns, data inputs and trade production processes used to deliver this release are consistent with our previous releases at this stage within the quarterly national accounts processing cycle. However, in light of the challenges with data collection from social distancing measures put in place because of the coronavirus (COVID-19), we anticipate challenges around the level of survey and data returns in future UK trade releases.
The Office for National Statistics (ONS) continues to monitor all data sources and, where needed, will look to supplement current data with alternative sources. Any impacts to data quality within UK trade will be clearly noted within the monthly release.
Current expected impacts of COVID-19
International Passenger Survey (IPS)
The IPS is the main data source for travel services. The IPS was suspended on 16 March 2020 with no current date for re-commencing. To provide an estimate of travel services data during this period, the ONS is currently looking at modelling alternative data sources with the help of the Data Science Campus. Further information on the alternative data sources used will be provided in future releases.
International Trade in Services Survey (ITIS)
Data from the ITIS make up over 50% of trade in services data. The ITIS is a paper-based survey sent to a number of UK businesses. As a result of COVID-19, most businesses have moved to a working from home arrangement or suspended trade. This may result in a lower response to the survey than usual. The ONS is currently investigating the feasibility of moving the ITIS collection from paper to online alongside exploring alternative data sources to supplement the ITIS if response rates are lower than usual. Further information on the alternative data sources used will be provided in future releases.
UK trade data
Unless otherwise specified, data within this bulletin are in current prices (CPs). This means they have not been adjusted to remove the effects of inflation.
UK trade data within our monthly trade bulletin are published at around a six-week lag because of the timeliness of source data. For example, the June 2020 publication will include data up to the end of April 2020.
After EU withdrawal
As the UK leaves the EU, it is important that our statistics continue to be of high quality and are internationally comparable. During the transition period, those UK statistics that align with EU practice and rules will continue to do so in the same way as before 31 January 2020. We will continue to produce statistics broken down to EU and non-EU aggregates.
After the transition period, we will continue to produce our international trade statistics in line with the UK Statistics Authority’s Code of Practice for Statistics and in accordance with internationally agreed statistical guidance and standards. This is based on the International Monetary Fund’s (IMF’s) Balance of Payments and International Investment Position Manual sixth edition (BPM6), until those standards are updated.
Data published in UK trade statistical releases also form part of the broader system of UK National Accounts, which will be produced in line with international standards as laid down in the European System of Accounts (ESA) 2010 until the EU budgets are finalised for the years in which we were a member, as specified in the Withdrawal Agreement.
Data revision policy
Data within this release have been revised in accordance with the National Accounts Revisions Policy. Services data in this release have been revised back to January 2019 while goods data have been revised back to January 2020 compared with trade figures released in our previous UK trade bulletin on 11 March 2020. Data in this release are consistent with the quarterly national accounts for Quarter 4 (Oct to Dec) 2019, released 31 March 2020.
Erratic commodities
Trade statistics for any one month can be erratic. For that reason, we recommend comparing the latest three months with the preceding three months and the same three months of the previous year.
Oil and other “erratic” commodities can make a large contribution to trade in goods, but they often mask the underlying trend in the export or import values because of their volatility. The “erratics” series includes ships, aircraft, precious stones, silver and non-monetary gold.
Precious metals
In line with international standards, the ONS’s headline trade statistics contain the UK’s exports and imports of non-monetary gold.
Because a significant amount of the world’s trade in non-monetary gold takes place on the London markets, this trade can have a large impact on the size of and change in the UK’s headline trade figures. We present time series data for precious metals as well as total trade excluding this commodity, which may provide a better guide to the emerging trade picture. This includes precious metals and trade excluding precious metals by EU and non-EU countries.
Data on non-monetary gold and other precious metals are obtained from the Bank of England (BoE), who provide a balanced figure. This means that we do not receive export and import data separately, just the balance (exports less imports). We attribute the balanced data to either exports or imports, depending on whether the data are positive (that is, exports are greater than imports) or negative (that is, exports are less than imports) respectively. Once received from the BoE, the ONS smooths the precious metals data to ensure individual responses cannot be disclosed.
HM Revenue and Customs (HMRC) data are used in our processing to publish an EU and non-EU allocation of precious metals. Data from HMRC are based on a cross-border movement of goods basis, whereas we publish on a change of economic ownership basis. This may lead to differences in the country-level estimates. These estimates are the best country-level breakdowns at this time, but users are advised to apply caution and take account of the separate methods basis of these outputs.
More information about the ONS’s recording of non-monetary gold is available.
The base year
Because of a very demanding set of changes in the 2019 national accounts annual update, we have not fully reconciled 2017 annual data. Instead, we have produced an indicative balance to allow further time for final quality assurance of the data. Consequently, the reference year and last base year for all chained volume measure (CVM) series remains as 2016.
Methodology
Trade is measured through both exports and imports of goods and services. Data are supplied by over 30 sources including several administrative sources, with HMRC being the largest for trade in goods.
This monthly release contains tables showing the total value of trade in goods together with CVMs and implied deflators (IDEFs). Figures are analysed by broad commodity group (CPs, CVMs and IDEFs) and according to geographic area (CPs only). In addition, the UK trade statistical bulletin also includes early monthly estimates of the value of trade in services.
Further qualitative data and information can be found in the accompanying datasets. This includes data on response rates and revision triangles.
Detailed methodological notes are published in the UK Balance of Payments, The Pink Book: 2019.
The UK trade methodology web pages have been developed to provide detailed information about the methods used to produce UK trade statistics.
More quality and methodology information on strengths, limitations, appropriate uses, and how the data were created is available in the UK trade QMI.
Back to table of contents
12. Strengths and limitations
Bulletin changes
In recent releases, we have brought in some changes to the bulletin, aimed to improve its user-friendliness. This includes the addition of new sections on “Strengths and limitations” and “Measuring the data” as well as a “Glossary”. Please email us at trade@ons.gov.uk if you have any feedback about the new design.
National Statistics designation status
The UK Statistics Authority suspended the National Statistics designation of UK trade on 14 November 2014. We have now responded to all of the specific requirements of the reassessment of UK trade and, as part of our engagement with the Office for Statistics Regulation team, we are sharing our continuous improvement and development plans to support UK trade statistics regaining National Statistics status. We welcome feedback on our new trade statistics, developments and future plans. If you have any comments, please email them to trade@ons.gov.uk.
We are undertaking a programme of improvements to UK trade statistics in line with the UK trade development plan, including more detail and improvements now published to address anticipated future demands. On 24 October 2018, we published an article outlining our achievements so far and forward look with regards to the transformation of our trade statistics.
Trade asymmetries
These data are our best estimates of bilateral UK trade flows, compiled following internationally agreed standards and using a wide range of robust data sources. However, in some cases, alternative estimates of bilateral trade flows are available from the statistical agencies for the relevant countries or through central databases such as UN Comtrade. Differences between estimates are known as trade asymmetries and are a known aspect of international trade statistics, affecting bilateral estimates across the globe, not just in the UK.
We are heavily engaged in analysis of these asymmetries, developing strong bilateral relationships with other countries to understand, explain and potentially reduce them. We have published a series of analyses showing comparisons and the relative strengths of different estimates, which users may wish to reference to help them better understand the quality of our bilateral trade estimates.
Back to table of contents