Table of contents
- Main points
- Statistician comment
- Changes to publication schedule for economic statistics
- The 12-month growth rates for producer and consumer price indices in January 2017 were stronger than in December 2016
- The UK and other developed countries all saw stronger consumer price growth during 2016
- Although food prices are generally lower than 2 years ago, meat and vegetables are getting more expensive
- Increases in producer prices continue to put pressure on manufacturers’ margins and consumer prices
- House price growth slowed towards the end of 2016, particularly in London
1. Main points
Consumer and producer prices
- Factory gate prices continue to rise faster than consumer prices, likely putting pressure on retailer margins.
- Consumer price inflation is increasing in the US and European countries as well as the UK as higher global oil prices and other transport costs feed into headline rates.
- Food prices generally remain below 2014 levels, but some products such as fish, meat and vegetables are seeing price rises in recent months.
House prices
- House price growth slowed in the UK from Quarter 2 (Apr to June) 2016, with the slow-down being particularly marked in London.
2. Statistician comment
Commenting on today’s inflation figures, ONS Head of Inflation Mike Prestwood said:
“The latest rise in CPI was mainly due to rising petrol and diesel prices, along with a significant slowdown in the fall in food prices.
“The costs of raw materials and goods leaving factories both rose significantly, mainly thanks to higher oil prices and the weakened pound.
“Both house prices and rents continue to grow over the year but with some signs of a slowdown in recent months.”
Back to table of contents3. Changes to publication schedule for economic statistics
We introduced our new economic "theme days" in January which will ensure that related economic statistics are released together. This month, construction output price indices (OPIs) are released as part of the Prices theme day alongside those for producer prices, consumer prices and housing prices. The separate bulletins contain details of the new data published and important information on how to interpret the statistics.
UK producer price inflation: Jan 2017
UK consumer price inflation: Jan 2017
Index of private housing rental prices (IPHRP) in Great Britain, results: Jan 2017
UK house price index: Dec 2016
Construction output price indices (OPIs): Quarter 4 (Oct to Dec) 2016
This article provides an economic overview of the latest data and current trends. Updated analysis of the contributions to the 12-month growth rate for input and output producer prices, and the contributions to the 12-month Consumer Prices Index (CPI) growth rate by import intensity of products is available in the data tables associated with this release.
Back to table of contents4. The 12-month growth rates for producer and consumer price indices in January 2017 were stronger than in December 2016
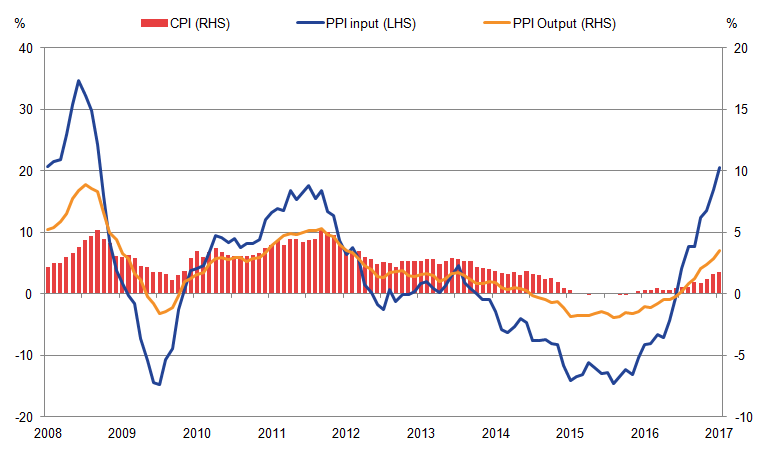
Figure 1 shows that Producer Price index (PPI) input (left-hand scale) and PPI output indices (right-hand scale) move in broadly similar ways over time, although the movement in manufacturers’ input prices is considerably greater than for manufacturers’ output prices. The 12-month input PPI has increased by 20.5% in January 2017 which largely reflects rising import costs for UK manufacturers and some impact from falling prices a year ago.
The 12-month output price index of manufactured products rose by 3.5% in January 2017 and is now 1.7 percentage points higher than the Consumer Prices Index (CPI) 12-month rate which was 1.8% in January 2017. The last time PPI output prices were more than 1.7 percentage points higher than the 12-month CPI rate was in October 2008. For most of the period since the economic downturn of 2008 to 2009, the 12-month output producer prices were growing at similar or lower rates than the 12-month CPI rate.
Figure 1: Annual growth for PPI input (LHS), PPI output and CPI (RHS)
UK, January 2008 to January 2017
Source: Office for National Statistics
Notes:
- These data are also available within the Dashboard: assessing the post-referendum UK Economy.
Download this image Figure 1: Annual growth for PPI input (LHS), PPI output and CPI (RHS)
.png (29.6 kB) .xls (37.4 kB)
5. The UK and other developed countries all saw stronger consumer price growth during 2016
The Harmonised Indices of Consumer Prices (HICP) are calculated using a common basket of goods to provide the best measure for comparisons of consumer price inflation across the European Union. The USA also produces a measure of inflation on a HICP-consistent basis. In the UK, the HICP is equivalent to the Consumer Prices Index (CPI).
Figure 2 shows that HICP rates of inflation for the EU, Germany, the UK and USA are all over 1% for the first time in around 2 years. France’s inflation rate in comparison remains below 1% but has been increasing since March 2016.
Figure 2: HICP for selected countries, 12-month growth rate
January 2012 to December 2016
Source: Eurostat
Notes:
- USA data from January 2012 to November 2016
- EU 28 refers to the 28 member states of the European Union. Weights are not available for all Member states so a series excluding UK, Germany and France is not available.
Download this chart Figure 2: HICP for selected countries, 12-month growth rate
Image .csv .xlsOver the time period shown in Figure 2, the UK has seen slightly higher rates of inflation than the other countries, but all have followed broadly similar trends of falling inflation rates between 2012 and 2015, with the US experiencing deflation during 2015. This was largely driven by the fall in global oil prices at that time which are denominated in dollars.
Since the beginning of 2016, all the countries shown in Figure 2 have experienced increasing rates of inflation, as higher global oil prices have started to feed through into higher prices for fuel and lubricants. In December 2016, the UK, EU 28, Germany and France all reported 12-month growth rates of the fuels and lubricants component of HICP of above 5%. The depreciation of sterling of around 17% against the dollar during 2016 will also be influencing the UK. Currency effects are likely to be less significant for euro area countries such as Germany and France, as the euro has strengthened slightly against the dollar during 2016.
Back to table of contents6. Although food prices are generally lower than 2 years ago, meat and vegetables are getting more expensive
Figure 3 shows price indices for several class-level categories that sit within the Consumer Prices Index (CPI) “Food” group over the period since January 2014. During this period there has been relatively intense competition between food retailers, and increasing market shares from discount food stores. There has also been a rise in the value of sterling in 2014 and 2015 followed by depreciation during most of 2016.
The effective exchange rate for sterling was around 10% lower in value by the end of January 2017 compared with the end of January 2014. The exchange rate can affect the prices paid for directly imported food such as fruit and vegetables and influence the prices of manufactured food products such as bread and cereals which use a range of imported foodstuffs and products. Output producer prices for a range of food products have also been increasing in recent months. This is discussed in the UK producer price inflation: Jan 2017.
Figure 3 highlights 3 specific class-level price indices, as well as the weighted movement for the entire group (the dashed line) and summarises the movement of the remaining price indices in this group using a swathe to denote the range. Fruit prices have generally been higher than other types of food since 2014, and vegetable prices the lowest.
Food prices are still around 5% below 2014 levels, but they have been increasing since the end of 2016. At a more detailed level, meat, fish and vegetable prices have all been increasing over this period. The movement in vegetable prices could be linked to poor harvests in Europe for a range of vegetables this season.
Figure 3: Class-level price indices for CPI “Food” group
UK, January 2014 to January 2017

Source: Office for National Statistics
Notes:
- Price data are aggregated to the 85 class-level categories defined in the Classification of Individual Consumption According to Purpose (COICOP).
- The class-level indices shown in this graph are fish (01.1.3), vegetables (01.1.7) and fruit (01.1.6).
- The group level index Food (01.1) is also shown.
Download this image Figure 3: Class-level price indices for CPI “Food” group
.png (29.7 kB) .xls (21.5 kB)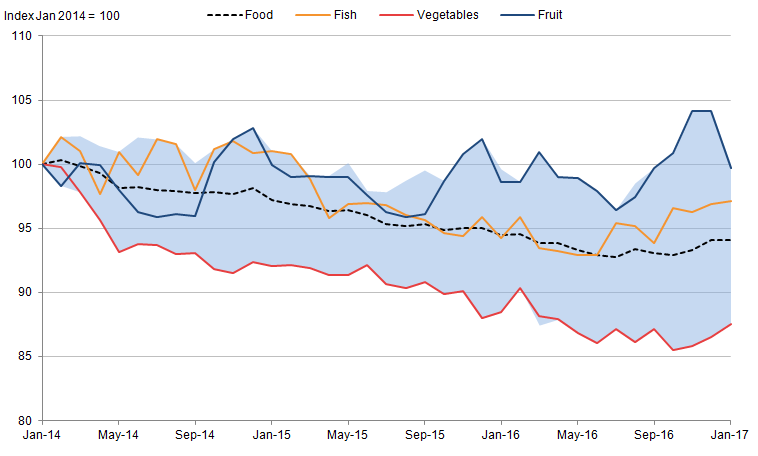
7. Increases in producer prices continue to put pressure on manufacturers’ margins and consumer prices
Previous analysis has shown that there is a relationship between producer price increases for fuel and food which are starting to be reflected in upward movements in their related consumer price indices as manufacturers begin to pass on cost pressures to consumers.
Figure 4 shows the relationship between producer and consumer prices for the motor vehicles sector.
Figure 4: Input and output PPI for the manufacture of motor vehicles and CPI new cars
UK, December 2011 to January 2017
Source: Office for National Statistics
Download this chart Figure 4: Input and output PPI for the manufacture of motor vehicles and CPI new cars
Image .csv .xlsFigure 4 shows that Producer Price index (PPI) input prices for cars closely follow the PPI output prices of parts and accessories for the motor vehicle supply chain, and both series have been rising steadily since the end of 2015. Factory gate prices for motor vehicles produced in the UK were flat between 2012 and the middle of 2016, but have recently started to increase in line with increased input costs and the costs of parts and accessories. This increase in costs may be eroding an element of profit margin for the retailer as consumer prices look to have remained relatively subdued throughout this time to maintain competitiveness.
However, in January 2017 there has been an up-tick in the index for new cars1, with the 12-month growth rate increasing to 2.4% from 1.0% in December 2016. This is in line with the increase in output prices since mid-2016 for motor vehicles and may be a sign that increased costs of production to UK manufacturers and sterling effects are beginning to feed into the price of new cars for consumers.
Notes for: Increases in producer prices continue to put pressure on manufacturers’ margins and consumer prices
- There is some quality adjustment for new cars within the CPI. More detail is in the CPI Technical Manual.
8. House price growth slowed towards the end of 2016, particularly in London
This month provides a provisional estimate for December average house prices for the UK and enables an analysis of the whole of 2016. Overall, UK house prices growth remained robust over the past year with annual average growth of 7.5%, compared to 6.0% in 2015.
There are well-known and persistent regional differences in house price growth across the UK. Figure 5 shows average 12-month house price growth rates have been greater in London than the UK as a whole since 2010. However, since July 2016, the 12-month UK and London house price growth rates have started to converge for the first time during this period. Growth in private rental prices in London have also slowed during 2016, falling from a 12-month growth rate of 3.9% in January 2016 to 2.1% in January 2017.
The fastest-growing regions for house prices and rental prices are now East and South East England. In the latest period, the 12-month growth rate for average house prices in London was 7.5%, below the average for England of 7.7%. This is the first time that London house price growth was below that of England since August 2009.
Figure 5: UK and London 12-month house price growth (non-seasonally adjusted)
January 2010 to December 2016
Source: Office for National Statistics
Download this chart Figure 5: UK and London 12-month house price growth (non-seasonally adjusted)
Image .csv .xlsDuring 2016, there was a boost to house sales in March as purchases were brought forward before the increase in Stamp Duty Land Tax on purchases of additional residential properties came into effect in April 2016. As a result, buy-to-let mortgages as a proportion of all mortgage completions rose from 18% in February to 30% in March. Further analysis of the effects of the changes in stamp duty can be found here: The effect of stamp duty changes on housing market activity.
RICS also reported that uncertainty following the EU Referendum result in June contributed to the slowdown in house price growth and this impacted London house price growth more than that for the UK as a whole.
Back to table of contents