1. Main changes
The weights for the Consumer Prices Index including owner occupiers' housing costs (CPIH) and the Consumer Prices Index (CPI) have been updated to reflect changes in household spending patterns.
For the new 2021 weights, we have followed international guidance and made adjustments to better reflect the impact of the coronavirus (COVID-19) pandemic in certain spending categories.
As a result of coronavirus pandemic adjustments, we have seen more significant changes in weight this year compared with updates in more typical periods.
2. Overview of updating consumer prices index weights
Consumer price inflation is an important indicator of how the UK economy is performing. The "shopping basket" of items and their economic importance (or weight) used in compiling the various measures of consumer price inflation1 are reviewed and updated each year to ensure the indices remain representative of the latest consumer spending patterns. This article focuses on updates and changes to the weights applied within these baskets. The tables in Annex A present the latest (February 2021 updated) Consumer Prices Index including owner occupiers' housing costs (CPIH) weights (Table W3) and Consumer Prices Index (CPI) weights (Table W1) from 2005 onwards. The latest Retail Prices Index (RPI) weights (Table W2) are also included for reference.
Accounting for the impact of the coronavirus (COVID-19) pandemic in 2021 weights
For CPIH and CPI, the 2021 weights would normally be based on spending patterns for 2019 from the national accounts, which is the latest set of reliable and complete data available to us for a full calendar year. Given the effect of the coronavirus (COVID-19) pandemic on spending during 2020 under lockdown conditions, we have changed the procedures for 2021.
In line with international guidance (PDF, 503KB), we have decided to update the weights and basket, and to adjust the weights where there has been a clear change in spending between 2019 and 2020. At the time we calculate the new weights, we only have expenditure data available for the first three quarters of 2020 and therefore the final quarter needs to be estimated.
For RPI, the 2021 weights would normally be based on spending patterns for the 12 months ending June 2020 from our Living Costs and Food Survey (LCF). Since this includes a period when spending was affected by the coronavirus pandemic, we have decided to use the results from the survey without further adjustment for changed spending patterns.
In January 2021, we published the coronavirus pandemic and Consumer Price Inflation weights and prices: 2021 article describing the procedures in full detail.
This article will primarily focus on the weights update for CPIH. Further detail on the methods and process discussed in this article can be found via the CPIH compendium and the Consumer Price Indices technical manual.
Notes for Overview of updating consumer prices index weights:
- Namely CPIH, a measure of UK consumer price inflation that include owner-occupiers' housing costs, the Consumer Price Index (CPI) and the Retail Prices Index (RPI).
3. Weights for 2021
What is a weight?
Consumer price inflation is the rate at which the prices of goods and services bought by households rise or fall and is estimated using price indices. One way to understand a price index is to think of a very large shopping basket1 containing goods and services typically bought by households. The price index estimates changes to the total cost of this basket by calculating the average of price changes of the items within the basket.
However, we know that households spend more on some goods and services than others, so we would expect, for example, a 10% increase in the price of petrol to have a much bigger impact on the basket than a similar rise in the price of tea. For this reason, the components of price indices are weighted using the amount we spend on these items as consumers, to ensure that it reflects the relative importance of the various items in the average shopping basket.
The various weights used in the calculation of consumer price inflation, along with the items that form the "shopping basket" are reviewed and updated each year. This ensures weights remain representative of current household expenditure patterns and reflect the introduction of new items into the shopping basket and removal of old ones. Considering the large changes in consumer spending as a result of the coronavirus (COVID-19) pandemic, this update to the weights is more important than ever in 2021. The article, Consumer price inflation basket of goods and services, 2021 explains the annual update to the content of the consumer price inflation basket of goods and services.
How we calculate weights in consumer price indices
Within CPIH and CPI, there are four different types of weight:
central/regional shop weights
stratum weights
CPIH and CPI item weights
Classification Of Individual Consumption according to Purpose (COICOP)
This is the order in which the weights are used. The first two types of weights are used to produce the item indices (that is, combining the individual items within the basket), the next is used to combine items into higher level indices (that is, COICOP level indices) and the last is used for all levels above this. Aggregation is explained further in Section three of the technical manual.
This article will now focus on the COICOP level weights. In 2017, a new, additional level of the COICOP classification was introduced. This new level of detail, known as COICOP5 sits between the existing class (or COICOP4) level indices and item level indices. Further detail on the impact of introducing this additional level of classification can be found in the October 2016 article explaining methodological improvements on the consumer price indices.
Data sources for CPIH and CPI weights
In consumer price inflation, expenditure weights are designed to reflect the expenditure patterns of the target population of households covered by the index. CPIH and CPI have a different target population to RPI2 and therefore have different expenditure weights, and thus a different source of data underpinning the weight.
The CPIH and CPI cover all expenditure within the UK by:
private households
residents of institutions such as university halls of residence or nursing homes
visitors to the UK from abroad
Information on spending patterns, which underpin the CPIH and CPI weights, largely come from the Household Final Consumption Expenditure (HHFCE)3 component of the UK National Accounts. These data are used because the expenditure information is comprehensive and balanced against data collected in other sectors of the economy to create the most accurate picture of consumer spending. However, there are a few exceptions where additional source data are used to supplement the HHFCE data and improve the coherence with the intended scope of the indices:
the Living Costs and Food Survey (LCF) is used to supplement HHFCE data in the calculation of weights for air travel, package holidays and actual rentals4
the International Passenger Survey (IPS), which is also used in the calculation of a weight for air travel
the public sector component of the UK National Accounts, which is used in the calculation of the weight for passport fees
The HHFCE expenditure used in the annual update of CPIH and CPI weights is always the latest calendar year national accounts dataset that is available at the time of weights calculation5, that are consistent in methodology with the latest published Blue Book. So, for 2021 weights this would be data for the 2019 calendar year. The annual CPIH and CPI weights update commences in January each year, so the weights are sourced from the latest national accounts update in Quarter 3 of the preceding year.
For example, for the 2021 weights update, for the sections of the basket not deemed to be affected significantly by the coronavirus (COVID-19) pandemic, the latest set (2019 calendar year) of HHFCE expenditure was taken from the Quarter 3 2020 National Accounts dataset. These data are consistent with the most recent Blue Book release (Blue Book 2020, published in October 2020).
In all cases the current price measure (as opposed to the chained volume measure) is used. Effectively, the majority of the 2021 weights are calculated using a more up-to-date version of data in Table 6.2.14 of Blue Book 2020 (XLS, 513KB): individual consumption expenditure at current market prices by households, non-profit institutions serving households and general government: classified by function.
However, because of the impact of the coronavirus pandemic, and in line with international guidance, this year we decided to adjust the weights where there has been a clear change in spending between 2019 and 2020. Had there been no coronavirus pandemic impact on consumer spending, we would have used the 2019 calendar year HHFCE dataset as detailed above.
We published the Coronavirus (COVID-19) pandemic and Consumer Price Inflation weights and prices: 2021 article describing the adjustments and procedures used this year in more detail.
Methodology behind the update of COICOP weights and above
Higher level CPIH and CPI weights (that is, at the COICOP level and above) are updated annually with the January index (published in February), followed by a further update with the February index (published in March) following the 2017 introduction of improved methodology (the "double update") for the production of consumer price inflation, and to coincide with the introduction of new items to the basket of goods and services.
The underlying expenditure in each COICOP grouping is converted to an expenditure share relative to total household expenditure for the overall basket and given an integer weight in parts per thousand so that the sum of the weights equals 1000.
The weights are based on the latest available calendar year's HHFCE data6; however, the data are not timely enough for immediate use in consumer price indices because of the lag at which national accounts data are published. For example, in Blue Book 2020, the latest available calendar year is 2019. To make the expenditure data as up to date as possible, we can restate the expenditure in current prices using a process called price updating. To explain further, for a given index year y, the weights are based on the latest available national accounts expenditure from y-2.
At the first annual update of weights (published with the January index), the expenditure needs to be price updated to December of year y-1. For the 2021 weights this would typically mean expenditure from the calendar year 2019 is updated to December 2020 by applying the respective change in price between 2019 and December 2020 (known as the price update factor). This process is applied at the lowest level of COICOP within the weighting structure using the accompanying price movement for that COICOP level in CPIH and CPI (this process is presented in formula in Annex E of the CPIH compendium).
At the second update of weights, published with the February index, the same underlying 2019 expenditure is updated to January of year y. So, for the 2021 weights this would mean HHFCE expenditure from the calendar year 2019 is updated to January 2021 by applying the respective change in price between 2019 and January 2021.
This approach ensures the latest available expenditure is adjusted so that it is suitable for use in the calculation of consumer price inflation weights. Effectively the same expenditure underpins both the January and February update of weights, with the main difference being the period covered in the price update.
Further details on this double update methodology can be found in the October 2016 methodology article and Annex E of the CPIH compendium.
There are two further aspects of the annual weights update that warrant a mention.
Firstly, when calculating the CPIH and CPI weights for insurance (such as insurance connected with the dwelling, travel, health and transport) an average of the most recent three years' expenditure is used in line with international recommendations. As insurance expenditure is recorded on a net basis (the difference between expenditure on insurance premiums and the amount paid out in claims) this approach safeguards against exceptional cases where the amount paid out in claims could exceed the amount paid in premiums.
Secondly, the revisions policy for consumer price statistics means that indices are not usually revised historically. Published weights for consumer price inflation reflect the best available understanding of what households spend their money on in the UK at the time they were produced.
While the source data are often revised at a later date, these revisions are not taken into the calculation of weights, that is, only the latest calendar year's data are used in each weights update. As such, the changes in weights between years may reflect changes in data sources, methods and definitions, as well as changes in spending patterns. For this reason, the weights should not be used to analyse trends in consumer spending over time.
For 2021 weights, the approach to calculating CPIH and CPI expenditure weights is different. We will unusually incorporate 2020 (y-1) data for those spending categories that have been most heavily affected by the coronavirus pandemic. This allows us to incorporate more timely data, that are more reflective of current consumer spending, but also means that there is a greater level of uncertainty attached to these estimates.
Estimates of consumer expenditure will evolve as more robust data and additional sources become available. However, all the expenditure weights represent our best estimate of consumer spending at this point in time and will therefore not be revised later in the year.
The aggregation process in consumer price indices
Having explained how and why weights are calculated in consumer price indices, it is worth defining the various levels of aggregation that weights are used in the production process.
The CPIH and CPI are classified according to the Classification Of Individual Consumption by Purpose, commonly referred to as COICOP. This is the international classification of household expenditure and is used in the production of National Accounts, Living Cost and Food (LCF) survey and consumer price indices. COICOP enables the consistent classification of individual consumption expenditure incurred by households, non-profit institutions serving households and general government according to their purpose.
In previous years (prior to 2017) there were four COCIOP levels, with the fourth COICOP level being commonly referred to as "class level" within consumer prices. Items within these levels are aggregated together using expenditure weights up to the first COICOP level – the headline CPIH or CPI.
Figure 1: The aggregation structure in consumer prices prior to the introduction of COICOP5

Source: Office for National Statistics
Download this image Figure 1: The aggregation structure in consumer prices prior to the introduction of COICOP5
.png (31.5 kB)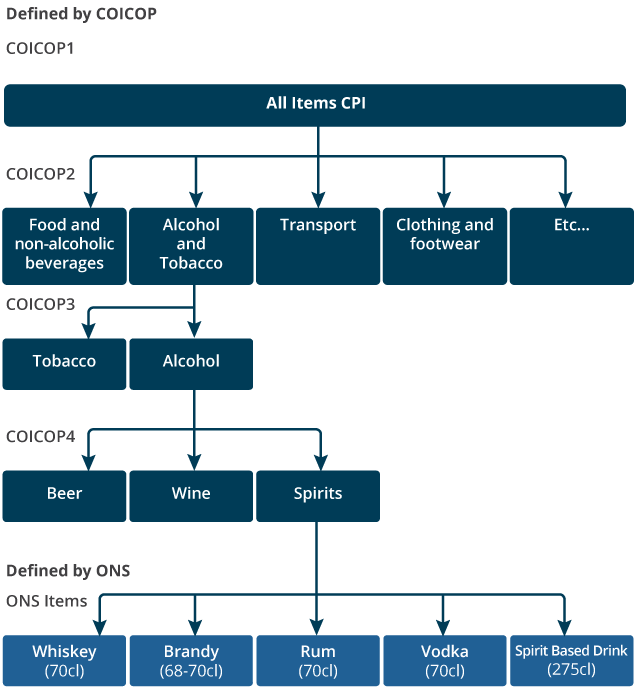
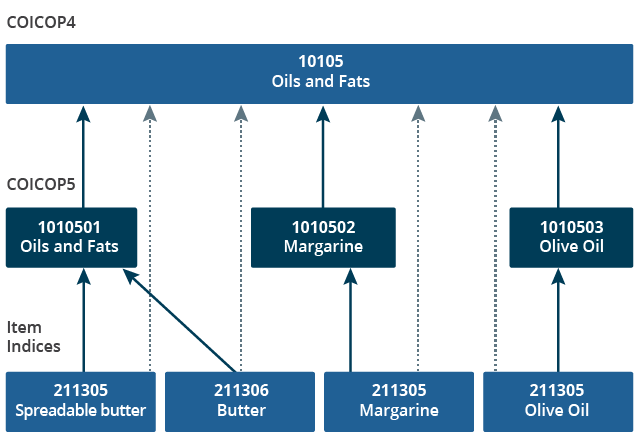
Traditionally the class level (COICOP4) was the first building block of aggregation however, as of March 2017 a new, more detailed level was introduced into CPIH and CPI aggregation. This new level is referred to as COICOP5 and it sits between the existing COCIOP4 level indices and item level indices.
Effectively the COCIOP5 classification has replaced COICOP4 as the first building block of aggregation in consumer price indices and is the level at which HHFCE expenditure is delivered, price updating of expenditure takes place and COICOP based weights in consumer price indices are first calculated. Further details on the introduction and impact of COICOP5 in 2017 can be found in the October 2016 article.
Figure 2: The introduction of COICOP5 provides an additional level of detail into the aggregation process
Source: Office for National Statistics
Download this image Figure 2: The introduction of COICOP5 provides an additional level of detail into the aggregation process
.png (19.2 kB)
A summary of changes to the methods and data sources used in 2021
In line with international guidance, we have made adjustments to reflect the impact of the coronavirus pandemic on consumer spending in certain areas of the basket. The Coronavirus (COVID-19) and Consumer Price inflation weight and prices: 2021 article provides full details of the methods and data sources used to make these adjustments, but to summarise:
we identify areas of the basket where there was a shift in expenditure of 25% (allowing for an element of judgement in the range from 20 to 25%) when comparing provisional 2020 national accounts estimates with published 2019 data
for any area of the basket that has seen a shift in expenditure outside this threshold we use the estimated 2020 expenditure
as expenditure in these impacted areas is now based on 2020, the price updating process is changed slightly to reflect this; for only those components based on 2020 expenditure, the price update ratio will be calculated using the average of 2020 prices and not 2019 as in the standard case
once all 2020 based expenditure has been updated for those areas of the basket affected, the expenditure is combined with the rest of the basket (based on the 2019 expenditure) and weights calculated as usual
Weight changes between 2021 and 2020
This section considers the largest weight changes between 2021 and 2020, focusing on the CPIH weights, and explains the reasons for these changes. These published weights reflect the best available understanding of what households spent their money on at the time the weights were produced. Differences in the weights between years can reflect changes in data sources, methods and definitions, as well as changes in consumer spending in the UK over time. Therefore, these weights should not be used to compare consumer spending over time.
It is worth remembering that the calculation of 2021 weights have taken place after the exceptional impact of the coronavirus pandemic. As a result of the pandemic and the subsequent impact on consumer spending in certain areas of the basket, the latest weights show larger movements between years than would typically be expected. Full details on the adjustments made to the underlying expenditure used in the calculation of consumer prices inflation weights for 2021 can be found in the February 2021 article.
This section will firstly look at the CPIH divisional level weights (COICOP2 level) and drill down through the structure to explain any movements when compared with 2020 by looking at the various COICOP levels. Additionally, any notable lower level movements are also explained. The tables in Annex A present the latest (February 2020 updated) CPIH weights (table W3) and CPI weights (table W1) down to a class level from 2005 onwards. The latest RPI weights (table W2) are also included for reference.
The update of 2021 weights have seen two separate updates, in line with the "double update" methodology introduced in 2017:
the first update of weights for the January 2021 set of indices, where expenditure for 2019 is price updated to December 20207
the second update of weights for the February to December 2021 indices, where the expenditure for 2019 is price updated to January 2021
Table 1 presents the CPIH divisional level COICOP weights. The most notable movements will be explained further below, firstly focusing on the comparison of January 2021 updated weights to the latest available weights for 2020 (that is, those updated in February 2020 and used for the period February to December 2020); and then explaining any notable change between the January 2021 and February 2021 updated weights. Typically, changes in weight between years can be caused by two factors:
a change in the underlying expenditure used to calculate the weight
a change in the price factor applied to price update the expenditure
The change when comparing the February 2021 update against the January 2021 update will be driven by any notable movement in price update factor, which is used to price update the underlying expenditure, whereas any change when comparing the January 2021 updated weight with last year's weights will be because of a combination of changes in expenditure (comparing underlying expenditure used in this update with the expenditure used last year) and any notable movement in the price update factor.
It is also worth remembering that weights are relative, so any change in weight caused by the factors mentioned will cause a relative reallocation of weight elsewhere in the basket. It is worth noting that the adjustments made to consumer expenditure in this year's weights to reflect the impact of the coronavirus has reduced the total spend across the aggregate basket. As a result, the relative reallocation of weight seen this year may be larger than in previous years as we see reductions in the consumer spend in areas of the basket such as travel, transport and restaurants and so on.
| parts per thousand (ppt) | |||
|---|---|---|---|
| CPIH Division | 2020 February to December weight (ppt) | 2021 Weight January update (ppt)² | 2021 Weight February update (ppt) |
| 0.1 Food and non-alcoholic beverages | 79 | 89 | 89 |
| 0.2 Alcoholic beverages and tobacco | 32 | 35 | 35 |
| 0.3 Clothing and footwear | 51 | 61 | 59 |
| 0.4 Housing, water, electricity, gas and other fuels | 296 | 328 | 328 |
| 0.5 Furniture, household equipment and maintenance | 50 | 49 | 49 |
| 0.6 Health | 22 | 20 | 20 |
| 0.7 Transport | 120 | 106 | 107 |
| 0.8 Communication | 17 | 19 | 19 |
| 0.9 Recreation and culture | 136 | 113 | 112 |
| 10. Education | 24 | 30 | 30 |
| 11. Restaurants & hotels | 96 | 68 | 69 |
| 12. Miscellaneous goods and services | 77 | 82 | 83 |
| Total | 1000 | 1000 | 1000 |
Download this table Table 1: CPIH division level weights, 2020 to 2021¹
.xls .csvNotes:
- A double weights update was introduced in 2017. The first update of weights covers the January period only. The second update covers the period February to December.
- 2021 weights have been adjusted to reflect the impact of the coronavirus (COVID-19) pandemic on household expenditure in 2020. Full details can be found in the Coronavirus (COVID-19) and Consumer Price Inflation weights and prices: 2021 article.
There are several divisions with notable movements when comparing the January 2021 updated weights with 2020 weights.
Division 01: Food and non-alcoholic beverages
This division has shown an increase of 10 parts per thousand (ppt) when comparing the January 2021 updated weight with the weight used in 2020.
There was no direct coronavirus adjustment to the underlying expenditure within this division, however, there will be an indirect impact on the weight from the reallocation of weight caused by coronavirus adjustments elsewhere in the basket. If a weight increases as a result of such a reallocation of weight, it does not necessarily mean the level of household spending has increased in that area, but that a relatively bigger portion of the household budget is now spent in this area as an artefact of total household spend now falling.
While the increase in weight is spread across most of the component items within this division, the most notable movements are for:
the COCIOP5 for other bakery products has increased by 0.93 ppt between updates; while the expenditure is flat between updates, the increase is driven by a relative change in weight caused by other areas of the basket
likewise, there is an increase of 0.98 ppt for dried, salted or smoked meat driven by a relative change in weight caused by changes elsewhere in the basket
Division 03: Clothing and footwear
This division has shown an increase of 10 ppt from 51 ppt to 61 ppt when comparing the January 2021 updated weight with 2020. There is no direct coronavirus adjustment made to the expenditure underpinning this division.
The main contribution to the increase in weight is coming from clothing, where there is a general increase in underlying expenditure used in the weights update, coupled with a reallocation of weight from other areas of the basket, which have seen expenditure levels fall. Most notably:
the COICOP5 for women's garments has increased by 3.5 ppt driven by an increase of approximately 3% in the underlying expenditure between weights updates
similarly, the COICOP5 for men's garments has seen an increase of 2.03ppt between weights updates driven by an increase of 5% in underlying expenditure
This division then sees a fall of two ppt at the February 2021 update of weight, to 59 ppt. This decrease in weight was driven by a fall in the price ratio of approximately 5% between December 2020 and January 2021, which is used to uprate the underlying expenditure. As a result, this reduced the expenditure in these components of the basket and led to the fall in weight.
Division 04: Housing, water, electricity, gas and other fuels
This division has shown an increase of 32 ppt from 296 ppt to 328 ppt when comparing the January 2021 updated weight with 2020. This increase in weight is most notably driven by the component for imputed rents. While there was a small coronavirus-related adjustment within this division to account for a fall in the amount spent on UK self-catering holidays as a result of the coronavirus pandemic (this component of expenditure is allocated to actual rents in the CPI and CPIH basket), the underlying expenditure is still relatively flat between periods.
The increase is caused by a reallocation of weight from elsewhere in the basket where more substantive changes have taken place. The most notable change in weight within this division is for the class for imputed rents which has increased by 22 ppt from 163 ppt in 2020 to 185 ppt in the January 2021 update. The underlying expenditure is relatively flat between updates, so this increase is driven by the reallocation of weight from elsewhere in the basket.
Division 7: Transport
This division has seen a fall of 14 ppt from 120 ppt last year to 106 ppt in the January 2021 update. The weight then increases by 1 ppt to 107 ppt at the second update in February 2021. There is a direct adjustment to some of the underlying expenditure in this division as a result of the coronavirus pandemic. The adjustments in this division focused mainly on passenger transport by air, sea and railway, which all saw notable reductions in household spending during the pandemic.
The main fall in weight was within transport services, notably:
passenger transport by train, which fell by 3.04 ppt as a result of a fall in underlying expenditure of approximately 45% (including an adjustment to reflect the coronavirus impact)
international passenger transport by air, which fell by 1.82 ppt as a result of a fall in underlying expenditure of approximately 75% (including an adjustment to reflect the coronavirus impact)
There were other areas of this division that saw notable falls in weight. The COICOP5 for diesel fell by 1.48 ppt and petrol fell by 2.48 ppt as a result of a fall in the underlying expenditure of roughly 25%, including an adjustment to reflect the coronavirus pandemic.
Finally, the purchase of new motor cars and used motor cars both fell by 2.0 ppt on the back of an approximate fall in underlying expenditure of 15% and 25% respectively. Again, expenditure in both these areas of the basket were adjusted to reflect the impact of the coronavirus pandemic.
Division 09: Recreation and culture
This division has seen a fall in weight of 23 ppt from 136 ppt in 2020 to 113 ppt in January 2021. There are coronavirus adjustments made to the underlying expenditure within this division to reflect the impact of the pandemic on package holidays, recreational and sporting events and cultural services. The most notable falls in weight are:
the weight for package holidays has fallen by 25 ppt from 34 ppt in 2020 to 9 ppt in January 2021; the fall is driven totally by the coronavirus adjustment to the underlying expenditure, which is roughly 75% lower than what was used last year
recreational and sporting services participation has fallen by 10 ppt between 2020 and 2021; again, this fall in weight is driven by adjustments used to reflect the impact of the coronavirus pandemic on the household spend in this area
most notably attendance at cinemas, theatres and concerts has fallen by 2.48 ppt on the back of a fall in expenditure of roughly 49%, attendance at museums and libraries etc. has fallen by 1.48 ppt on the back of a fall in expenditure of around 44% and participation in recreational and sporting services has fallen by 1.68 ppt on the back of a 28% fall in expenditure
The falls in weight are offset by increases in the COICOP5 for games and hobbies, which increased by 2.24 ppt on the back of an increase in the underlying expenditure of 10% between weights updates and the weight of COICOP5 for toys and celebration articles increased by 1.76 ppt on the back of an increase in expenditure of 6% (no coronavirus adjustment was applied to these areas).
Division 10: Education
This division has seen an increase in weight of 6 ppt from 24 ppt last year to 30 ppt in January 2021. The increase in weight is spread across most components in this area of the basket and is driven by both an increase in underlying expenditure and a relative reallocation of the weight because of the coronavirus impact elsewhere in the basket. There are no direct coronavirus adjustments in this division, however, improvements to the measurement of this component of household expenditure were introduced in the 2020 Blue Book, which led to upwards revisions to the recorded expenditure.
Division 11: Restaurants and hotels
This division has seen a fall of 28 ppt from 96 ppt last year to 68 ppt in the January 2021 weights. There have been adjustments made to the underlying expenditure in this division to reflect the impact of the coronavirus pandemic and the reduction seen in household spend on catering services and accommodation services. The most notable falls in weight are:
restaurants, cafés and so on have seen a fall in weight of 15 ppt from 55.5 ppt to 40.5 ppt in January 2021 as a result in a fall in underlying expenditure of approximately 32%; there has been a direct coronavirus adjustment to reflect the fall in household expenditure
fast food and takeaway services have seen a fall in weight of 5.0 ppt from 18.5 ppt to 13.5 ppt in January 2021; the underlying expenditure has fallen by approximately 32% as a result of adjustments to reflect the coronavirus pandemic
the COICOP5 for canteens has seen a fall in weight of 3.0 ppt from 6.0 ppt to 3.0 ppt again as the result of a coronavirus adjustment to the underlying expenditure, which fell by 58%
Within accommodation services, the main driver of the fall in weight was within hotels, motels, inns and so on, which saw a fall in weight of 4.41 ppt from 13.76 ppt to 9.35 ppt in January 2021. The expenditure was subject to coronavirus adjustments and fell by approximately 38% between weights updates as a result.
Division 12: Miscellaneous goods and services
This division has increased in weight by 5.0 ppt from 77 ppt in 2020 to 82 ppt in the January 2021 update. There are no direct coronavirus adjustments having a large impact within this division. The main driver of the increase is in the COICOP5 for other fees and services, which increased by 2.37 ppt from 7.15 ppt to 9.52 ppt in the January 2021 update. This is caused by an increase in the underlying expenditure of approximately 17%.
Notable movements between the January 2021 and February 2021 update
This section focuses on any notable movement in weight between the January 2021 and February 2021 update that have not already been covered above. Most of the divisions experience small, offsetting change in weight of plus or minus one ppt, which is driven by a change in the price update ratio used at the January and February 2021 updates (where the underling price index has changed). However, there is no change in weight that warrants any further briefing in comparison to the changes seen when comparing January 2021 weights with those used last year.
Notes for Weights for 2021:
In reality there are three inflation baskets: for the CPIH, CPI and a basket used by RPI.
Further details on the RPI can be found in Section 10 of the Consumer price indices technical manual.
For 2021 weights, coronavirus (COVID-19) pandemic adjustments have also been made to these sources where necessary.
Notwithstanding the adjustments made to reflect the Coronavirus (COVID-19) and Consumer Price Inflation weights and prices: 2021.
Notwithstanding the adjustments made to reflect the coronavirus (COVID-19) pandemic in 2021.
Notwithstanding the adjustments made to reflect the Coronavirus pandemic in 2021.
4. Consumer price inflation weights data
Consumer price inflation, updating weights: Annex A, Tables W1 to W3
Dataset | Released 15 March 2021
The latest annual update of consumer price inflation weights, 2021.
5. Future developments
In this article, we have described the methodology used to update the annual weights to be used in the production of our suite of consumer price indices. This has included how the underlying expenditure used in this process has been updated to represent consumer spending in those areas most impacted by the coronavirus (COVID-19) pandemic. As this weights update represents our best estimates of consumer spending at this point in time, they will not be revised later in the year.
Back to table of contentsContact details for this Article
cpi@ons.gov.uk
Telephone: Consumer Price Inflation Enquiries: +44 (0)1633 456900. Consumer Price Inflation recorded message (available after 9.45am on release day): + 44 (0)800 0113703