Table of contents
- Main points
- New model for publishing GDP
- Things you need to know about this release
- Gross domestic product (GDP) main figures
- Construction falls, manufacturing growth weakens and services growth continues to be subdued
- Data content and monthly path of components for Quarter 1 2018 preliminary estimate
- Links to related statistics
- Quality and methodology
1. Main points
UK gross domestic product (GDP) was estimated to have increased by 0.1% in Quarter 1 (Jan to Mar) 2018, compared with 0.4% in Quarter 4 (Oct to Dec) 2017.
UK GDP growth was the slowest since Quarter 4 2012, with construction being the largest downward pull on GDP, falling by 3.3%.
Production increased by 0.7%, with manufacturing growth slowing to 0.2%; slowing manufacturing was partially offset by an increase in energy production due to the below-average temperatures.
The services industries were the largest contributor to GDP growth, increasing by 0.3% in Quarter 1 2018, although the longer-term trend continues to show a weakening in services growth.
While some impacts on GDP from the snow in the first quarter of 2018 have been recorded for construction and retail sales, the effects were generally small, with very little impact observed in other areas of the economy.
2. New model for publishing GDP
We published a response to the consultation on proposed changes to the gross domestic product (GDP) release schedule on 19 October 2017. Further details on this response are available on our Consultation Hub. In summary, an estimate of monthly GDP will be published on 10 July 2018 (for the reference period of May) and there will be two quarterly estimates of GDP per quarter rather than the current three; the preliminary estimate of GDP will be deferred by around two weeks and the second estimate of GDP will be brought forward by two weeks to form the new first estimate released six weeks after the end of the quarter. The income and expenditure approaches to GDP will be made available in this new first estimate, two weeks earlier than presently. The first estimate of quarterly GDP (for Quarter 2 (Apr to June) 2018) under this new model will be published on 10 August 2018.
This release is the final Preliminary estimate of GDP under the current publishing model as we move to the new model outlined previously in July 2018. Alongside this release, we have published an article giving further details on the implementation of the new GDP publishing model.
Back to table of contents3. Things you need to know about this release
Change in gross domestic product (GDP) is the main indicator of economic growth. The preliminary estimate of GDP is based solely on the output approach to measuring GDP.
The output approach measures gross value added (GVA) at a detailed industry level before aggregating to produce an estimate for the whole economy. GDP (as measured by the output approach) can then be calculated by adding taxes and subtracting subsidies (both only available at whole economy level) to this estimate of total GVA. However, as there is no information available on taxes and subsidies at this stage, the quarterly growth for output GVA is taken as a proxy for GDP growth (more information on creating the preliminary estimate of GDP is available on our GDP methodology page).
Under the present model, the preliminary estimate is the first of three estimates of GDP published by Office for National Statistics, followed by the second estimate and the quarterly national accounts. In the second estimate of GDP and the quarterly national accounts, the output GVA and GDP estimates are balanced with the equivalent income and expenditure approaches to produce headline estimates of GVA and GDP. Further information on all three approaches to measuring GDP can be found in the national accounts. See Section 2 previously and the separate article for details of the model being introduced with effect from July 2018.
All data in this bulletin are seasonally adjusted, chained volume estimates and have had the effect of price changes removed (in other words, the data are deflated).
The growth estimates within this release are created from short-term measures of output and should be considered alongside medium-term and long-term patterns in the series to give a more comprehensive picture. At this stage, data content is less than half of the total required for the final output estimate. The estimate is subject to revision as more data become available, but these revisions are typically small between the preliminary and third estimates of GDP, with no upward or downward bias to these revisions. More information on the data content and the monthly path of the components of the output measure of GDP are included in section 6. Additional factors around the compilation of today estimates are outlined in the Monthly Economic Commentary published alongside this release.
In accordance with National Accounts Revisions Policy, there are no periods open for revision in this release.
Back to table of contents4. Gross domestic product (GDP) main figures
Table 1 shows data for gross domestic product (GDP), GDP per head and each of the main industry aggregates for Quarter 1 (Jan to Mar) 2018.
Table 1: Gross domestic product main figures, UK, Quarter 1 (Jan to Mar) 2018
| Percentage Change | |||
| Most recent | Most recent | ||
|---|---|---|---|
| Weights per | quarter on a | quarter on the | |
| Description | 10001 | year earlier | previous quarter |
| GDP | 1000 | 1.2 | 0.1 |
| GDP per head | … | 0.6 | -0.1 |
| Agriculture | 7 | -1.3 | -1.4 |
| Production | 140 | 2.2 | 0.7 |
| Manufacturing2 | 101 | 2.5 | 0.2 |
| Construction | 61 | -3.3 | -3.3 |
| Services | 793 | 1.2 | 0.3 |
| Source: Office for National Statistics | |||
| 1. Components may not sum due to rounding. | |||
| 2. Manufacturing is a component of the production aggregate. | |||
| 3. No data represented by … | |||
Download this table Table 1: Gross domestic product main figures, UK, Quarter 1 (Jan to Mar) 2018
.xls (37.4 kB)Figure 1 shows the seasonally adjusted volume series for GDP, along with quarter-on-quarter growths, over the past decade. Quarter 1 2018 grew by 0.1%, the lowest rate of GDP growth since Quarter 4 (Oct to Dec) 2012, following the London Olympics in Quarter 3 (July to Sept) 2012.
Figure 1: Seasonally adjusted gross domestic product (£ billions) and quarter-on-quarter growths
UK, Quarter 1 (Jan to Mar) 2008 to Quarter 1 (Jan to Mar) 2018
Source: Office for National Statistics
Notes:
Growth rates are calculated using unrounded data.
Q1 refers to Quarter 1 (Jan to Mar), Q2 refers to Quarter 2 (Apr to June), Q3 refers to Quarter 3 (July to Sept), Q4 refers to Quarter 4 (Oct to Dec).
Download this chart Figure 1: Seasonally adjusted gross domestic product (£ billions) and quarter-on-quarter growths
Image .csv .xlsFigure 2 shows GDP and the contributions of the main industry aggregates to the growth of GDP on a quarter on same quarter a year ago basis. This highlights an underlying picture of broadly slowing output in the services industries and GDP. The chart also illustrates a fall in construction in the most recent period, the only negative contribution seen in any main component in the period shown.
Figure 2: Contribution to output gross domestic product1, quarter on same quarter a year ago
UK, Quarter 1 (Jan to Mar) 2015 to Quarter 1 (Jan to Mar) 2018
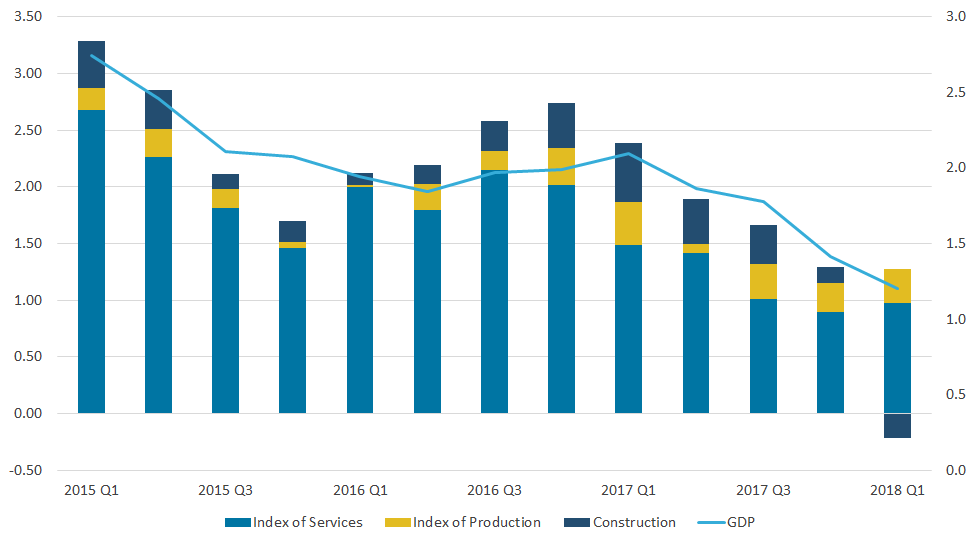
Source: Office for National Statistics
Notes:
- Contributions are to output gross value added and therefore may not sum to the percentage change in average GDP.
- Agriculture has been excluded from this chart due to its low industry weight.
Download this image Figure 2: Contribution to output gross domestic product^1^, quarter on same quarter a year ago
.png (30.9 kB) .xls (27.6 kB)
5. Construction falls, manufacturing growth weakens and services growth continues to be subdued
In Quarter 1 (Jan to Mar) 2018, UK gross domestic product (GDP) was estimated to have increased by 0.1%. The services aggregate was the main driver to the growth in GDP, growing by 0.3% and contributing 0.21 percentage points.
Production continued to grow, with a rise of 0.7% in Quarter 1 2018, contributing 0.10 percentage points to GDP. This was driven mainly by mining and quarrying, and electricity and gas. However, construction contracted by 3.3%, contributing negative 0.21 percentage points to GDP. Although agriculture contracted by 1.4%, the contribution was only negative 0.01 percentage points due to its low industry weight.
Services
Services grew by 0.3% in Quarter 1 2018 when compared with the previous quarter. While three of the four sectors within services experienced growth this quarter, there was a fall in distribution, hotels and catering.
Despite services growth in the most recent quarter, the quarter on same quarter a year ago growth shows a longer-term weakening in this part of the economy, particularly in the more domestic consumer-facing industries. By this we mean retail trade, food and beverage serving activities, publishing, audio visual and broadcasting activities, and arts, entertainment and recreation (Standard Industrial Classification 2007 codes 45, 47, 56, 58, 59, 60, 90, 91, 92 and 93), as shown in Figure 3.
Figure 3: Growth rates of the services sector and its components, quarter on same quarter a year ago
UK, Quarter 1 (Jan to Mar) 2016 to Quarter 1 (Jan to Mar) 2018
Source: Office for National Statistics
Download this chart Figure 3: Growth rates of the services sector and its components, quarter on same quarter a year ago
Image .csv .xlsThe business services and finance sector continued to be the main driver of growth in services, increasing by 0.4% and contributing 0.14 percentage points to quarterly GDP growth. There was broad-based growth within this sector, with the largest contributor to GDP growth being architectural and engineering activities, which increased by 2.5% and contributed 0.04 percentage points to GDP.
Transport, storage and communication experienced a growth of 0.4% in Quarter 1 2018, contributing 0.05 percentage points to GDP. Within this sector, telecommunications was the main driver of growth, growing by 2% and contributing 0.03 percentage points.
Government and other services grew by 0.1%, contributing 0.03 percentage points to GDP. The largest contributor to this sector was human health activities with a growth of 0.5% and contributing 0.03 percentage points to GDP growth. This industry has a high weight within GDP.
In contrast, distribution, hotels and catering fell by 0.1%, contributing negative 0.01 percentage points to GDP in Quarter 1 2018. Retail trade was the largest contributor to the negative growth, decreasing by 0.5%.
The services industries were broadly unaffected by the snow except for retail trade (within the distribution, hotels and catering component of services). The fall in retail trade was driven by a decrease in petrol sales. This could be attributed to adverse weather conditions, which impacted on travel as outlined in the Retail sales, Great Britain: March 2018 bulletin.
Production
Production was estimated to have grown by 0.7% in Quarter 1 2018, up from 0.4% in Quarter 4 (Oct to Dec) 2017. Within production, there was growth in three of the four sectors in Quarter 1 2018.
Mining and quarrying, one of the main drivers of growth in Quarter 1 2018, grew by 3.5%, contributing 0.04 percentage points to GDP. This was due largely to the recovery from the fall in oil and gas production in Quarter 4 (Oct to Dec) 2017, with the Forties pipeline system working at normal capacity this quarter after several days of closure in the final quarter of 2017.
Manufacturing growth slowed to 0.2%, contributing 0.02 percentage points to GDP. This fall in growth was spread across a number of manufacturing industries. However, there is no evidence to show that the fall in the manufacturing growth was due to the effects of the snow. The slowing in manufacturing growth was partially offset by an increase in energy production and supply due to the below-average temperatures in February and March 2018.
Electricity, gas, steam and air conditioning supply grew by 2.3% and contributed 0.04 percentage points to GDP. Meanwhile, water supply, sewerage, waste management and remediation activities fell by 0.3%, with a negligible negative contribution to production.
Construction
Construction output was estimated to have decreased by 3.3% in Quarter 1 2018, contributing negatively to GDP by 0.21 percentage points; this was the weakest quarterly construction growth since Quarter 2 (Apr to June) 2012. The large fall in construction growth in Quarter 1 2018 follows strong growth in December 2017, as seen in the Construction output in Great Britain: December 2017 bulletin. There is some evidence of an impact of the bad weather on construction output. However, output fell across all three months of the quarter, not just during the period of bad weather.
Agriculture
Agriculture decreased by 1.4% in the first quarter of 2018. Agriculture is the smallest of the main industrial groups with a weight of less than 1% in the output measure of GDP.
Back to table of contents6. Data content and monthly path of components for Quarter 1 2018 preliminary estimate
The data content for the Quarter 1 (Jan to Mar) 2018 preliminary estimate is 45% of total output data, which is broadly the same as previous preliminary estimates.
The approach to producing the preliminary gross domestic product (GDP) estimate uses monthly output data for January and February and forecasts for estimating March. The forecasts are informed by early responses to our Monthly Business Survey.
Analysis of early survey returns from businesses that feed into our construction estimates has shown that these tend to be lower than returns that are made at a later point in the data collection period. As a result, a quality adjustment is applied to the quarterly estimates for construction to account for any bias introduced from the lower data content available for March. These adjustments are calculated by assessing the revisions performance of quarterly construction estimates between the preliminary estimate of GDP and the second estimate over a number of periods. The adjustments are removed in the second estimate of GDP, when a fuller quarter of construction data are available.
More information on creating the preliminary estimate of GDP is available on the methodology page.
The Index of Production, construction output and Index of Services all feed into the headline GDP estimate. Some small revisions have taken place to previously published estimates, as seen in Table 2. Additional detail for sectors within production and services can be found in the Monthly path of components dataset, published alongside this bulletin.
Table 2: Previously published and current monthly growth rates in production, construction and services
| UK, Quarter 1 (Jan to Mar) 2018 | ||||||
| Previously Published | Current | |||||
|---|---|---|---|---|---|---|
| January | February | January | February | March1 | ||
| Index of Production | 1.3 | 0.1 | 1.3 | 0.1 | 0.1 | |
| Construction Output | -3.1 | -1.6 | -3.1 | -1.2 | -2.3 | |
| Index of Services | 0.2 | .. | 0.1 | -0.2 | 0.1 | |
| Source: Office for National Statistics | ||||||
| 1. Based on forecasts and early responses to the March Monthly Business Survey | ||||||
| 2. No Data represented by … | ||||||
| 3. Percentage change | ||||||
Download this table Table 2: Previously published and current monthly growth rates in production, construction and services
.xls (36.9 kB)8. Quality and methodology
Some general information on the quality of the estimate of gross domestic product (GDP) can be found in the “Things you need to know about this release” section in the main part of this statistical bulletin. Further information is available on our methodology page.
The GDP Quality and Methodology Information report contains important information on:
the strengths and limitations of the data and how it compares with related data
uses and users of the data
how the output was created
the quality of the output including the accuracy of the data
The national accounts provide an integrated description of all economic activity within the economic territory of the UK, including activity involving both domestic units (that is, individuals and institutions resident in the UK) and external units (those resident in other countries). In addition to being comprehensive, the accounts are fully integrated and internally consistent. More information can be found in the UK National Accounts: a short guide.
Back to table of contents