Table of contents
- Main points
- The treatment of pensions in public sector finances
- How early estimates of net borrowing are improved over time
- Things you need to know about this release
- In summary
- What’s changed in this release?
- How much is the public sector borrowing?
- How big is public sector debt?
- How much cash does the public sector need to raise?
- How was debt in the latest financial year accumulated?
- How do these figures compare with official forecasts?
- Revisions since previous release
- International comparisons of borrowing and debt
- Background information
- Planned changes for future releases
- Recent events that may impact on public sector finances
- Quality and methodology
1. Main points
Public sector net borrowing (excluding public sector banks) in the latest full financial year (April 2017 to March 2018) was £39.5 billion; that is, £6.2 billion less than in the previous financial year (April 2016 to March 2017) and £5.7 billion less than official (Office for Budget Responsibility) expectations; this is the lowest net borrowing since the financial year ending March 2007.
Public sector net borrowing (excluding public sector banks) in the current financial year-to-date (April 2018 to May 2018) was £11.8 billion; that is, £4.1 billion less than in the same period in 2017; this is the lowest year-to-date (April to May) net borrowing since 2007.
Public sector net borrowing (excluding public sector banks) decreased by £2.0 billion to £5.0 billion in May 2018, compared with May 2017; this is the lowest May net borrowing since 2005.
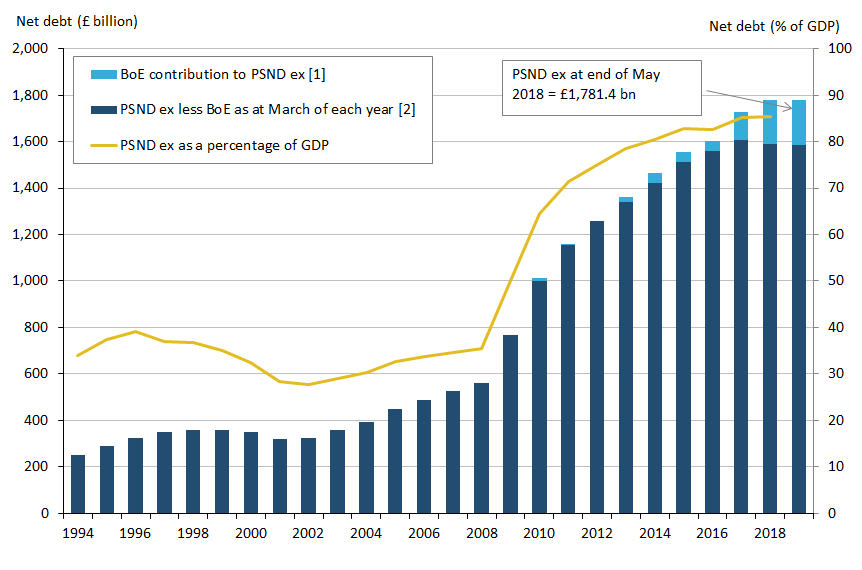
Public sector net debt (excluding public sector banks) was £1,781.4 billion at the end of May 2018, equivalent to 85.0% of gross domestic product (GDP), an increase of £44.7 billion (or a decrease of 0.4 percentage points as a ratio of GDP) on May 2017.
Public sector net debt (excluding both public sector banks and Bank of England) was £1,587.3 billion at the end of May 2018, equivalent to 75.8% of GDP, a decrease of £16.9 billion (or a decrease of 3.1 percentage points as a ratio of GDP) on May 2017.
Central government net cash requirement in the current financial year-to-date (April 2018 to May 2018), increased by £6.7 billion, to £1.2 billion from a surplus of £5.6 billion in the same period in 2017; this increase in net cash requirement is due largely to sale of UK Asset Resolution Ltd assets; in April 2017 the government sold £11.8 billion of assets, whereas in May 2018 the government sold only £5.3 billion of assets; £6.5 billion less.
2. The treatment of pensions in public sector finances
On 21 June 2018, we published a technical note and consultation document concerning the treatment of pensions within the public sector finances (PSF). The note explains different options for the presentation of pension statistics in the PSF publications and provides the recommendations made by the expert advisory committee, the Public Sector Finances Technical Advisory Group. The consultation offers an opportunity to provide feedback on these recommendations within the following broad themes:
how the assets and liabilities of the funded public sector pension schemes should be presented
how the balance sheet and transactions of the Pension Protection Fund should be incorporated
how the obligations of the unfunded public sector pension schemes should be presented
This consultation opened on 21 June 2018 and will close on Friday 31 August 2018.
The Pension Protection Fund and public sector pension schemes are discussed further in section 16 of this bulletin.
Back to table of contents3. How early estimates of net borrowing are improved over time
This bulletin presents the third provisional estimates of UK public sector finances for the complete financial year ending March 2018 and the first estimate of May 2018; these are not final figures and will be revised over the coming months as we replace our initial estimates with provisional and then final outturn data.
The data for the latest month of every release contain some forecast data. The initial outturn estimates for the early months of the financial year, particularly April, contain more forecast data than other months, as profiles of tax receipts, along with departmental and local government spending are still provisional. This means that the data for these months are typically more prone to revision than other months and can be subject to sizeable revisions in later months.
Back to table of contents4. Things you need to know about this release
Public sector net borrowing excluding public sector banks (PSNB ex) measures the gap between revenue raised (current receipts) and total spending (current expenditure plus net investment (capital spending less capital receipts)). Public sector net borrowing is often referred to by commentators as “the deficit”.
The public sector net cash requirement (PSNCR) represents the cash needed to be raised from the financial markets over a period of time to finance the government’s activities. This can be close to the deficit for the same period but there are some transactions, for example, loans to the private sector, which need to be financed but do not contribute to the deficit. It is also close but not identical to the changes in the level of net debt between two points in time.
Public sector net debt excluding public sector banks (PSND ex) represents the amount of money the public sector owes to private sector organisations including overseas institutions, largely as a result of issuing gilts and Treasury Bills, less the amount of cash and other short-term assets it holds.
While borrowing (or the deficit) represents the difference between total spending and receipts over a period of time, debt represents the total amount of money owed at a point in time.
The debt has been built up by successive government administrations over many years. When the government borrows (that is, runs a deficit), this normally adds to the debt total. So reducing the deficit is not the same as reducing the debt.
If you’d like to know more about the relationship between debt and deficit, please refer to our article The debt and deficit of the UK public sector explained.
Back to table of contents5. In summary
Borrowing in the latest full financial year (April 2017 to March 2018) was the lowest financial year borrowing for 11 years.
In the latest full financial year, the public sector borrowed £39.5 billion; that is, £6.2 billion less than in the previous financial year (April 2016 to March 2017) and £5.7 billion less than official expectations. Of this borrowing, £40.7 billion was on capital spending (or net investment), such as on infrastructure. The cost of the “day-to-day” activities of the public sector (the current budget deficit) was in surplus by £1.2 billion. This current budget surplus is the first annual surplus since the financial year ending March 2002. However, it must be remembered that this is a provisional estimate and it may be revised as forecasts are replaced by audited data.
Over the next 12 months (April 2018 to March 2019), the Office for Budget Responsibility, which produces the official government forecasts, expects the public sector to borrow £37.1 billion; around one-quarter of what it borrowed in the financial year ending March 2010 (April 2009 to March 2010), at the peak of the financial crisis.
So far in this financial year (April 2018 to May 2018), the public sector borrowed £11.8 billion; that is, £4.1 billion less than in the same period in 2017; again, this represents the lowest year-to-date borrowing since 2007.
Figure 1: Public sector net borrowing (excluding public sector banks)
Cumulative financial year-to-date (April to May 2018) compared with previous full financial years (April to March), UK
Source: Office for National Statistics
Notes:
- OBR forecast for public sector net borrowing excluding public sector banks from March 2018 Economic and Fiscal Outlook (EFO).
Download this chart Figure 1: Public sector net borrowing (excluding public sector banks)
Image .csv .xlsOften commentators abbreviate the official term public sector net borrowing (excluding public sector banks) to simply “the deficit”.
It is important to understand that reducing the deficit is not the same as reducing the debt. The debt has been built up by successive government administrations over many years. When the government borrows (that is, runs a deficit), this normally adds to the debt total.
At the end of May 2018, the amount of money owed by the public sector to the private sector stood at around £1.8 trillion (or £1,781.4 billion), an increase of £44.7 billion on May 2017. This £1.8 trillion equates to 85% of the value of all the goods and services currently produced by the UK economy in a year (or gross domestic product (GDP)).
However, if we were to exclude the impact of the Bank of England’s programme of temporary activities designed to boost the economy from net debt, then this £1.8 trillion reduces by £0.2 trillion to £1.6 trillion (or £1,587 billion) at the end of May 2018, or 76% of GDP; a decrease of £17 billion on May 2017.
Back to table of contents6. What’s changed in this release?
This section presents information on aspects of data or methodology that have been introduced or improved since the publication of the previous bulletin.
UK Asset Resolution Ltd (UKAR) asset sale
On 26 April 2018, the government announced the £5.3 billion sale of Bradford and Bingley (B&B) mortgages to an investor group led by Barclays Bank Plc. This sale will enable the full repayment of the Financial Services Compensation Scheme (FSCS) loan to B&B. This sale was completed in May 2018 and so was recorded within the public sector finances this month.
The proceeds of such sales reduce the central government net cash requirement (CGNCR) and public sector net debt (PSND) by an amount corresponding to the cash raised from the sale, but have no impact on public sector net borrowing.
Central government net cash requirement in the current financial year-to-date (April 2018 to May 2018), increased by £6.7 billion, to £1.2 billion from a surplus of £5.6 billion in the same period in 2017. This increase in net cash requirement is due largely to sale of UKAR assets; in April 2017 the government sold £11.8 billion of assets, whereas in May 2018 the government sold only £5.3 billion of assets; £6.5 billion less.
Public sector current receipts
This month, we have introduced an extended presentation of public sector current receipts in Appendix D to this release. The data in this table are presented on an accrued basis consistent with international reporting standards and do not represent actual cash receipts in a given period.
Eurostat 2017 excessive deficit procedure (EDP) dialogue visit
On 15 June 2018, Eurostat published the findings of their 2017 EDP dialogue visit (PDF, 652KB) with the UK.
The purpose of this visit was to review the data sources and quality framework in place for the compilation of the UK’s EDP submission, as well as to discuss any methodological and classification issues.
In the report Eurostat states that they appreciated the information provided by the UK authorities before and during the EDP standard dialogue visit. Eurostat also thanked the UK authorities for their co-operation during the mission, and considers that the discussions were productive and constructive.
The monthly statistics on the public sector finances: a methodological guide
On 21 June 2018, we published an updated methodological guide providing comprehensive contextual and methodological information concerning the monthly Public sector finances statistical bulletin. The guide sets out the conceptual and fiscal policy context for the bulletin, identifies the main fiscal measures and explains how these are derived and inter-related. Additionally, it details the data sources used to compile the monthly estimates of the fiscal position.
The guide updates and summarises the content of a range of published articles, including the previous version of the PSF methodology guide published in August 2012.
Alignment between public sector finances and national accounts: June 2018
On 29 June 2018, we will publish an article explaining the differences between public sector net borrowing estimates published in the public sector finances and those in the national accounts. The article forms a part of a regular series of articles published annually alongside the Blue Book publication.
Back to table of contents7. How much is the public sector borrowing?
In the financial year-to-date (April to May 2018), the public sector spent more money than it received in taxes and other income. This meant it had to borrow £11.8 billion; that is, £4.1 billion less than the same period in 2017.
Of this £11.8 billion of public sector net borrowing excluding public sector banks (PSNB ex), £8.2 billion related to the cost of the “day-to-day” activities of the public sector (the current budget deficit), while £3.7 billion was capital spending (or net investment), such as on infrastructure.
Figure 2 presents both monthly and cumulative public sector net borrowing (excluding public sector banks) in the current financial year-to-date (April to May 2018) and compares these with the previous financial year.
Figure 2: Public sector net borrowing (excluding public sector banks)
Cumulative financial year-to-date (April to May 2018) compared with the financial year ending March 2018 (April 2017 to March 2018), UK
Source: Office for National Statistics
Download this chart Figure 2: Public sector net borrowing (excluding public sector banks)
Image .csv .xlsThe difference between central government's income and spending makes the largest contribution to the amount borrowed by the public sector. In the latest financial year-to-date (April to May 2018), of the £11.8 billion borrowed by the public sector, £13.8 billion was borrowed by central government, while local government borrowing was in surplus by £3.1 billion.
In the latest financial year-to-date, central government received £112.9 billion in income, including £82.6 billion in taxes. This was around 3% more than in the same period in 2017.
Over the same period, central government spent £123.6 billion, roughly equal to that spent in the same period in 2017. Of this amount, just below two-thirds was spent by central government departments (such as health, education and defence), around one-third on social benefits (such as pensions, unemployment payments, Child Benefit and Maternity Pay), with the remaining being spent on capital investment and interest on government’s outstanding debt.
Appendix D to this release contains a detailed breakdown of public sector current receipts.
Figure 3 summarises public sector borrowing by sub-sector in the current financial year-to-date (April to May 2018) and compares these with the same period in the previous financial year.
This presentation splits PSNB ex into each of its four sub-sectors: central government, local government, public corporations and Bank of England.
A further breakdown (receipts, expenditure (both current and capital) and depreciation) is provided for central government, local government and public corporations, with central government current receipts and current expenditure being presented in further detail.
Figure 3: Contributions to public sector net borrowing (excluding public sector banks) by sub-sector
Current financial year-to-date (April to May 2018), UK

Source: Office for National Statistics
Notes:
PSNBex – Public sector net borrowing excluding public sector banks.
CGNB – Central government net borrowing.
LGNB – Local government net borrowing.
PCNB Non-financial public corporations net borrowing.
BoENB – Bank of England net borrowing.
L&P – Land and property.
I & W – Income and wealth.
Contributions to EU – UK VAT, GNI and abatement contributions to the EU budget.
NICs – National Insurance contributions.
Download this image Figure 3: Contributions to public sector net borrowing (excluding public sector banks) by sub-sector
.png (117.7 kB) .xls (87.6 kB)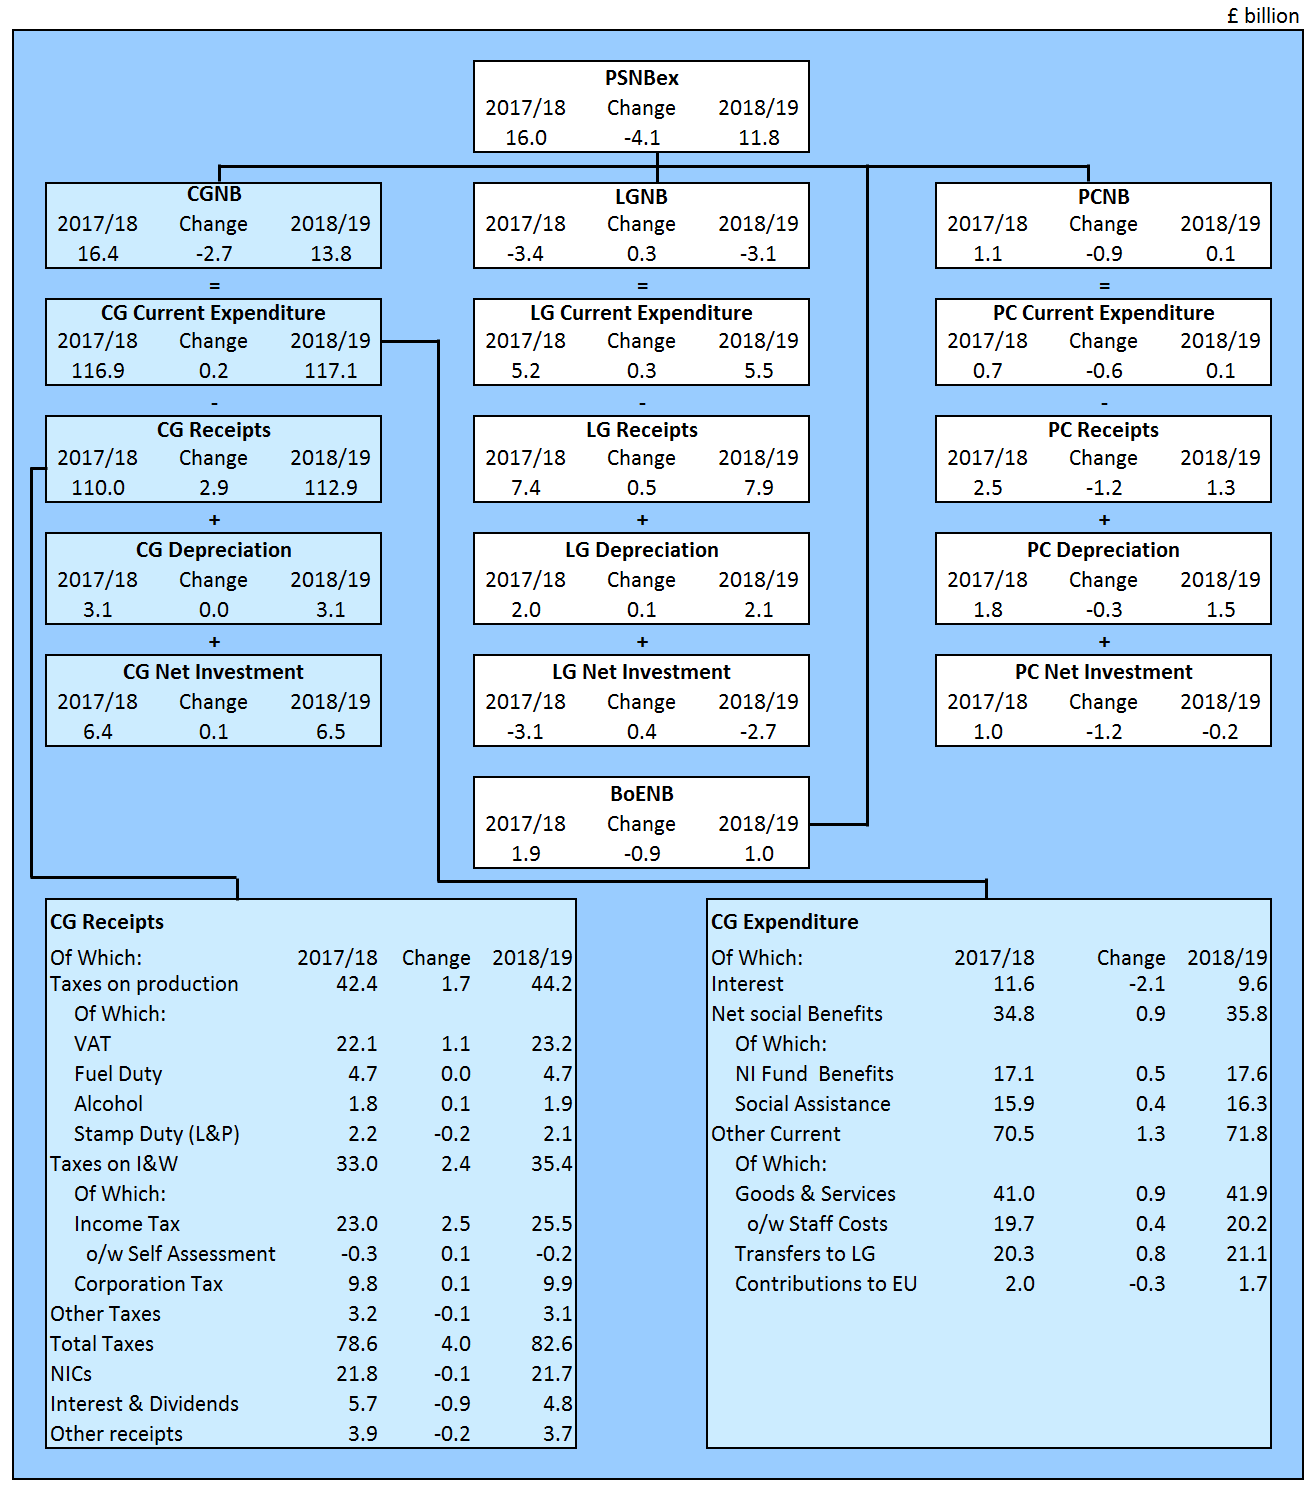
Figure 4 illustrates that annual borrowing has been falling generally since the peak in the financial year ending March 2010 (April 2009 to March 2010).
In the latest full financial year (April 2017 to March 2018), the £39.5 billion (or 1.9% of GDP)) borrowed by the public sector was around one-quarter of PSNB ex in the financial year ending March 2010, when borrowing was £153.1 billion (or 9.9% of GDP).
Figure 4: Public sector net borrowing (excluding public sector banks)
April 1993 to May 2018, UK

Source: Office for National Statistics
Notes:
Financial year 2017/18 represents the financial year ending 2018 (April 2017 to March 2018).
Office for Budget Responsibility (OBR) full financial year forecast of £37.1 billion for public sector net borrowing excluding public sector banks (March 2018 Economic and Fiscal Outlook).
Ytd equals year-to-date (April to May).
Download this image Figure 4: Public sector net borrowing (excluding public sector banks)
.png (42.7 kB) .xls (85.5 kB)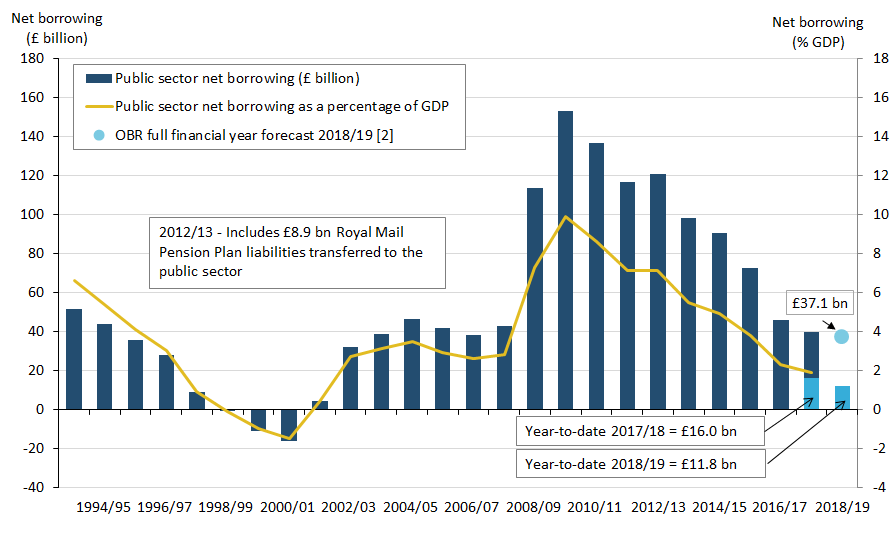
The data for the latest month of every release contain some forecast data. The initial outturn estimates for the early months of the financial year, particularly April, contain more forecast data than other months, as profiles of tax receipts, along with departmental and local government spending are still provisional. This means that the data for these months are typically more prone to revision than other months and can be subject to sizeable revisions in later months.
Since the first estimate of PSNB ex for the financial year ending March 2018 (April 2017 to March 2018) was published on 24 April 2018, the estimate has been revised downward by £3.1 billion, from £42.6 billion to £39.5 billion. At this stage, none of the data underlying the estimates of borrowing in the latest full financial year are audited.
Currently, for the financial year ending March 2018:
central government net borrowing comprises largely provisional data supplied by departments
local government net borrowing is based on budget (forecast) data provided by Ministry of Housing, Communities and Local Government (MHCLG) and the devolved administrations, updated where appropriate with in-year quarterly data published by MHCLG
public corporations’ net borrowing is based on Office for National Statistics (ONS) forecasts based on published Office for Budget Responsibility (OBR) data
Currently, for the financial year ending March 2017:
central government net borrowing comprises largely audited account data
local government data are mainly based on final outturn figures published by MHCLG and the devolved administrations
public corporations’ net borrowing is based on provisional returns from HM Treasury Whole of Government Accounts for the financial year ending March 2017, final outturn figures published by MHCLG, published accounts for individual public corporations and OBR forecasts
Appendix F shows revisions to the first reported estimate of financial-year-end public sector net borrowing (excluding public sector banks) by sub-sector. It summarises revisions to the first estimate of public sector net borrowing (excluding public sector banks) by sub-sector for the last six financial years. Revisions are shown at 6 and 12 months after year-end.
We have published an article, Public Sector Finances – Sources summary and their timing (PDF, 23KB), which provides a brief summary of the different sources used and the implications of using those data in the monthly Public sector finances (PSF) statistical bulletin.
Focusing on the latest month
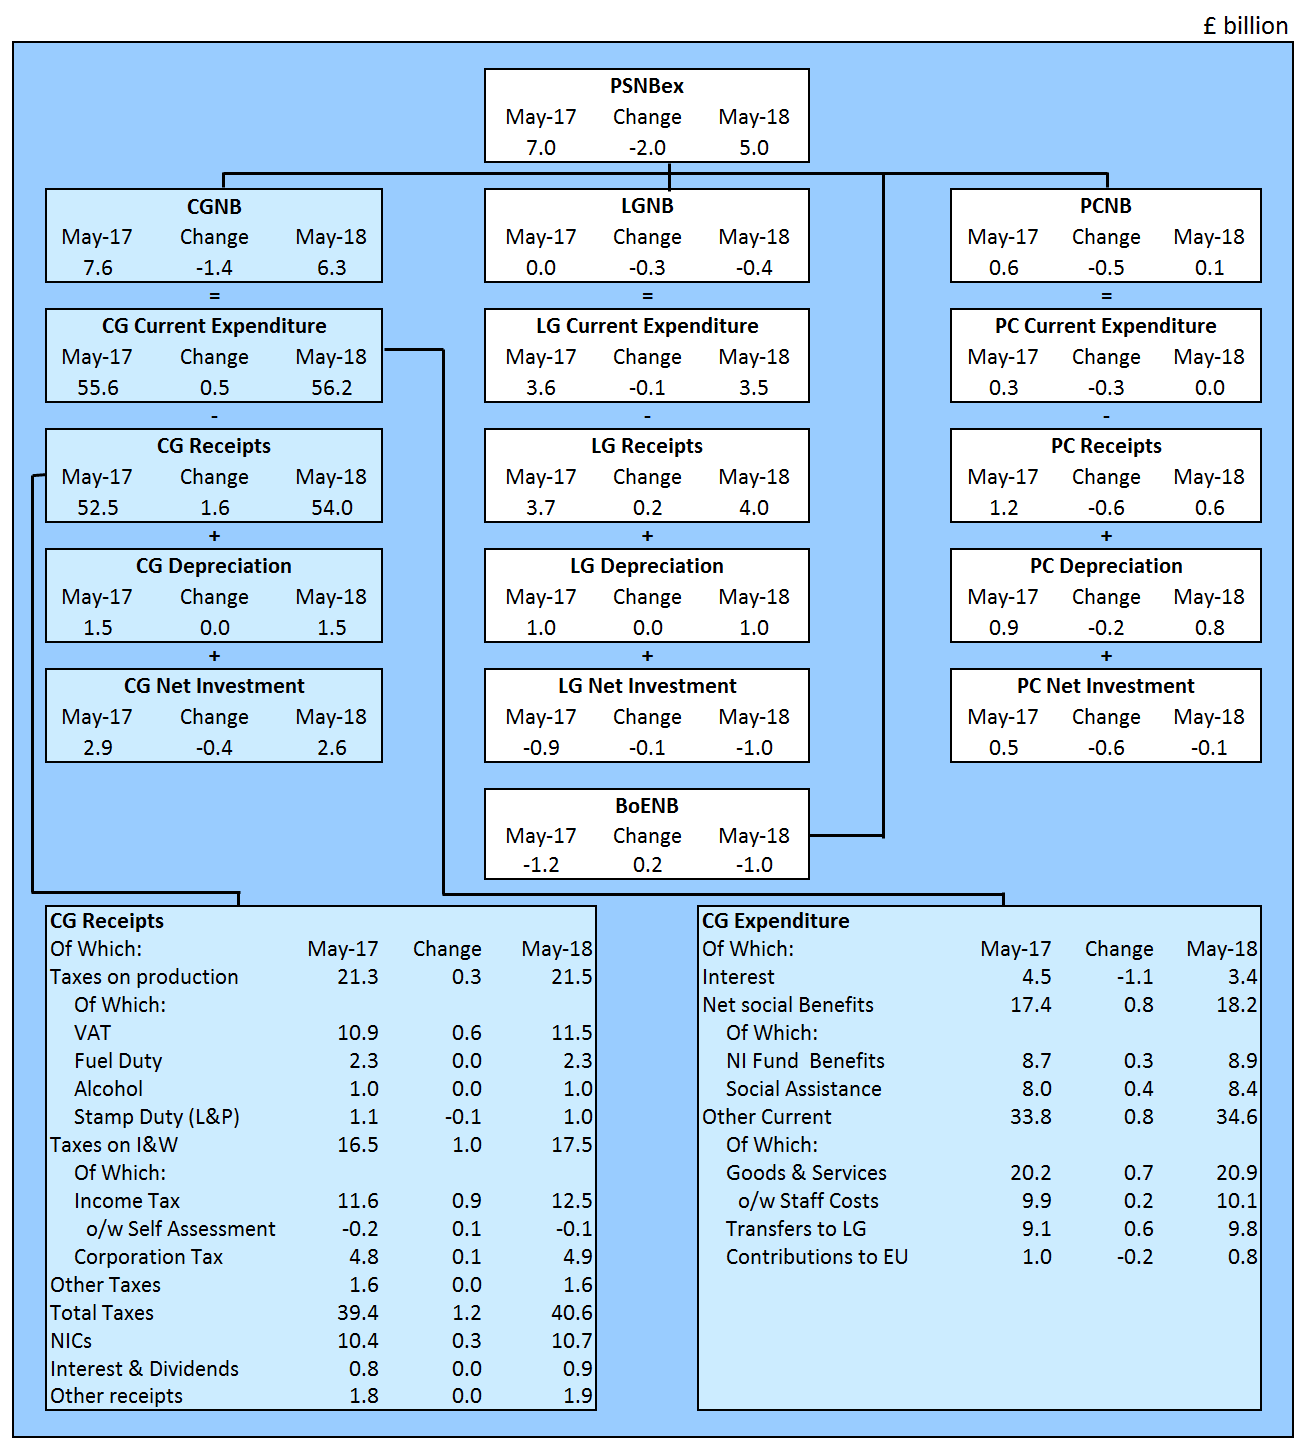
In May 2018, the public sector spent more money than it received in taxes and other income. This meant it had to borrow £5.0 billion; £2.0 billion less than in May 2017.
Figure 5 summarises public sector borrowing by sub-sector in May 2018 and compares this with the equivalent measures in the same month a year earlier (May 2017).
This presentation splits public sector net borrowing excluding public sector banks (PSNB ex) into each of its four sub-sectors: central government, local government, public corporations and Bank of England.
A further breakdown (receipts, current expenditure, capital expenditure and depreciation) is provided for central government, local government and public corporations. Central government current receipts and current expenditure are presented in further detail.
Both local government and public corporations data for May 2018 are initial estimates. Most of these components are calculated by ONS based on OBR forecasts, with additional administrative source data used to estimate transfers to each of these sectors from central government.
Figure 5: Contributions to public sector net borrowing (excluding public sector banks) by sub-sector
May 2018, compared with May 2017, UK
Source: Office for National Statistics
Notes:
PSNBex – Public sector net borrowing excluding public sector banks.
CGNB – Central government net borrowing.
LGNB – Local government net borrowing.
PCNB Non-financial public corporations net borrowing.
BoENB – Bank of England net borrowing.
L&P – Land and property.
I & W – Income and wealth.
Contributions to EU – UK VAT, GNI and abatement contributions to the EU budget.
NICs – National Insurance contributions.
Download this image Figure 5: Contributions to public sector net borrowing (excluding public sector banks) by sub-sector
.png (111.5 kB) .xls (87.6 kB)
8. How big is public sector debt?
At the end of May 2018, the amount of money owed by the public sector to the private sector stood at around £1.8 trillion, which equates to 85.0% of the value of all the goods and services currently produced by the UK economy in a year (or gross domestic product (GDP)).
This £1.8 trillion (or £1,781.4 billion) debt at the end of May 2018 represents an increase of £44.7 billion since the end of May 2017.
The introduction of the Term Funding Scheme (TFS) in September 2016 led to an increase in net debt, as the loans provided under the scheme are not liquid assets and therefore do not net off in public sector net debt (against the liabilities incurred in providing the loans).
Since May 2017, the net debt associated with Bank of England (BoE) increased by £61.6 billion to £194.1 billion. Nearly all of this growth was due to the activities of the Asset Purchase Facility, which includes £63.3 billion from the TFS.
The TFS closed for drawdowns of further loans on 28 February 2018 with a loan liability of £127.0 billion. This month we report a fall in the liability of £0.4 billion to £126.6 billion.
If we were to exclude the activities of the BoE in the estimation of public sector net debt (excluding public sector banks), then public sector net debt (excluding both public sector banks and BoE) would reduce by £194.1 billion, from £1,781.4 billion to £1,587.3 billion, or from 85.0% of GDP to 75.8%.
Figure 6 breaks down outstanding public sector net debt at the end of May 2018 into the sub-sectors of the public sector. In addition to public sector net debt excluding public sector banks (PSND ex), this presentation includes the effect of public sector banks on debt.
Figure 6: Contributions to public sector net debt by sub-sector at the end of May 2018, UK
Source: Office for National Statistics
Notes:
PSND – Public sector net debt.
PSBsND – Public sector Banks net debt.
PSNDex – Public sector net debt excluding public sector banks.
BoEND – Bank of England's contribution to net debt.
PSND ex less BoE – Public sector net debt excluding both public sector banks and Bank of England.
NFPCND – Non-financial public corporations' net debt.
GGND – General government net debt.
Download this chart Figure 6: Contributions to public sector net debt by sub-sector at the end of May 2018, UK
Image .csv .xlsNet debt is defined as total gross financial liabilities less liquid financial assets, where liquid assets are cash and short-term assets, which can be released for cash at short notice without significant loss. These liquid assets comprise mainly of foreign exchange reserves and bank deposits.
Figure 7 presents public sector net debt excluding public sector banks (PSND ex) at the end of May 2018 by sub-sector. Time series for each of these component series are presented in Tables PSA8A to D in the Public sector finances Tables 1 to 10: Appendix A dataset.
Figure 7: Contributions to public sector net debt (excluding public sector banks) by sub-sector at the end of May 2018, UK

Source: Office for National Statistics
Notes:
Cross-holdings between sub-sectors are removed in calculating public sector net debt, gross debt and liquid assets.
APF – Bank of England Asset Purchase Facility.
Download this image Figure 7: Contributions to public sector net debt (excluding public sector banks) by sub-sector at the end of May 2018, UK
.png (83.1 kB) .xls (184.3 kB)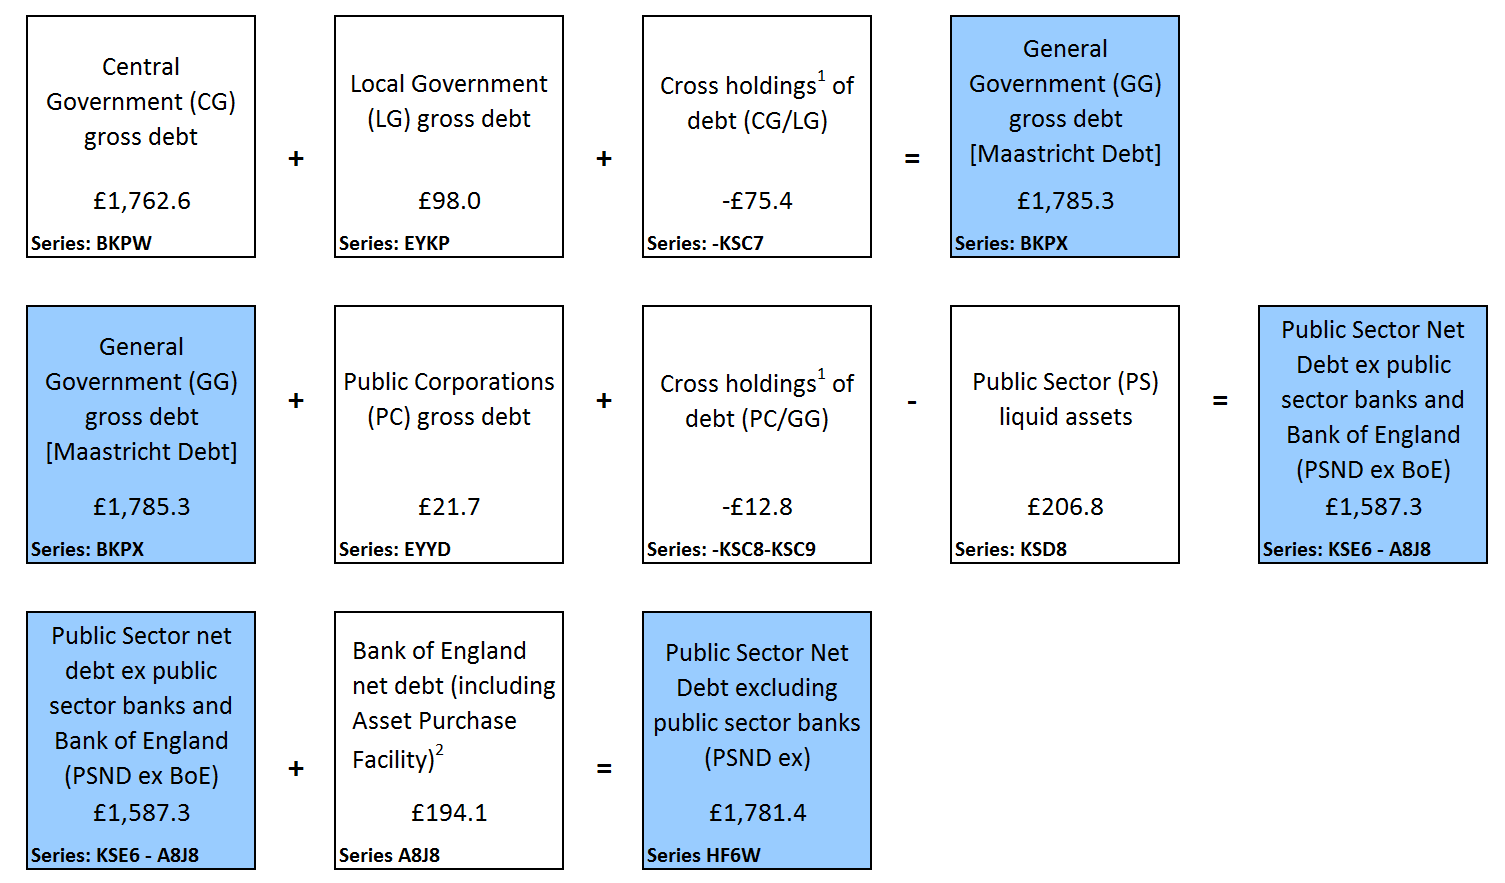
Figure 8 illustrates PSND ex from the financial year ending May 1994 to the end of May 2018, highlighting the BoE contribution to net debt; due largely to its quantitative easing measures, through the activities of the Asset Purchase Facility (including the Term Funding Scheme).
Figure 8: Pulic sector net debt (excluding public sector banks)
March 1994 to the end of May 2018, UK
Source: Office for National Statistics
Notes:
Includes Asset Purchase Facility (APF), which includes the Term Funding Scheme (TFS).
Public sector net debt excluding public sector banks (PSND ex) is the combination of PSND ex Bank of England (BoE) plus BoE contribution to PSND ex.
Download this image Figure 8: Pulic sector net debt (excluding public sector banks)
.png (42.6 kB) .xls (67.1 kB)
9. How much cash does the public sector need to raise?
The net cash requirement is a measure of how much cash the public sector needs to raise from the financial markets (or pay out from its cash reserves) to finance its activities. This amount can be close to net borrowing for the same period but there are some transactions, for example, lending to the private sector or the purchase of shares, that need to be financed but do not contribute to net borrowing. Similarly, repayments of principal on loans extended by government or sales of shares will reduce the level of financing necessary but not reduce the net borrowing.
Figure 9 presents public sector cash requirement by sub-sector in the current financial year-to-date (April to May 2018). Time series for each of these component series are presented in Table PSA7A in the Public sector finances Tables 1 to 10: Appendix A dataset.
Figure 9: Contributions to public sector net cash requirement (excluding public sector banks) by sub-sector
Current financial year-to-date (April to May 2018), UK

Source: Office for National Statistics
Notes:
Effects of cash transactions between sub-sectors are removed in calculating public sector total net cash requirement (and consolidated expenditure and income totals).
APF – Bank of England Asset Purchase Facility.
Download this image Figure 9: Contributions to public sector net cash requirement (excluding public sector banks) by sub-sector
.png (50.4 kB) .xls (170.5 kB)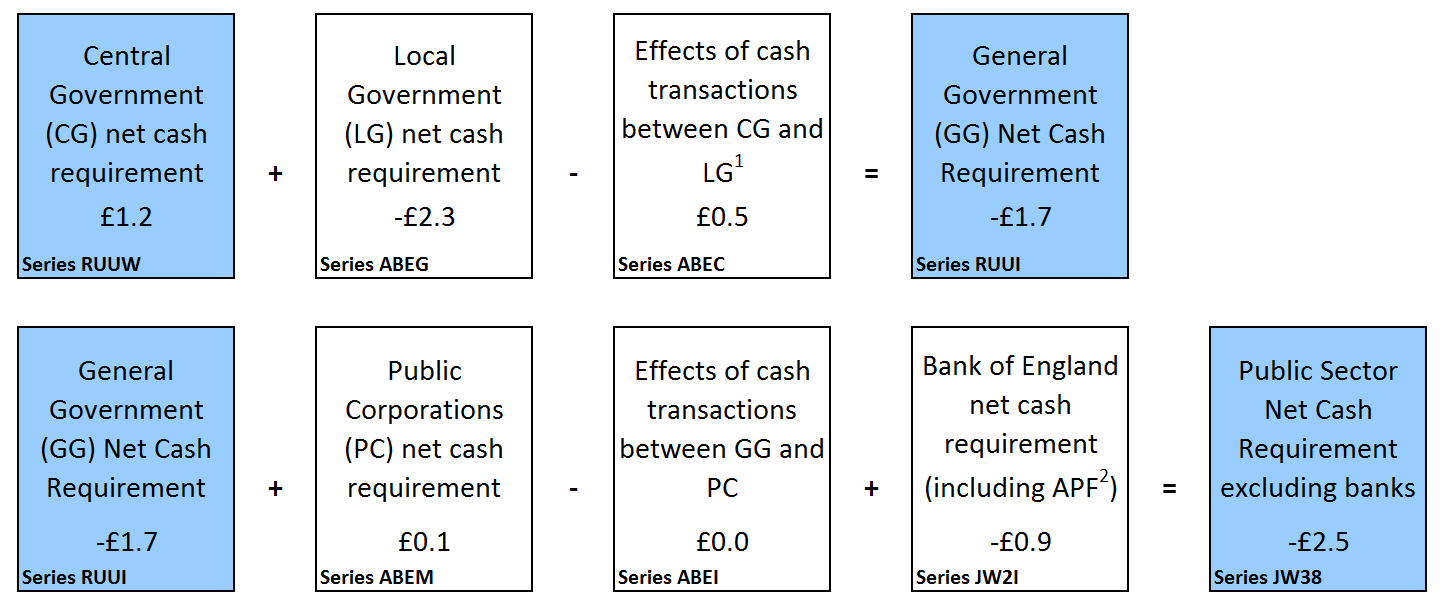
Central government net cash requirement (CGNCR) is a focus for some users, as it provides an indication of the volume of gilts (government bonds) the Debt Management Office may issue to meet the government’s borrowing requirements.
In the current financial year-to-date (April to May 2018), CGNCR was £1.2 billion, that is, £6.7 billion more than in the previous year, where there was a surplus of £5.6 billion.
This increase in net cash requirement is due largely to sale of UK Asset Resolution Ltd (UKAR) assets; in April 2017 the government sold £11.8 billion of assets, whereas in May 2018 the government sold only £5.3 billion of assets; £6.5 billion less.
CGNCR is quoted both including and excluding the net cash requirement of Network Rail (NR) and UKAR, which manages the closed mortgage books of both Bradford and Bingley, and Northern Rock Asset Management). It is the CGNCR excluding NR and UKAR that is the particular focus of users with an interest in the gilt market.
CGNCR excluding NR and UKAR increased by £6.3 billion to £0.8 billion in the current financial year-to-date (April to May 2018), from a surplus of £5.4 billion in the previous year.
Back to table of contents10. How was debt in the latest financial year accumulated?
Figure 10 brings together the borrowing components detailed in Figure 3 to illustrate how the differences between income and spending (both current and capital) have led to the accumulation of debt in the current financial year-to-date (April to May 2018).
This presentation excludes public sector banks, focusing instead on the public sector net borrowing excluding public sector banks (PSNB ex) measure.
The reconciliation between public sector net borrowing and net cash requirement is presented in more detail in Table REC1 in the Public sector finances Tables 1 to 10: Appendix A dataset.
Figure 10: Components of net debt
How the difference in expenditure and receipts affect public sector net debt (excluding public sector banks), UK

Source: Office for National Statistics
Notes:
Cash transactions in (non-financing) financial assets, which do not impact on net borrowing.
Timing differences between cash and accrued data.
Revaluation of foreign currency debt (for example, foreign currency). Debt issuances or redemptions above or below debt valuation (for example, bond premia and discounts and capital uplifts). Changes in volume of debt not due to transactions (for example, sector reclassification).
Download this image Figure 10: Components of net debt
.png (133.7 kB) .xls (60.4 kB)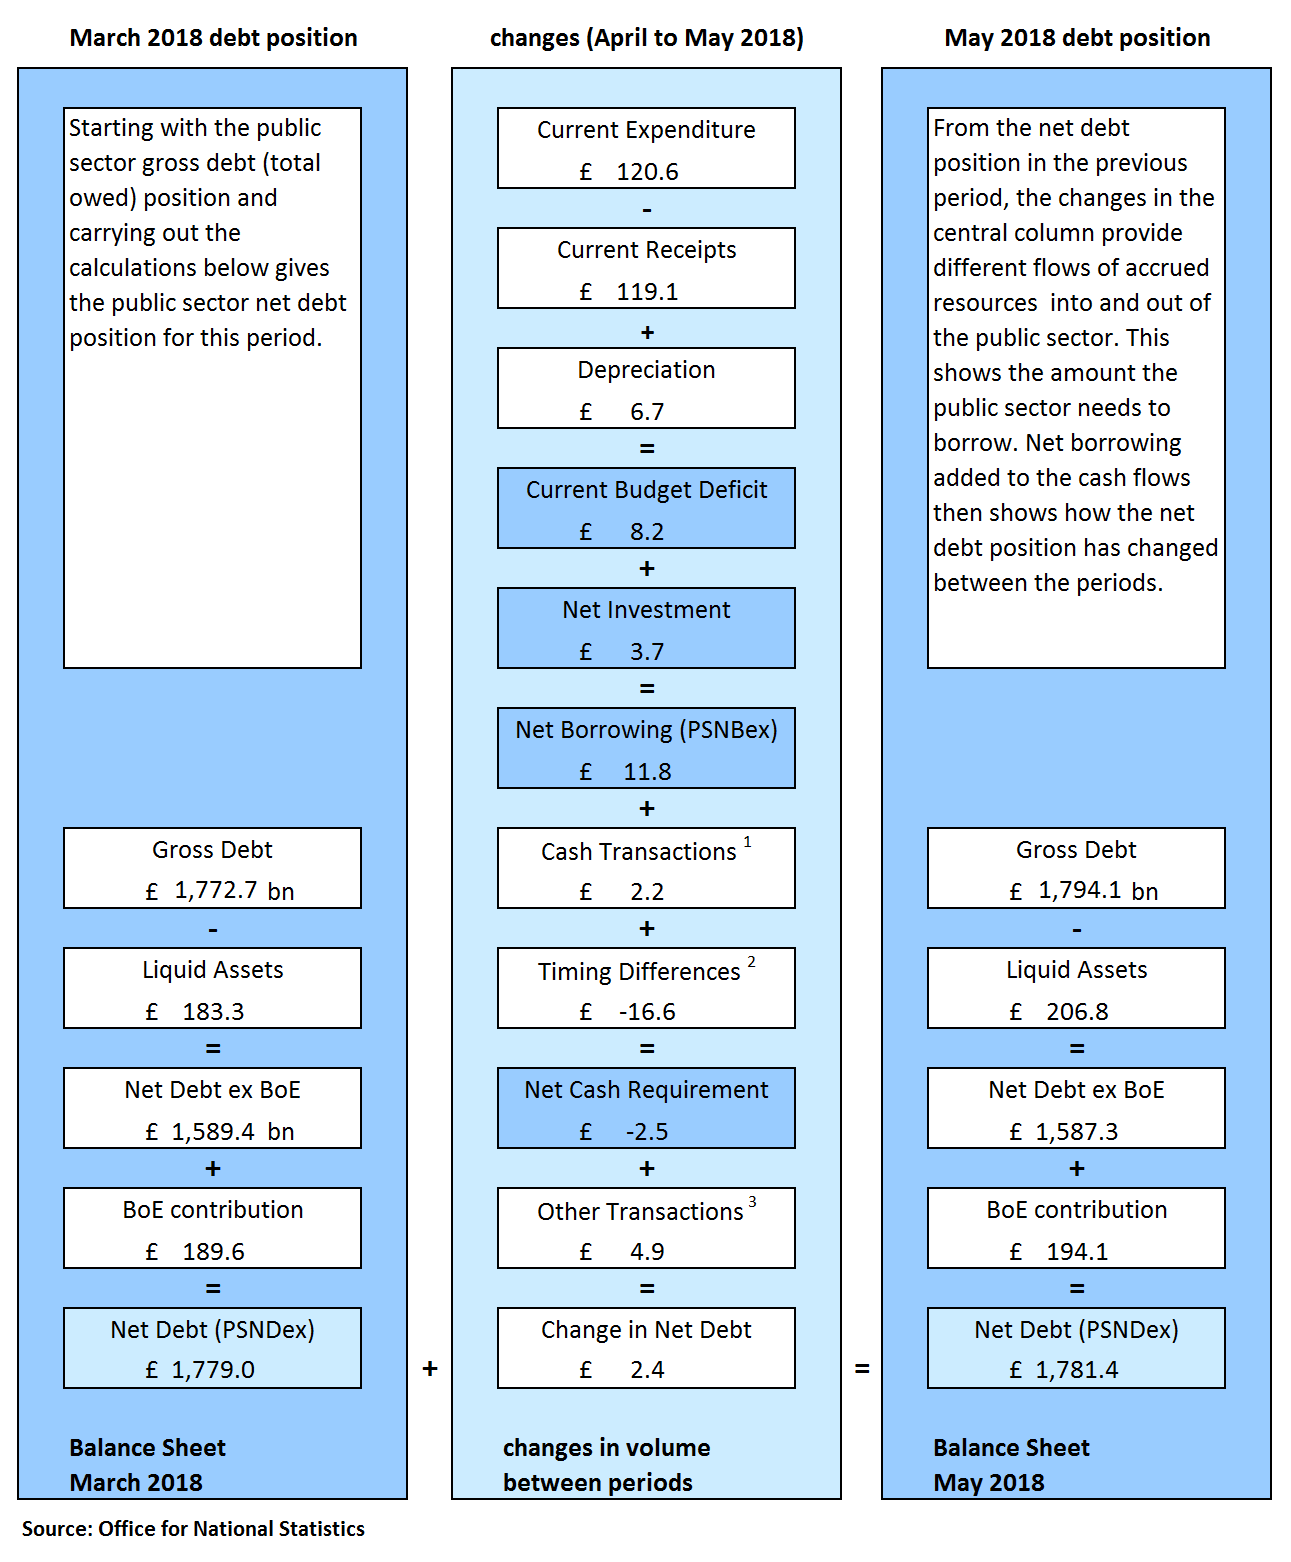
11. How do these figures compare with official forecasts?
The Office for Budget Responsibility (OBR) normally produces forecasts of the public finances twice a year (currently in March and November). The government has adopted OBR forecasts as its official forecast.
OBR forecasts used in this bulletin are based on those published on 13 March 2018.
Public sector net borrowing (excluding public sector banks) in the financial year ending March 2018 was £39.5 billion; that is, £6.2 billion less than in the previous financial year (April 2016 to March 2017) and £5.7 billion less than the £45.2 billion forecast by OBR. However, this £39.5 billion represents our third estimate and will be revised over the coming months as we replace our initial estimates with provisional and then final outturn data.
Over the financial year ending March 2019, OBR expects the public sector to borrow £37.1 billion; around one-quarter of what it borrowed between March 2009 and April 2010, at the peak of the financial crisis.
Figure 11 presents the cumulative public sector net borrowing for the latest full financial year. The figure also presents the OBR forecasts for the current financial year (April 2018 to March 2019), as well as the cumulative borrowing in the current financial year-to-date (April to May 2018).
The monthly path of spending and receipts is not smooth within the financial year and also can vary compared with previous years, both of which can affect year-on-year comparisons.
Figure 11: Public sector net borrowing (excluding public sector banks)
Cumulative financial year-to-date (April to May 2018) compared with the financial year ending March 2018 (April 2017 to March 2018), UK
Source: Office for National Statistics
Notes:
For the financial year ending 2018 (April 2017 to March 2018).
For the financial year-to-date ending 2019 (April to May 2018).
OBR forecast for public sector net borrowing excluding public sector banks from March 2018 Economic and Fiscal Outlook (EFO).
Download this chart Figure 11: Public sector net borrowing (excluding public sector banks)
Image .csv .xlsTable 1 compares the current outturn estimates for each of our main public sector (excluding public sector banks) aggregates for the latest full financial year with corresponding OBR forecasts for the following financial year. Further, it compares the current financial year-to-date (April to May 2018) outturn estimates with those of the previous financial year.
Caution should be taken when comparing public sector finances data with OBR figures for the full financial year, as data are not finalised until sometime after the financial year ends, with initial estimates made soon after the end of the financial year often subject to sizeable revisions in later months as forecasts are replaced with audited outturn data.
There may also be known methodological differences between OBR forecasts and outturn data.
Table 1: Latest outturn estimates compared with Office for Budget Responsibility forecasts
| Office for Budget Responsibility (OBR) forecasts in the current financial year-to-date (April to May 2018) compared with the latest full financial year (April 2017 to March 2018), UK | |||||||
|---|---|---|---|---|---|---|---|
| Excluding public sector banks | £ billion1 (not seasonally adjusted) | ||||||
| Financial year-to-date7 | Full financial year8 | ||||||
| 2017/18 | 2018/19 | % change | 2017/18 outturn | 2018/19 OBR forecast9 | % change | ||
| Current budget deficit2 | 11.6 | 8.2 | -29.5 | -1.2 | -1.9 | 59.1 | |
| Net investment3 | 4.4 | 3.7 | -15.9 | 40.7 | 39.0 | -4.3 | |
| Net borrowing 4 | 16.0 | 11.8 | -25.8 | 39.5 | 37.1 | -6.2 | |
| Net debt 5 | 1,736.7 | 1,781.4 | 2.6 | 1,779.0 | 1835.0 | 3.1 | |
| Net debt as a percentage of GDP6 | 85.4 | 85.0 | NA | 85.4 | 85.5 | NA | |
| Source: Office for National Statistics | |||||||
| Notes: | |||||||
| 1. Unless otherwise stated. | |||||||
| 2. Current budget deficit is the difference between current expenditure (including depreciation) and current receipts. | |||||||
| 3. Net investment is gross investment (net capital formation plus net capital transfers) less depreciation. | |||||||
| 4. Net borrowing is current budget deficit plus net investment. | |||||||
| 5. Net debt is financial liabilities (for loans, deposits, currency and debt securities) less liquid assets. | |||||||
| 6. GDP at current market price. | |||||||
| 7. Financial year-to-date refers to the period from April to May. | |||||||
| 8. 2018/19 refers to financial year ending in March 2019 and 2017/18 refers to financial year ending in March 2018. | |||||||
| 9. All OBR figures are from the OBR Economic and Fiscal Outlook published in March 2018. | |||||||
| 10. NA means "not applicable". | |||||||
Download this table Table 1: Latest outturn estimates compared with Office for Budget Responsibility forecasts
.xls (51.2 kB)12. Revisions since previous release
Revisions can be the result of both updated data sources and methodology changes. This month, the reported revisions are as a result of updated data sources only.
It is important to note that revisions do not occur as a result of errors; errors lead to corrections and are identified as such when they occur. This month we have no errors to report.
As part of UK National Accounts, The Blue Book 2018 a number of changes that are already in the public sector finances will now be included in the national accounts.
These changes include the reclassification of devolved housing associations to the public sector, Corporation Tax methodological improvements and the inclusion of funded public sector employment-related pension schemes.
As part of the process of including these in the national accounts, improved data sources have been used and as a result, this month we report revisions to net borrowing back to 1997 in public sector finances.
For example, the impact of the improvement of pensions data on net borrowing ranges between an increase of £0.2 billion and a decrease of £0.2 billion per financial year back to 1997.
Improvements to our Corporation Tax data are largely limited to the financial years ending March 2011 and March 2012, where net borrowing fell by £0.3 billion and increased by £0.3 billion in these respective years.
Table 2 presents the revisions to the headline statistics presented in this bulletin compared with those presented in the previous publication (published on 22 May 2018).
Table 2: Revisions to main aggregates
| Revisions since the previous public sector finances bulletin (published 22 May 2018), UK | |||||||||
|---|---|---|---|---|---|---|---|---|---|
| £ billion1 (not seasonally adjusted) | |||||||||
| Net borrowing | |||||||||
| Period | CG2 | LG3 | NFPCs4 | BoE5 | PSNB ex6 | PSND ex7 | PSND % of GDP | PSNCR ex8 | |
| 1997/98 | 0.1 | 0.0 | 0.0 | 0.0 | 0.2 | 0.0 | 0.0 | 0.0 | |
| 1998/99 | 0.1 | 0.0 | 0.0 | 0.0 | 0.2 | 0.0 | 0.0 | 0.0 | |
| 1999/00 | 0.2 | 0.0 | 0.0 | 0.0 | 0.2 | 0.0 | 0.0 | 0.0 | |
| 2000/01 | 0.2 | 0.0 | 0.0 | 0.0 | 0.2 | 0.0 | 0.0 | 0.0 | |
| 2001/02 | 0.2 | 0.0 | 0.0 | 0.0 | 0.2 | 0.0 | 0.0 | 0.0 | |
| 2002/03 | 0.2 | 0.0 | 0.0 | 0.0 | 0.2 | 0.0 | 0.0 | 0.0 | |
| 2003/04 | 0.1 | 0.0 | 0.0 | 0.0 | 0.1 | 0.0 | 0.0 | 0.0 | |
| 2004/05 | 0.0 | 0.0 | 0.0 | 0.0 | 0.0 | 0.0 | 0.0 | 0.0 | |
| 2005/06 | 0.1 | 0.0 | 0.0 | 0.0 | 0.1 | 0.0 | 0.0 | 0.0 | |
| 2006/07 | 0.1 | 0.0 | 0.0 | 0.0 | 0.1 | 0.0 | 0.0 | 0.0 | |
| 2007/08 | 0.1 | 0.0 | 0.0 | 0.0 | 0.1 | 0.0 | 0.0 | 0.0 | |
| 2008/09 | 0.1 | 0.0 | -0.1 | 0.0 | 0.0 | 0.0 | 0.0 | 0.0 | |
| 2009/10 | 0.1 | 0.0 | 0.0 | 0.0 | 0.1 | 0.0 | 0.0 | 0.0 | |
| 2010/11 | -0.5 | 0.1 | 0.2 | 0.0 | -0.3 | 0.0 | 0.0 | 0.0 | |
| 2011/12 | 0.2 | 0.0 | 0.2 | 0.0 | 0.4 | 0.0 | 0.0 | 0.0 | |
| 2012/13 | -0.2 | 0.0 | 0.1 | 0.0 | -0.1 | 0.0 | 0.0 | 0.0 | |
| 2013/14 | 0.0 | 0.0 | 0.0 | 0.0 | 0.0 | 0.0 | 0.0 | 0.0 | |
| 2014/15 | -0.8 | -0.2 | -0.1 | 0.0 | -1.0 | 0.0 | 0.0 | 0.0 | |
| 2015/16 | -0.1 | -0.3 | -0.2 | 0.0 | -0.6 | 0.0 | 0.0 | 0.0 | |
| 2016/17 | 0.2 | -0.6 | -0.1 | 0.0 | -0.5 | 0.0 | 0.0 | 0.0 | |
| 2017/18 | -0.9 | -0.1 | 0.0 | 0.0 | -1.0 | -0.5 | 0.0 | 0.0 | |
| 2018 April | -1.2 | 0.2 | 0.0 | 0.0 | -1.0 | -0.4 | 0.0 | 0.0 | |
| Source: Office for National Statistics | |||||||||
| Notes: | |||||||||
| 1. Unless otherwise stated. | |||||||||
| 2. Central government. | |||||||||
| 3. Local government. | |||||||||
| 4. Non-financial public corporations. | |||||||||
| 5. Bank of England. | |||||||||
| 6. Public sector net borrowing excluding public sector banks. | |||||||||
| 7. Public sector net debt excluding public sector banks. | |||||||||
| 8. Public sector net cash requirement excluding public sector banks. | |||||||||
| 9. 2017/18 represents financial year ending 2018 (April 2017 to March 2018). | |||||||||
Download this table Table 2: Revisions to main aggregates
.xls (51.7 kB)Revisions to public sector net borrowing excluding public sector banks in the current financial year-to-date (April 2018)
The data for the latest month of every release contain some forecast data. The initial outturn estimates for the early months of the financial year, particularly April, contain more forecast data than other months, as profiles of tax receipts, along with departmental and local government spending are still provisional. This means that the data for these months are typically more prone to revision than other months and can be subject to sizeable revisions in later months.
Public sector net borrowing excluding public sector banks (PSNB ex) in April 2018 has been revised down by £1.0 billion compared with figures presented in the previous bulletin (published on 22 May 2018).
Of this £1.0 billion downward revision to PSNB ex, there was a £1.2 billion reduction in the estimate of central government net borrowing, partially offset by a £0.2 billion increase in the estimation of local government’s contribution to net borrowing.
Figure 12 breaks down this revision to PSNB ex by each of its four sub-sectors: central government, local government, non-financial public corporations and Bank of England (BoE). The diagram also provides a further breakdown of central government current receipts and current expenditure is provided to reflect the significance of these components’ contribution to borrowing at a public sector level.
Central government receipts were revised upwards by £0.8 billion, with increases in previous estimates of Value Added Tax (£0.2 billion), Income Tax (£0.2 billion), Stamp Duty on shares (£0.1 billion) and taxes on alcohol (£0.1 billion). Revisions to tax receipts are not unusual and occur to varying extents each month as (provisional) outturn data replace forecasts.
In the same period, central government current expenditure was revised downwards by £0.4 billion. Net social benefits (including social assistance and public sector pension payments) were revised downwards by £0.3 billion, while estimates of departmental expenditure on goods and services reduced by £0.2 billion. Additionally, there were some smaller revisions across several expenditure components.
Figure 12: Revisions to net borrowing
Latest data covering the month of April 2018, compared with that presented in the previous bulletin (22 May 2018), UK

Source: Office for National Statistics
Notes:
PSNBex – Public sector net borrowing excluding public sector banks.
CGNB – Central government net borrowing.
LGNB – Local government net borrowing.
PCNB Non-financial public corporations net borrowing.
BoENB – Bank of England net borrowing.
L&P – Land and property.
I & W – Income and wealth.
Contributions to EU – UK VAT, GNI and abatement contributions to the EU budget.
NICs – National Insurance contributions.
Download this image Figure 12: Revisions to net borrowing
.png (122.3 kB) .xls (88.1 kB)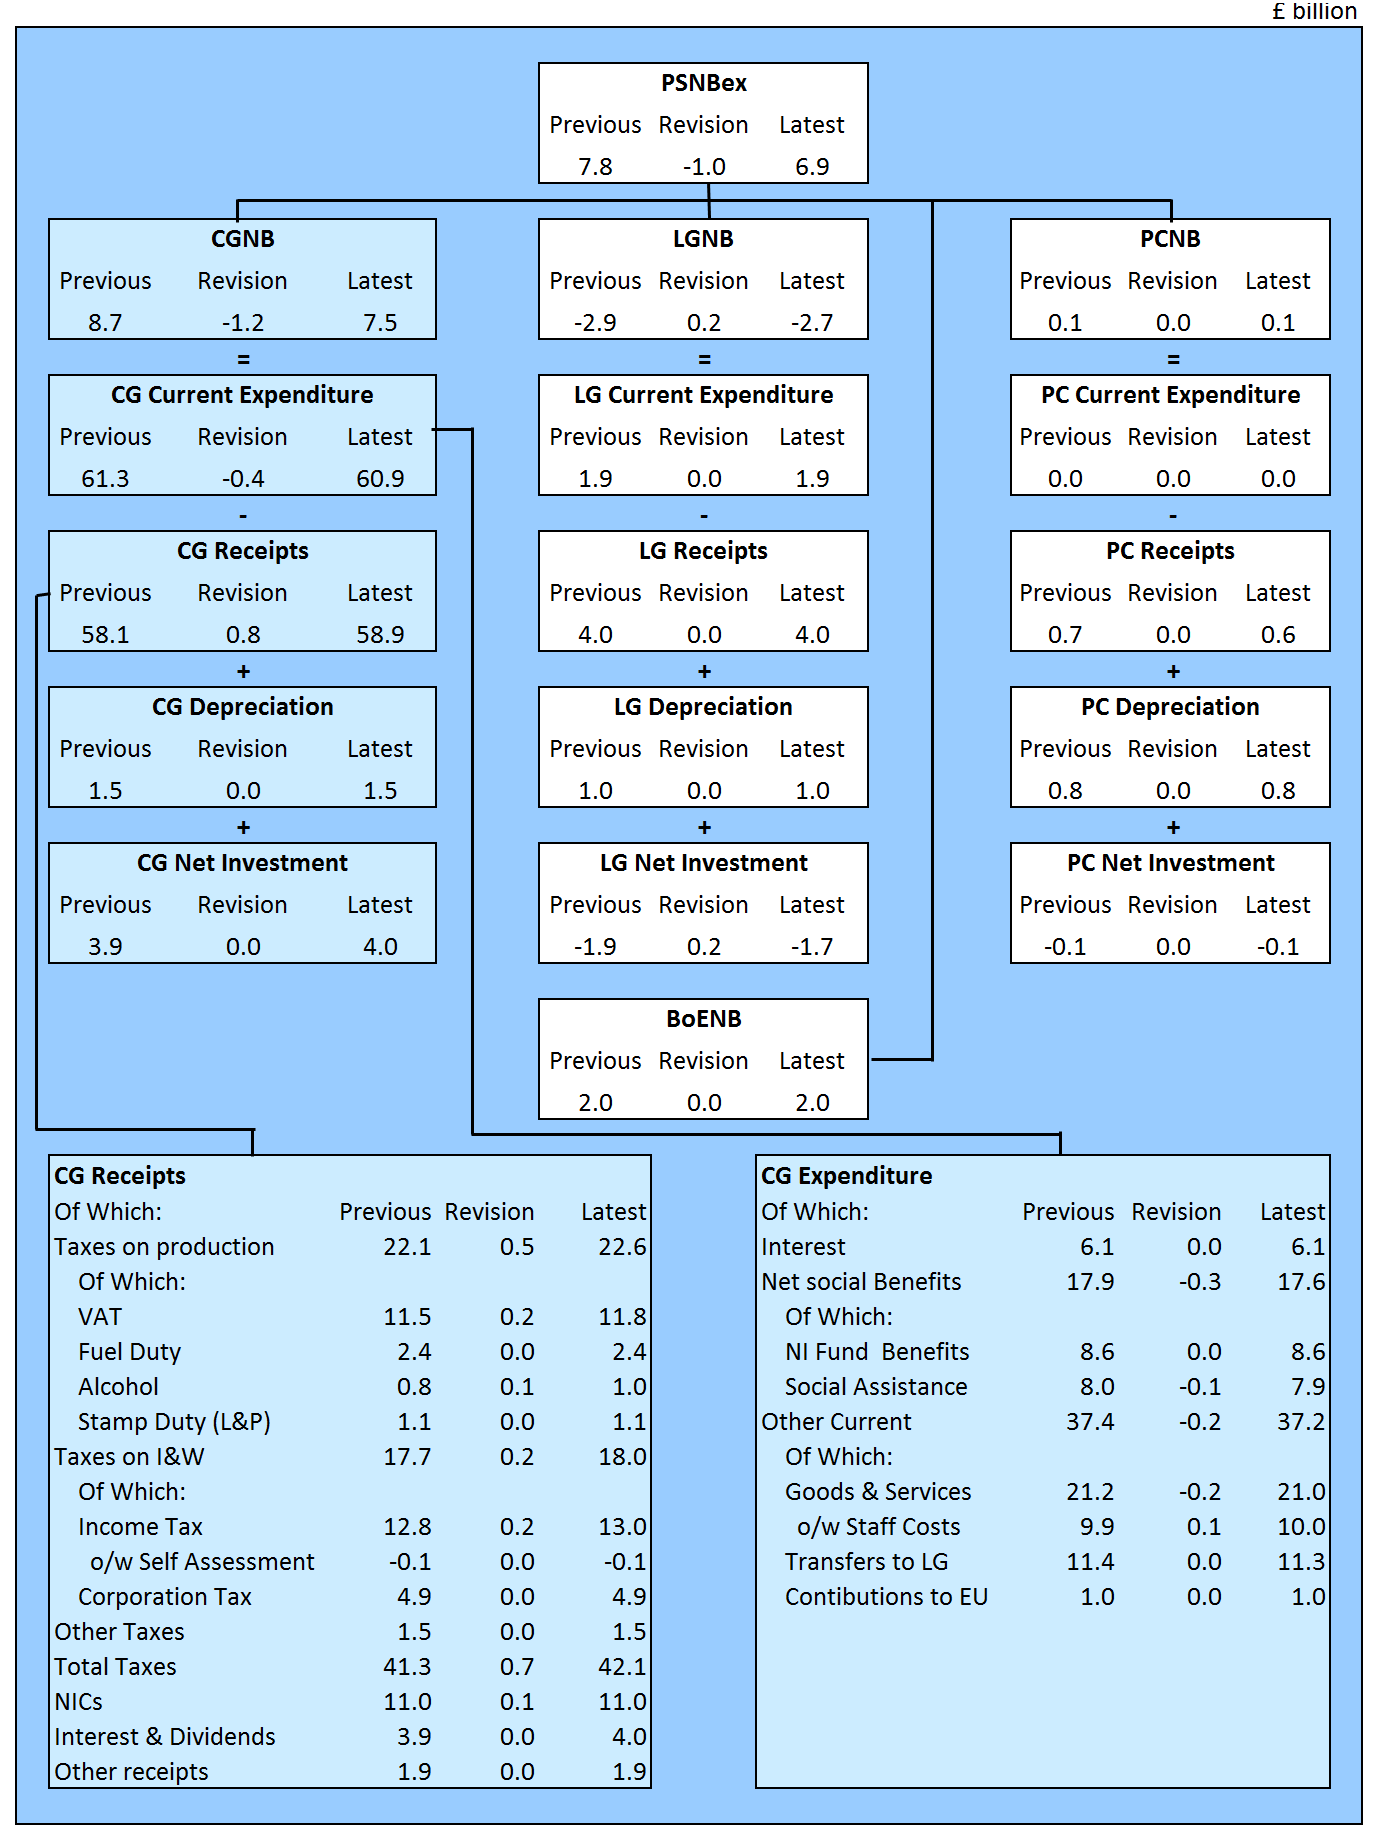
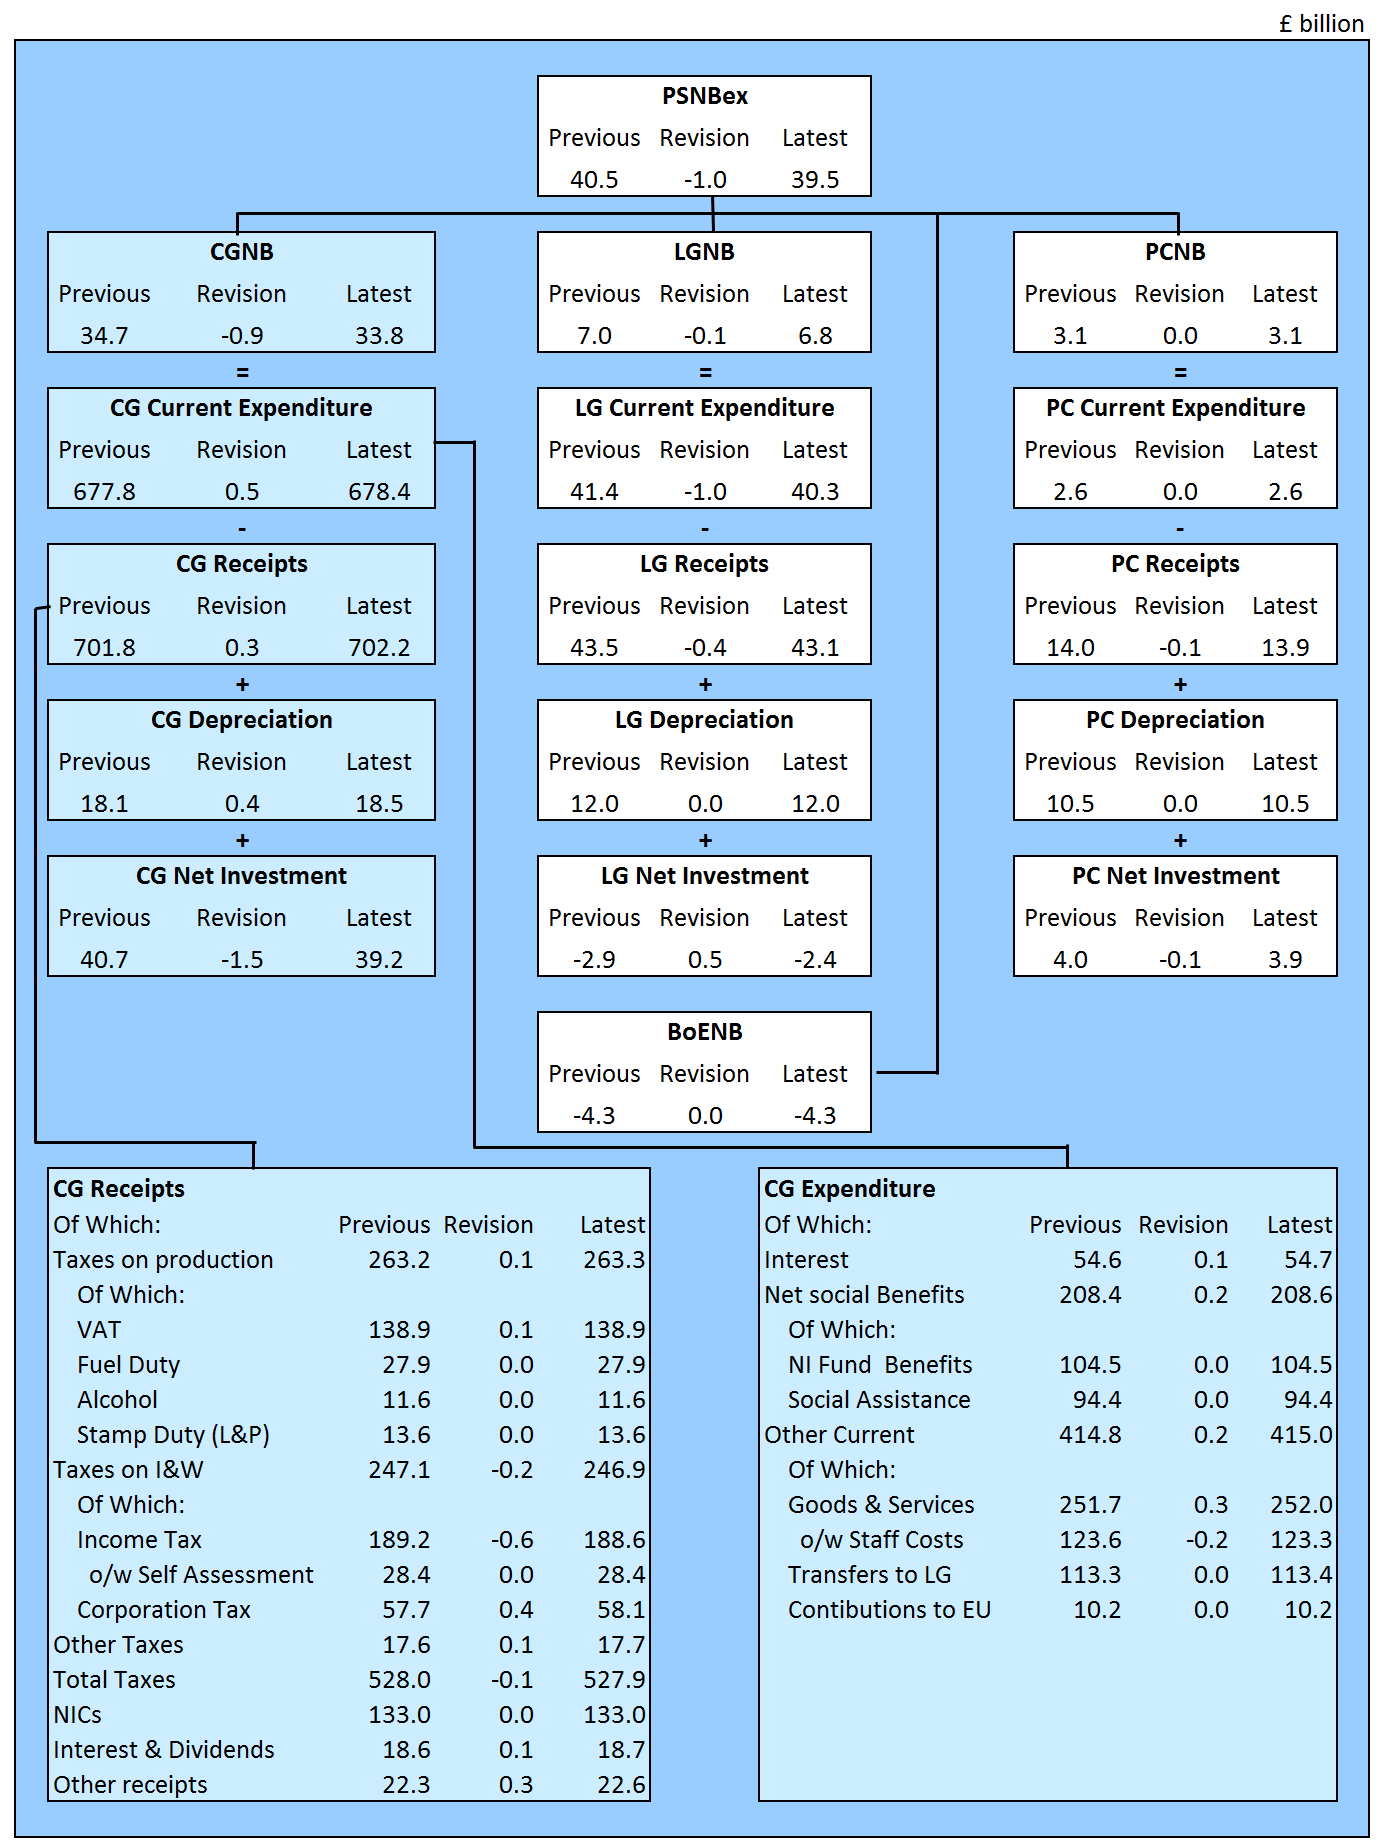
Revisions to public sector net borrowing excluding public sector banks in the latest full financial year (April 2017 to March 2018)
Public sector net borrowing excluding public sector banks (PSNB ex) for the period April 2017 to March 2018 has been revised down by £1.0 billion compared with figures presented in the previous bulletin (published on 22 May 2018).
This £1.0 billion downward revision to PSNB ex, was mainly a result of new data being incorporated into our estimate of central government borrowing, which revised down £0.9 billion since the previous estimate.
Figure 13 breaks down this revision to PSNB ex by each of its four sub-sectors: central government, local government, non-financial public corporations and Bank of England (BoE).
Central government receipts were revised upwards by £0.3 billion. Of this, our estimate of central government gross operating surplus increased by £0.4 billion. Taxes on income and wealth were revised downwards by £0.2 billion, where a reduction of £0.6 billion in Income Tax was offset partially by a £0.4 billion increase in the previous estimate of Corporation Tax. As we’ve previously said, revisions to tax receipts are not unusual and occur to varying extents each month as (provisional) outturn data replace forecasts.
Over the same period, central government current expenditure was revised up by £0.5 billion, while capital expenditure was revised down by £1.5 billion.
Revisions to current expenditure were split evenly across each of the sub-sectors, with estimates of net social benefits and other current expenditure increasing by £0.2 billion and estimates of debt interest increasing by £0.1 billion.
On the capital side, estimates of gross fixed capital formation, depreciation and transfers from other sectors were reduced by £1.2 billion, £0.4 billion and £0.6 billion respectively, while transfers to other sectors increased by £0.6 billion.
Figure 13: Revisions to net borrowing
Latest full financial year (April 2017 to March 2018), compared with that presented in the previous bulletin (22 May 2018), UK
Source: Office for National Statistics
Notes:
PSNBex – Public sector net borrowing excluding public sector banks.
CGNB – Central government net borrowing.
LGNB – Local government net borrowing.
PCNB Non-financial public corporations net borrowing.
BoENB – Bank of England net borrowing.
L&P – Land and property.
I & W – Income and wealth.
Contributions to EU – UK VAT, GNI and abatement contributions to the EU budget.
NICs – National Insurance contributions.
Download this image Figure 13: Revisions to net borrowing
.png (129.6 kB) .xls (88.6 kB)
Revisions to public sector net borrowing excluding public sector banks in earlier financial years
Historical estimates of net borrowing have been revised to varying degrees back to the financial year ending April 1997 due to the inclusion of improved data sourced from the national accounts.
As previously stated, these revisions are due largely to the receipt of improved pension data impacting on both our previous central and local government estimates. In addition, the inclusion of new Corporation Tax data has increased central government receipts for the financial year ending March 2011 by £0.3 billion and conversely reduced receipts by £0.3 billion in the following financial year.
Additionally, we have included improved estimates for housing associations resulting in small revisions to public corporations’ net borrowing of between positive and negative £0.1 billion in each financial year back to the financial year ending March 2008.
Revisions to public sector net debt excluding public sector banks
This month we have reduced our estimate of public sector net debt (excluding public sector banks) (PSND ex) as at the end of April 2018, by £0.4 billion. This was due largely to a £0.3 billion downward revision to the Bank of England’s contribution to net debt, where improved cash data for April 2018 have replaced the previous estimate.
Revisions to public sector net debt including public sector banks
This month we received updated public sector banks’ balance sheet data covering the period July to December 2017. These data have enabled us to update previous estimates of the net cash requirement and net debt associated with public sector banks. Further, estimates covering the period January 2018 to date have been updated to reflect this new information.
As a consequence of receiving these data, our estimate of public sector net cash requirement including public sector banks for the financial year ending March 2018 (April 2017 to March 2018) has been increased by £0.1 billion; while our estimate of public sector net debt including public sector banks at the end of March 2018 has reduced by £0.8 billion.
Back to table of contents13. International comparisons of borrowing and debt
The UK government debt and deficit statistical bulletin is published quarterly (in January, April, July and December each year), to coincide with when the UK and other EU member states are required to report on their deficit (or net borrowing) and debt to the European Commission.
On 17 April 2018, we published UK government debt and deficit: December 2017, consistent with Public sector finances, UK: February 2018 (published on 21 March 2018). In this publication we stated that:
general government gross debt was £1,786.3 billion at the end of December 2017, equivalent to 87.7% of gross domestic product (GDP); 27.7 percentage points above the Maastricht reference value of 60%
general government deficit (or net borrowing) was £39.4 billion in 2017, equivalent to 1.9% of GDP; 1.1 percentage points below the Maastricht reference value of 3%
This bulletin reports a downward revision of £3.2 billion (or 0.1 percentage points) to deficit, while the estimate of general government gross debt has reduced by £0.2 billion compared with that published on 17 April 2018.
Eurostat published their analysis based on the data submitted by each of the 28 European Union (EU) member states on 23 April 2018.
It is important to note that the GDP measure, used as the denominator in the calculation of the debt ratios in the UK government debt and deficit statistical bulletin, differs from that used within the Public sector finances statistical bulletin.
An article, The use of GDP in public sector fiscal ratio statistics, explains that for debt figures reported in the monthly public sector finances, a 12-month GDP total centred on the month is employed, while in the UK government debt and deficit statistical bulletin, the total GDP for the preceding 12 months is used.
Back to table of contents14. Background information
What does the public sector include?
In the UK, the public sector consists of five sub-sectors: central government, local government, public non-financial corporations, Bank of England and public financial corporations (or public sector banks).
Unless otherwise stated, the figures quoted in this bulletin exclude public sector banks (that is, currently only Royal Bank of Scotland (RBS)), as the reported position of debt (and to a lesser extent borrowing) would be distorted by the inclusion of RBS's balance sheet (and transactions). This is because government does not need to borrow to fund the debt of RBS, nor would surpluses achieved by RBS be passed on to government, other than through any dividends paid as a result of government equity holdings.
The sub-sector breakdown of public sector net borrowing is summarised in Table PSA2 in the Public sector finances Tables 1 to 10: Appendix A dataset.
Should I look at monthly or financial year-to-date data to understand public sector finances?
A financial year is an accounting period of 12 months running from 1 April one year to 31 March the following year. For example, the financial year ending March 2016 comprises the months from April 2015 to March 2016.
Due to the volatility of the monthly data, the cumulative financial year-to-date borrowing figures provide a better indication of the position of the public finances than the individual months.
Are our figures adjusted for inflation?
All monetary values in the public sector finances (PSF) bulletin are expressed in terms of “current prices‟, that is, they represent the price in the period to which the expenditure or revenue relates and are not adjusted for inflation.
In order to compare data over long time periods, to aid international comparisons and provide an indication of a country’s ability to service borrowing and debt, commentators often discuss changes over time to fiscal aggregates in terms of gross domestic product (GDP) ratios. GDP represents the value of all the goods and services currently produced by the UK economy in a period of time.
The use of GDP in public sector fiscal ratio statistics
An article, The use of GDP in public sector fiscal ratio statistics, explains that for debt figures reported in the monthly public sector finances, a 12-month GDP total centred on the month is employed, while in the UK government debt and deficit statistical bulletin, the total GDP for the preceding 12 months is used.
As a consequence of using a centred GDP estimate, our estimates include a degree of official forecast data produced by the Office for Budget Responsibility (OBR) and are subject to revision when the OBR updates its estimates (usually in March and November each year).
Figures expressed as a ratio of gross domestic product
At the end of each financial year, while data for current budget deficit, net investment and net borrowing for the final quarter of the financial year (January to March) are available, GDP for the corresponding period is not. To enable us to publish estimates of these figures as ratios of GDP for the latest full financial year, the final quarter of the GDP denominator is estimated based on forecasts produced by the OBR.
This estimate of GDP will be used in the March, April and May publications and revised in the June publication when the published value of GDP becomes available.
Are our figures adjusted for seasonal patterns?
All monetary values in the PSF bulletin are not seasonally adjusted. We recommend you use year-on-year comparisons (be it cumulative financial year-to-date or individual monthly borrowing figures) rather than making month-on-month comparisons.
Are our monthly figures likely to change over time?
Each PSF bulletin contains the first estimate of public sector borrowing for the most recent period and is likely to be revised in later months as more data become available.
In publishing monthly estimates, it is necessary to use a range of different types of data sources. Some of these are subject to revision as budget estimates (forecasts) are replaced by outturn data and these then feed into the published aggregates.
In addition to those that stem from updated data sources, revisions can also result from methodology changes. An example of the latter is the changes that were due to the introduction of improved methodology for the recording of Corporation Tax, Bank Corporation Tax Surcharge receipts and Bank Levy implemented in the PSF estimates released in February 2017.
Appendix F: Revisions to the first reported estimate of financial-year-end public sector net borrowing (excluding public sector banks) by sub-sector; summarises revisions to the first estimate of public sector borrowing (excluding public sector banks) by sub-sector for the last six financial years. Revisions are shown at 6 and 12 months after year end.
We have published an article, Public Sector Finances – Sources summary and their timing (PDF, 22KB), which provides a brief summary of the different sources used and the implications of using those data in the monthly public sector finances (PSF) statistical bulletin.
Why do some of the tax figures quoted by HMRC differ from those presented in this bulletin?
There are a number of differences between the presentation of tax receipts reported by both Office for National Statistics (ONS) and HM Revenue and Customs (HMRC) in their respective publications.
HMRC present their data on a cash basis, while we present the corresponding data on both a cash basis (in the calculation of central government net cash requirement – Table PSA7D) and on a time-adjusted (or accruals) basis (in the calculation of central government net borrowing – Table PSA6B and 6D).
Further, we roll some individual taxes together to form aggregates, where HMRC may not. For example, we present Corporation Tax as an aggregate of Corporation Tax, Bank Surcharge and Diverted Profit Tax, while HMRC present these taxes individually.
The differences between HMRC and ONS’s tax presentation is discussed further in Section 7 of the PSF Quality and Methodology Information (QMI) report, with a focus on the three of the largest tax headings: Value Added Tax (VAT), Corporation Tax and Income Tax.
Back to table of contents15. Planned changes for future releases
This section presents information on aspects of data or methodology that are planned but not yet included in the public sector finances.
Royal Bank of Scotland (RBS) Group plc share sale
On 4 June 2018, UK Government Investments Limited (UKGI) announced the successful completion of the disposal of 7.7% of HM Treasury's shareholding in RBS, with proceeds of £2.5 billion.
As with similar share sales, the proceeds will reduce the central government net cash requirement (CGNCR) and public sector net debt (PSND) by an amount corresponding to the cash raised from the sale, but have no impact on public sector net borrowing.
As a result of this sale, the RBS shareholding of HM Treasury will be reduced from 8,434,483,519 ordinary shares, representing approximately 70.1% of the ordinary share capital of the company, to 7,509,483,519 ordinary shares, representing approximately 62.4% of the ordinary share capital.
Public sector net financial liabilities
When the supplementary fiscal aggregate of public sector net financial liabilities was first introduced in November 2016, we explained that we would work to improve the quality of the underlying data.
To date, the most significant improvement has been to the estimate of the net liability of government in relation to funded public sector pension schemes, which were introduced in the August 2017 bulletin. Our programme of work includes improving holdings of other public sector assets and liabilities; recently further progress has been made in improving loan assets and equity holdings. We will be introducing these over the course of the year, with further improvements being made in the June 2018 bulletin (to be published 20 July 2018).
Ministry of Defence inventories
The Ministry of Defence has been granted a one-off amnesty to remove obsolete items from its balance sheet in the financial year ending March 2018. Latest estimates (PDF, 613KB) suggest that this could result in the writing-off or disposal of up to £0.5 billion worth of obsolete items.
We are working with the Ministry of Defence to source the data we need to ensure that the impacts of this amnesty are fully reflected in the public sector finances.
Back to table of contents16. Recent events that may impact on public sector finances
This section acknowledges recent government announcements that may have future implications on public sector finances.
East Coast Mainline
On 16 May 2018, the government announced that from 24 June 2018, London North Eastern Railway (LNER) will take over the running of East Coast Mainline services. We are currently investigating the implications of this decision and our conclusions will be announced in due course.
Housing associations
In recent weeks, the Regulation of Registered Social Landlords (Wales) Act 2018 has received Royal Assent, while the Housing (Amendment) (Scotland) Bill has passed Stage 3 of the Scottish Parliament. As such, ONS is likely to review the classification status of registered social landlords in Wales and Scotland in the near future.
Future potential methodological and classification changes to PSF
On 17 July 2018, we will be publishing a forward-looking article to provide users with an overview of those areas where existing methodologies are, or will be, under review. The aim is to give users early sight of those areas where the fiscal statistics might be significantly impacted by methodological or classification changes during the coming 24 months. The article is designed to help government in its fiscal planning and support the Office for Budget Responsibility (OBR) in its role in producing fiscal forecasts. For this reason the publication date has been set to coincide with the OBR’s publication of their latest Fiscal Sustainability Report. The article will be the first ONS paper of this type but we plan to update the article regularly.
The July article will include topics such as:
student loans
funded and unfunded public sector pension schemes
leases, in light of new business accounting guidance (IFRS16)
depreciation, in light of review of Perpetual Inventory Model (PIM)
asset stocks, in light of review of public sector balance sheet
EU withdrawal agreement
On 8 December 2017, the government published a joint report on progress during phase 1 of negotiations between the European Union and the UK (PDF, 383KB), under Article 50 of the Treaty on European Union (TEU) on the UK’s orderly withdrawal from the EU.
Although the Office for Budget Responsibility (OBR) discusses the EU settlement in Annex B (PDF, 2.5MB) of their Economic and Fiscal Outlook - March 2018, the details in the report are still subject to negotiation and so there is insufficient certainty at this stage for us to complete a formal assessment of impact on the UK public sector finances.
Carillion insolvency
Following Carillion Plc declaring insolvency on 15 January 2018, the UK government announced that it will provide the necessary funding required by the Official Receiver, to ensure continuity of public services through an orderly liquidation. The Official Receiver has been appointed by the court as liquidator, along with partners at PwC that have been appointed Special Managers. The defined benefit pension schemes of former Carillion employees are currently being assessed by the Pension Protection Fund (PPF) prior to any transition into the PPF scheme.
We are currently investigating the various impacts of the liquidation of Carillion on the public sector finances, including in relation to the public-private partnership projects in which Carillion was involved and the additional funding that the government has provided in order to maintain public services. We will announce our findings in due course.
Prior to liquidation, Carillion held approximately 450 contracts with government, representing 38% of Carillion’s 2016 reported revenue.
Student loans in the national accounts
The Treasury Select Committee published the report of its inquiry into the student loan system and related financial implications on 18 February 2018. The report recommends that ONS re-examines the classification of student loans as financial assets, that is, loans, and considers whether there is a basis to treat them differently from other loans in the national accounts and public sector finances.
Student loans in the UK are different from typical loans. Notably, they have a high degree of contingency in that repayments are conditional on subsequent income, and under certain conditions the loan obligation itself may be cancelled. Estimates of the proportion of student loans that will be cancelled, or written off, in the future have been rising in recent years, and are a significant proportion of the total value.
However, the national accounts and public sector finances in the UK are compiled to international standards. These accounting standards are very clear on the treatment of loans and it is this treatment that ONS currently applies to student loans. Where the guidance in these standards is more difficult, and subject to interpretation, is around the recording of financial assets with a significant expected loss – student loans with their contingency on future income are a financial asset with this feature.
To consider the treatment of such financial assets and the accounting issues they raise, we have begun work with international agencies and other National Statistical Offices. This is a complex topic that could have potential implications for all countries with income-contingent loans. However, it is planned that through this work, initiated by ONS, an appropriate statistical treatment in national accounts can be agreed internationally. If this treatment were different to that currently applied to student loans then we would aim to implement it as soon as possible after the new treatment has been agreed, although the time required could depend on the complexity of any new accounting approach.
Any new statistical treatment would almost certainly have no impact on the public sector net cash requirement (PSNCR) and public sector net debt (PSND), this is because these measures are only affected by the actual cash flows relating to student loans and not, for example, any interest that is accrued but not paid. By contrast there could be an impact on public sector net borrowing (PSNB) and public sector net financial liabilities (PSNFL) as these measures are impacted by interest that is accrued but not paid and loan cancellations. The extent of any impact is unknown and would depend on the details of any new internationally-agreed treatment.
The treatment of student loans will be further discussed in the article, due to be published on 17 July 2018, on future potential methodological and classification changes to the public sector finances.
Student loan sale
On 6 December 2017, the government announced it had sold part of the student loan “book” for £1.7 billion. We have now completed a formal classification review of the sale and its accounting treatment and announced the conclusions on 23 April 2018. We concluded that the sale is a “genuine” sale that transfers ownership and control of an asset from the public sector to the private sector. The implications for the public sector finances are that the PSNCR and PSND are both reduced by the £1.7 billion cash value received from the sale, PSNFL is increased by approximately £1.8 billion – the difference between the nominal value of the loans sold and the sale price – while PSNB is not impacted. These impacts have been reflected in the public sector finances.
This classification and the impact on the public sector finances is consistent with the international standards for the accounting of loans. However, as noted previously, we have begun to consider with the international statistical community how UK student loans are most appropriately recorded within national accounts. Following this work and its conclusion, if the recording of student loans was revised then consequently the recording of the student loan sale might also need to be changed. However, whether there would be an impact and the extent of any such impact depends on the details of any new internationally-agreed treatment.
Pension Protection Fund and public sector pension schemes
In January 2018, we reconfirmed the national accounts sector classification of the Pension Protection Fund (PPF) as a public financial corporation, identifying it specifically as a public pension fund, a slight change from the previous classification as a public insurance corporation.
The PPF was established in 2005 under the provisions of the Pensions Act 2004. It is a statutory fund of last resort providing compensation to members of defined benefit pension schemes, when there is a qualifying insolvency event in relation to the employer. It is funded by levies paid by the pension schemes for which it provides protection as well as the assets of schemes that transfer into the PPF and its own investments. The latest published accounts for the PPF show that as of March 2017, it had actuarial pension liabilities of £22.0 billion and net assets of £28.7 billion, with £17.0 billion of these assets stated to be government bonds.
Currently, the PPF is not included in the outturn statistics of the public sector finances and before we implement any change to this position we have initiated a wider review of the recording of public sector pension funds (including the PPF) within the public sector finances. This is necessary, as although the UK public sector finances are based on the principles and building blocks of national accounts, and in particular the European System of Accounts 2010: ESA 2010, there are still decisions to be made regarding how public sector pension funds (including the PPF) should best be reflected within the fiscal aggregates published in public sector finances (such as whether funded pension schemes should be recorded from the perspective of the net pension liabilities of the government as an employer or whether the transactions, assets and liabilities of the pension funds themselves should also be included).
In spring 2018, the Public Sector Finances Technical Advisory Group (PSFTAG) evaluated the different options for recording pensions in the PSF and made a series of recommendations. We are now consulting on these recommendations. Once the consultation period ends on 31 August 2018, we will review the responses and decide a way forward. We will then publish a response and plans for implementation in autumn 2018.
In September 2017, we published an article explaining the national accounts recording of public sector employee pension schemes and how these are currently reflected in the public sector finances.
On 7 March 2018, we published official statistics on the total obligations, or gross liabilities, of UK pension providers including the UK government. This article included estimates for State Pensions, funded and unfunded public sector employee pension schemes and private sector pension schemes.
The treatment of pensions will be further discussed in the article, due to be published on 17 July 2018, on future potential methodological and classification changes to the public sector finances.
Back to table of contents17. Quality and methodology
The public sector finances Quality and Methodology Information (QMI) report contains important information on:
the strengths and limitations of the data and how it compares with related data
uses and users of the data
how the output was created
the quality of the output including the accuracy of the data
This report was last updated on 7 March 2018.
The monthly statistics on the public sector finances: a methodological guide
On 21 June 2018, we published an updated methodological guide providing comprehensive contextual and methodological information concerning the monthly Public sector finances statistical bulletin. The guide sets out the conceptual and fiscal policy context for the bulletin, identifies the main fiscal measures and explains how these are derived and inter-related. Additionally, it details the data sources used to compile the monthly estimates of the fiscal position.
The guide updates and summarises the content of a range of published articles, including the previous version of the PSF methodology guide published in August 2012.
How is the debt interest paid by the government affected by movements in the level of Retail Prices Index?
Index-linked gilts, a form of government bond, are indexed to the Retail Prices Index (RPI). When the RPI rises, the inflation uplift that applies to index-linked cash flows (both regular coupon payments and final payment at gilt maturity) also rises. If the RPI should fall, the inflation uplift would also fall. In this way, the returns to the investor from holding index-linked gilts are maintained in real terms – as measured by the RPI.
Taking £100 as the unit price for a gilt, an index-linked gilt will pay more than £100 at redemption if the RPI increases over the life of the gilt. Similarly, if the RPI increases over the life of the gilt each coupon payment will be higher than the previous one; while if the RPI were to decrease, a coupon payment could be lower than the previous one.
Both the uplift on coupon payments and the uplift on the redemption value are recorded as debt interest paid by the government, so month-on-month there can be sizeable movements in payable government debt interest as a result of movements in the RPI.
The RPI applied to index-linked gilts is typically lagged by three months (though some older gilts have an eight-month lag). As a result of this lag, the amount central government spends on interest on its outstanding debt is typically low in March compared with the rest of the year. In January, prices are typically discounted (for example, due to January sales), so depressing the RPI and decreasing the uplift on index-linked gilts in March, three months later.
Time series of central government debt interest (series identifier NMFX) and the index-linked gilt capital uplift (series identifier MW7L) are available in Tables PSA6B and REC3 in the tables associated with this release or by searching directly by series identifier.
Adjustments to local government data in the current financial year
Most local government data are annual, relating to financial years (April to March), and based on information collected from local authorities by the Ministry of Housing, Communities and Local Government, and the devolved administrations.
The data are collected in two main phases: budget, before the start of the financial year, and outturn, after the end of the financial year.
Some information is available within the year and this is taken into account wherever possible.
In recent years, planned expenditure initially reported in budgets has systematically been higher than the final outturn expenditure reported in the audited accounts. We therefore include adjustments to reduce the amounts reported at the budget stage and this affects the figures for the latest financial year. Each quarter, this underspend adjustment is reviewed such that it reflects the latest available information.
UK Statistics Authority assessment of public sector finances
On 20 June 2017, the UK Statistics Authority published a letter confirming the designation of the monthly Public sector finances bulletin as a National Statistic. This letter completes the 2015 assessment of public sector finances.
In order to meet the requirements of this assessment we published an article, Quality assurance of administrative data used in the UK public sector finances. This report provides an assessment of the administrative data sources used in the compilation of the public sector finances statistics in accordance with the UK Statistics Authority’s Administrative Data Quality Assurance Toolkit.
We introduced a new supplementary fiscal aggregate of public sector net financial liabilities (PSNFL) as an Experimental Statistic in November 2016, explaining that there would be an ongoing programme of work to improve the quality of its underlying data. As a result of improvements to date, in April 2018, public sector net financial liabilities excluding public sector banks (PSNLF ex) was re-designated from an Experimental Statistic to an official statistic.
How classification decisions are made
Each quarter we publish a forward workplan outlining the classification assessments we expect to undertake over the coming 12 months. To supplement this, each month a classifications update is published, which announces classification decisions made and includes expected implementation points (for different statistics) where possible.
Classification decisions are reflected in the public sector finances at the first available opportunity and, where necessary, outlined in this section of the statistical bulletin.
Pre-release access to ONS statistics
On 15 June 2017, the National Statistician announced that from 1 July 2017 pre-release access to Office for National Statistics (ONS) statistics would cease. While there is no longer any pre-release access granted to the Public sector finances bulletin, it should be noted that this bulletin remains jointly produced by members of the Government Statistical Service (GSS) working in both ONS and HM Treasury.
GSS staff will continue to work together to produce the bulletin but ministers and those officials not directly involved in the production and release of statistics will not have access to them in advance of publication.
Time series data
All data contained within these publications are available to download via the public sector finances time series dataset. From April 1997 to date, where available, time series are presented as monthly data, with series extending further back in time, generally presented on a quarterly or financial year basis.
Time series exclusive to the public sector finances borrowing by sub-sector presentation are only available as quarterly time series, though these extend back to 1946.
Supporting documentation
Documentation supporting this publication is available in appendices to the bulletin:
Large impacts on public sector fiscal measures excluding banking groups: Appendix B
Public sector finances revisions analysis on main fiscal aggregates: Appendix C
Impact of the reclassification of housing associations into the public sector: Appendix E
Revisions to the first reported estimate of public sector net borrowing: Appendix F
Public sector borrowing by sub-sector
Each month, at 9:30am on the working day following the Public sector finances statistical bulletin, we publish Public sector finances borrowing by sub-sector.This release contains an extended breakdown of public sector borrowing in a matrix format and also estimates of total managed expenditure (TME).
Back to table of contents