Table of contents
- Main points
- Country and regional public sector finances
- What’s changed in this release?
- Things you need to know about this release
- How much is the public sector borrowing?
- How big is public sector debt?
- How much cash does the public sector need to raise?
- How was debt in the latest financial year accumulated?
- How do these figures compare with official forecasts?
- Revisions since previous release
- International comparisons of borrowing and debt
- Quality and methodology
1. Main points
Public sector net borrowing (excluding public sector banks) decreased by £23.4 billion to £48.7 billion in the financial year ending March 2017 (April 2016 to March 2017), compared with the financial year ending March 2016; this is the lowest net borrowing since the financial year ending March 2008.
The Office for Budget Responsibility (OBR) forecast that public sector net borrowing (excluding public sector banks) would be £51.7 billion during the financial year ending March 2017. During the financial year ending March 2018, OBR forecast public sector net borrowing (excluding public sector banks) to be £58.3 billion.
Public sector net borrowing (excluding public sector banks) increased by £1.2 billion to £10.4 billion in April 2017, compared with April 2016; this is the highest April borrowing since 2014.
Public sector net debt (excluding public sector banks) was £1,722.4 billion at the end of April 2017, equivalent to 86.0% of gross domestic product (GDP); an increase of £114.1 billion (or 2.5 percentage points as a ratio of GDP) on April 2016.
Public sector net debt (excluding both public sector banks and Bank of England) was £1,593.2 billion at the end of April 2017, equivalent to 79.5% of GDP; an increase of £31.5 billion (or a decrease of 1.6 percentage points as a ratio of GDP) on April 2016.
Central government net cash requirement was in surplus by £16.2 billion in April 2017; largely due to the sale of £11.8 billion of Bradford & Bingley loans to Prudential plc.
2. Country and regional public sector finances
On the 23 May 2017, we published Country and Regional PSF for the first time.
Following our consultation on Country and regional public sector finances, these Experimental Statistics aim to allow users to see what expenditure has occurred for the benefit of residents or enterprises in a particular country or region and what revenues have been raised in a particular country or region.
These sub-UK statistics are presented at a NUTS1 geography.
Back to table of contents3. What’s changed in this release?
This section presents information on aspects of data or methodology that is important to understand when reading this bulletin. Where appropriate, further details of individual changes are discussed in the Quality and methodology section of this bulletin.
How early estimates of the components of net borrowing are improved over time
This bulletin presents the second provisional estimates of UK public sector finances for the complete financial year ending March 2017; these are not final figures and will be revised over the coming months as we replace our initial estimates with provisional and then final outturn data.
The data for the latest month of every release contains some forecast data. The initial outturn estimates for the early months of the financial year, particularly April, contain more forecast data than other months, as profiles of tax receipts, along with departmental and local government spending are still provisional. This means that the data for these months are typically more prone to revision than other months and can be subject to sizeable revisions in later months.
Appendix G: Revisions to the first reported estimate of financial-year-end public sector net borrowing (excluding public sector banks) by sub-sector; summarises revisions to the first estimate of public sector borrowing (excluding public sector banks) by sub-sector for the last 6 financial years. Revisions are shown at 6 and 12 months after year end.
We have published an article, Public Sector Finances – Sources summary and their timing, which provides a brief summary of the different sources used and the implications of using those data in the monthly Public Sector Finances (PSF) statistical bulletin.
Lloyds share sales
On 17 May 2017, the government announced that it had sold its entire stake in Lloyds Banking Group.
The proceeds of the sale will be fully recorded within the public sector finances in the May bulletin (released 21 June 2017) and as with similar share sales, the proceeds will reduce the central government net cash requirement (CGNCR) and public sector net debt (PSND) by an amount corresponding to the cash raised from the sale, but have no impact on public sector net borrowing.
The recording of fines and Deferred Prosecution Agreements
We have reviewed the way in which we collect and record fines imposed by the Financial Conduct Authority and Deferred Prosecution Agreements imposed by the Serious Fraud Office. By taking data directly from their respective website we will improve both the timeliness of the data and ensure that we capture all revenue received by the public sector.
The impact of this improvement will be to increase central government receipts by £74 million in the financial year ending March 2016 and £172 million in the financial year ending March 2017.
This month we have recorded a £235 million Deferred Prosecution Agreement paid by Tesco Stores Limited. This payment has increased central receipts by £235 million and consequently lowered public sector net borrowing by a corresponding amount.
UK Asset Resolution asset sales Ltd (UKAR)
On 31 March 2017, the government announced its intention to sell £11.8 billion worth of Bradford & Bingley loans to Prudential plc. This sale was completed in April 2017 and so recorded within public sector finances this month.
The proceeds of such sales reduce the central government net cash requirement (CGNCR) and public sector net debt (PSND) by an amount corresponding to the cash raised from the sale, but have no impact on public sector net borrowing.
The recording of UKAR bank deposits with Bank of England
Quality assurance work has enabled us to improve our central government liquid asset data (which is a component of net debt), relating to the recording of UKAR bank deposits with Bank of England.
These improvements impact on central government bank deposits from October 2014 (when UKAR was first classified as a central government body), with public sector net debt at the end of March 2016 reduced by £2.0 billion.
This improvement has no impact on the measures of government gross debt supplied quarterly to the European Commission.
Bank of England Asset Purchase Facility Fund (BEAPFF)
In April 2017, there was a £4.3 billion dividend transfer from the BEAPFF to HM Treasury. As with other such transfers, central government net borrowing will be reduced by an amount equivalent to the transfer, while the net borrowing of Bank of England will be increased by an equal and offsetting amount, with no impact at a public sector borrowing level.
The Bank of England entrepreneurial income for the financial year ending March 2017 (April 2016 to March 2017) was calculated as £13.3 billion. This is the total amount of dividend transfers that can impact on central government net borrowing in the financial year ending March 2018 (April 2017 to March 2018).
Back to table of contents4. Things you need to know about this release
What are the most important terms I need to know?
Public sector net borrowing excluding public sector banks (PSNB ex) measures the gap between revenue raised (current receipts) and total spending (current expenditure plus net investment (capital spending less capital receipts)). Public sector net borrowing is often referred to as “the deficit”.
The public sector net cash requirement (PSNCR) represents the cash needed to be raised from the financial markets over a period of time to finance the government’s activities. This can be close to the deficit for the same period but there are some transactions, for example, loans to the private sector, which need to be financed but do not contribute to the deficit. It is also close but not identical to the changes in the level of net debt between two points in time.
Public sector net debt excluding public sector banks (PSND ex) represents the amount of money the public sector owes to private sector organisations including overseas institutions, largely as a result of issuing gilts and treasury bills, less the amount of cash and other short-term assets it holds.
While borrowing (or the deficit) represents the difference between total spending and receipts over a period of time, debt represents the total amount of money owed at a point in time.
The debt has been built up by successive government administrations over many years. When the government borrows (that is, runs a deficit), this normally adds to the debt total. So reducing the deficit is not the same as reducing the debt.
If you’d like to know more about the relationship between debt and deficit, please refer to our article The debt and deficit of the UK public sector explained.
What does the public sector include?
In the UK, the public sector consists of five sub-sectors: central government, local government, public non-financial corporations, Bank of England and public financial corporations (that is, public sector banks – currently only Royal Bank of Scotland (RBS)).
The figures quoted in this bulletin exclude public financial corporations (unless otherwise stated) as the reported position of both borrowing and debt would be dominated and distorted by the inclusion of RBS’s balance sheet (and transactions) given its size relative to the rest of the public sector.
Additionally, the government’s fiscal rules are based on aggregates that exclude public sector banks.
The sub-sector breakdown of public sector net borrowing is summarised in Table PSA2 in the Public Sector Finances Tables 1 to 10: Appendix A dataset.
Should I look at monthly or financial year-to-date data to understand public sector finances?
A financial year is an accounting period of 12 months running from 1 April one year to 31 March the following year. For example, the financial year ending March 2016 comprises the months from April 2015 to March 2016.
Due to the volatility of the monthly data, the cumulative financial year-to-date borrowing figures provide a better indication of the position of the public finances than the individual months.
Are our figures adjusted for inflation?
All monetary values in the PSF bulletin are expressed in terms of “current prices‟, that is, they represent the price in the period to which the expenditure or revenue relates and are not adjusted for inflation.
In order to compare data over long time periods, to aid international comparisons and provide an indication of a country’s ability to service borrowing and debt, commentators often discuss changes over time to fiscal aggregates in terms of gross domestic product (GDP) ratios. GDP represents the value of all the goods and services currently produced by the UK economy in a period of time.
Are our figures adjusted for seasonal patterns?
All monetary values in the PSF bulletin are not seasonally adjusted. We recommend you use year-on-year comparisons (be it cumulative financial year-to-date or individual monthly borrowing figures) rather than making month-on-month comparisons.
Are our monthly figures likely to change over time?
Each PSF bulletin contains the first estimate of public sector borrowing for the most recent period and is likely to be revised in later months as more data become available.
In publishing monthly estimates, it is necessary to use a range of different types of data sources. Some of these are subject to revision as budget estimates (forecasts) are replaced by out-turn data and these then feed into the published aggregates. In addition to those that stem from updated data sources, revisions can also result from methodology changes. An example of the latter is the changes that were due to the introduction of improved methodology for the recording of Corporation Tax, Bank Corporation Tax Surcharge receipts and Bank Levy implemented in the PSF estimates released in February 2017.
Back to table of contents5. How much is the public sector borrowing?
In the latest full financial year (April 2016 to March 2017), the public sector spent more money than it received in taxes and other income. This meant it had to borrow £48.7 billion; £23.4 billion less than in the previous financial year (April 2015 to March 2016).
Of this £48.7 billion of public sector net borrowing excluding public sector banks (PSNB ex), £10.7 billion related to the cost of the “day-to-day” activities of the public sector (the current budget deficit), while £38.0 billion related to capital spending (or net investment) such as infrastructure.
Figure 1 presents cumulative public sector net borrowing (excluding public sector banks) by month in the latest full financial year and compares the cumulative borrowing with that in the previous financial year.
Figure 1: Cumulative public sector net borrowing (excluding public sector banks) by month UK
Source: Office for National Statistics
Download this chart Figure 1: Cumulative public sector net borrowing (excluding public sector banks) by month UK
Image .csv .xlsThe difference between central government's income and spending makes the largest contribution to the amount borrowed by the public sector. In the latest full financial year, £39.9 billion of the £48.7 billion borrowed by the public sector was by central government.
In the latest full financial year, central government received £676.5 billion in income; including £508.9 billion in taxes. This was around 6% more than in the previous financial year.
Over the same period, central government spent £697.5 billion; around 2% more than in the previous financial year. Of this amount, just below two-thirds was spent by central government departments (such as health, education and defence), around one third on social benefits (such as pensions, unemployment payments, Child Benefit and Maternity Pay) with the remaining being spent on capital investment and interest on government’s outstanding debt.
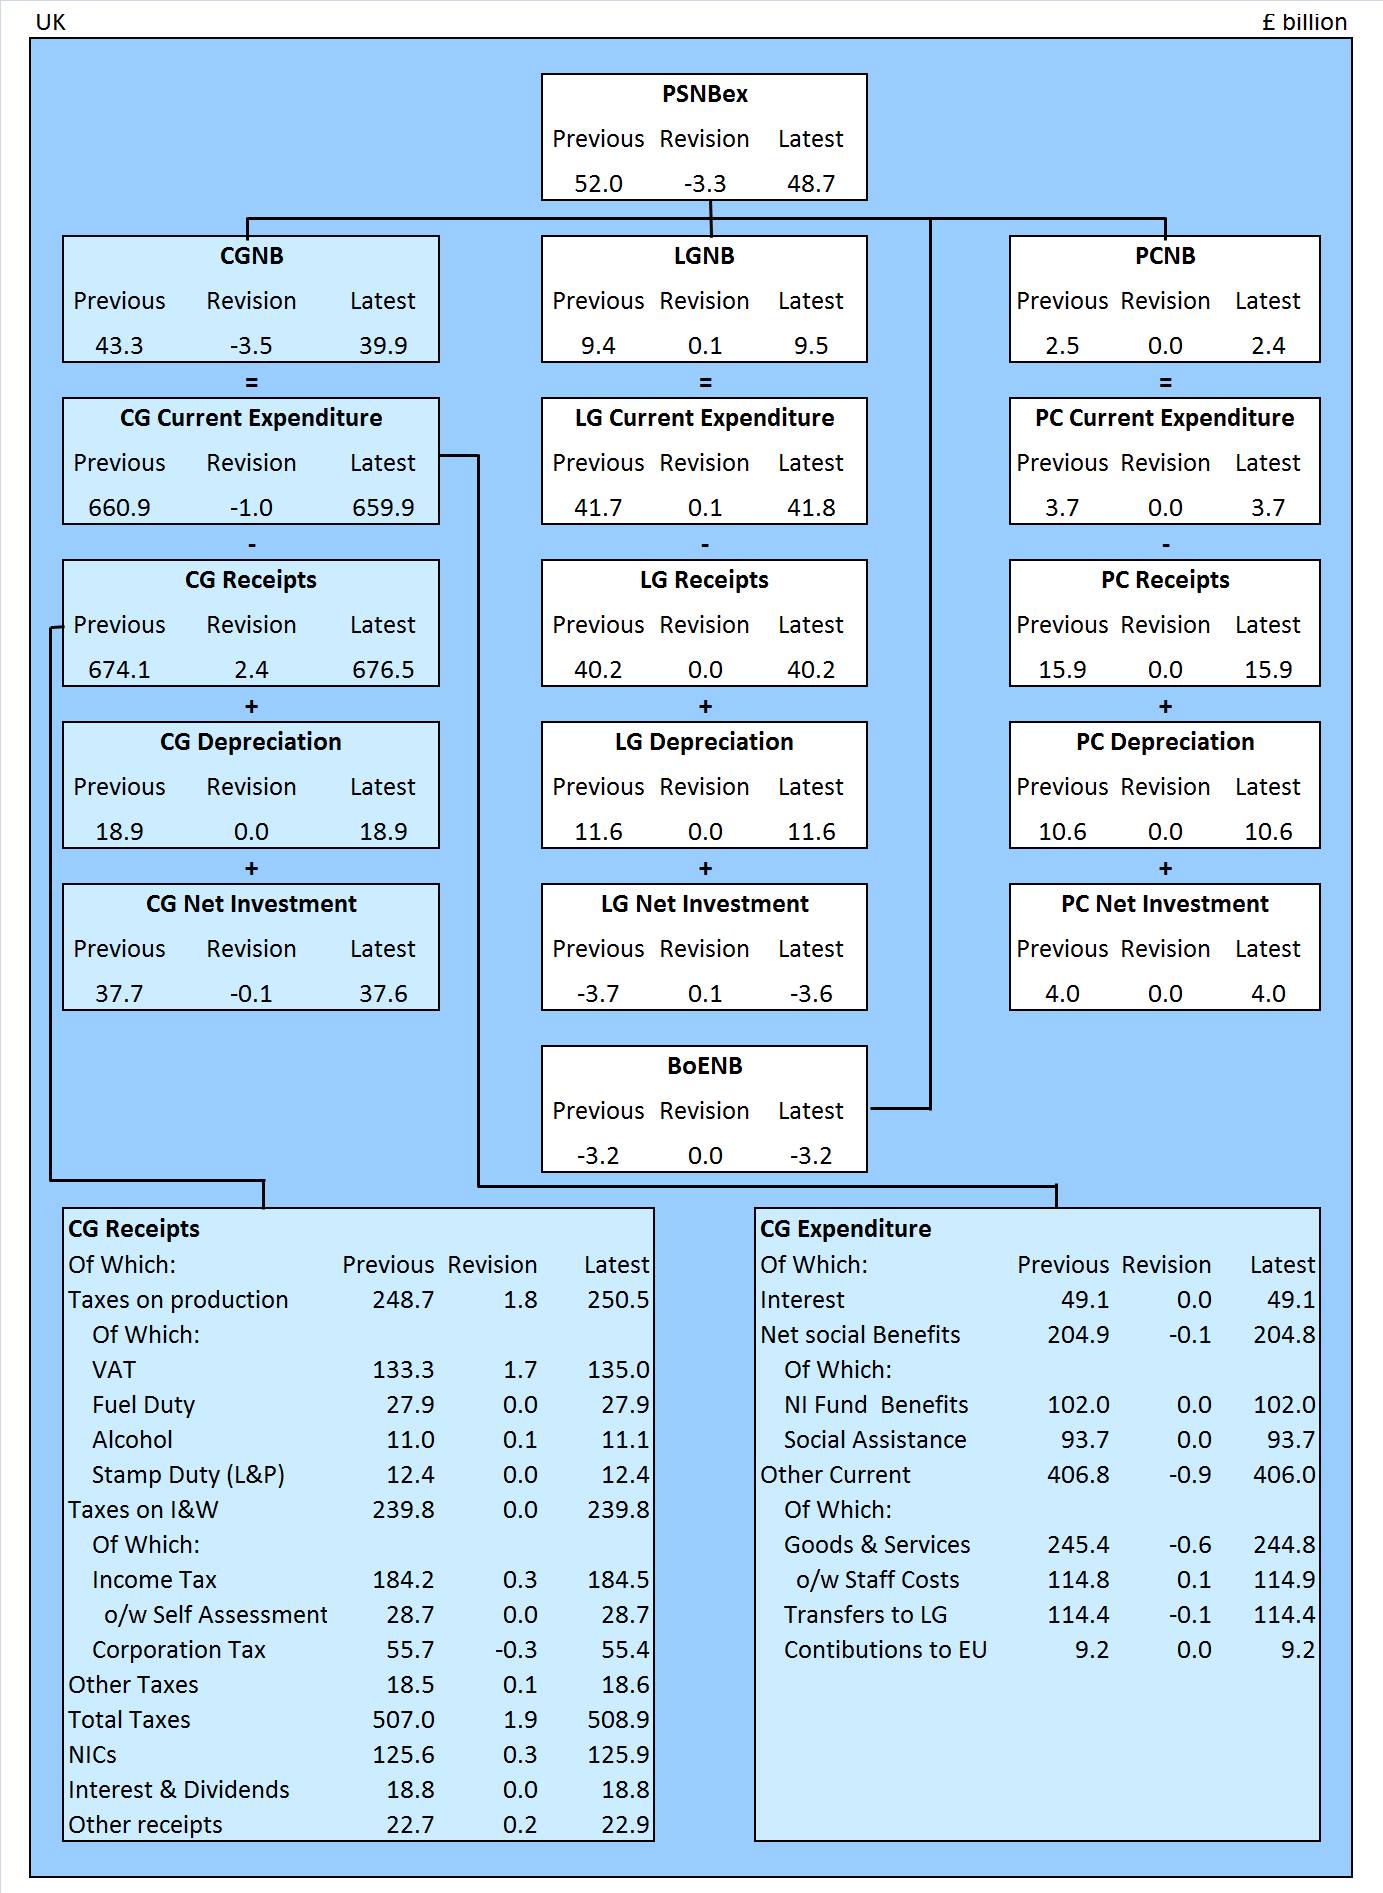
Figure 2 summarises public sector borrowing by sub-sector in the latest full financial year and compares these measures with the previous financial year (April 2015 to March 2016).
This presentation splits PSNB ex into each of its four sub-sectors: central government, local government, public corporations and Bank of England.
A further breakdown (receipts, expenditure (both current and capital) and depreciation) is provided for central government, local government and public corporations; with central government current receipts and current expenditure being presented in further detail.
Figure 2: Contributions to public sector net borrowing (excluding public sector banks) in latest financial year (April 2016 to March 2017) compared to the previous financial year

Source: Office for National Statistics
Notes:
- PSNBex - Public sector net borrowing excluding public sector banks.
- CGNB - Central government net borrowing.
- LGNB - Local government net borrowing.
- PCNB - Non-financial public corporations' net borrowing.
- BoENB - Bank of England net borrowing.
- L&P - Land and property.
- I&W - Income and wealth.
- NICs - National Insurance contributions.
- Contributions to EU - UK VAT, GNI and abatement contributions to the EU budget.
Download this image Figure 2: Contributions to public sector net borrowing (excluding public sector banks) in latest financial year (April 2016 to March 2017) compared to the previous financial year
.png (104.6 kB) .xls (67.1 kB)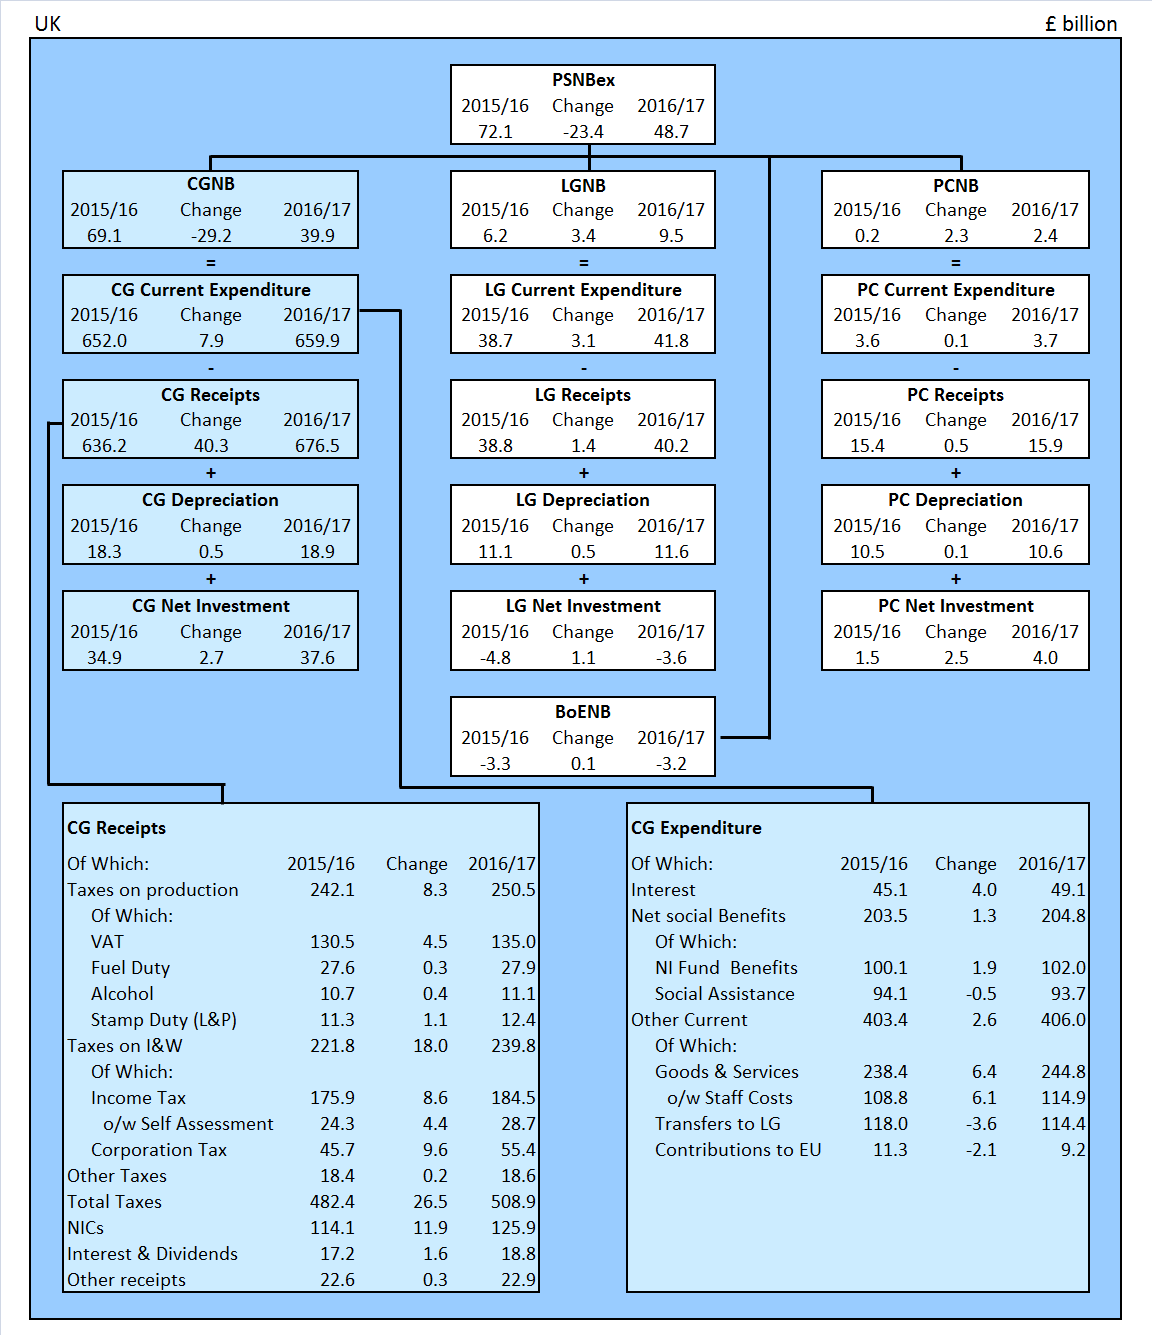
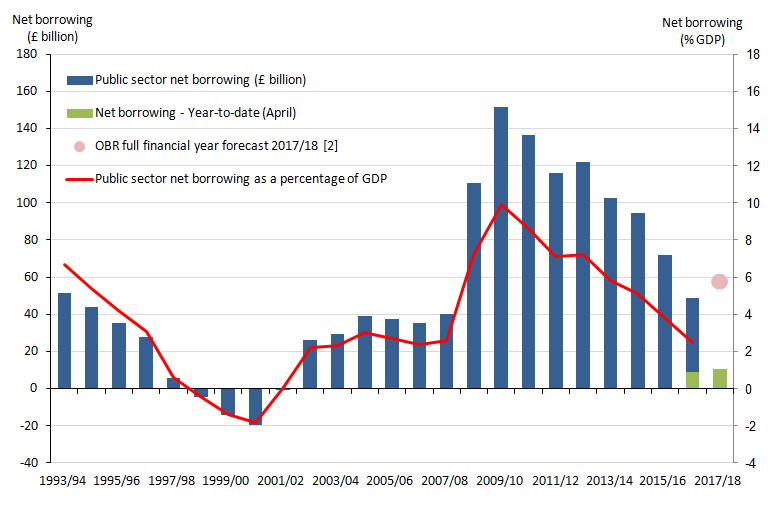
Figure 3 illustrates that annual borrowing has generally been falling since the peak in the financial year ending March 2010 (April 2009 to March 2010).
Initial estimates indicate that in the financial year ending March 2017 (April 2016 to March 2017), the public sector borrowed £48.7 billion or 2.5% of gross domestic product (GDP). This was £23.4 billion lower than in the previous financial year and around one third of that in the financial year ending March 2010 when borrowing was £151.7 billion or 9.9 % of GDP.
Figure 3: UK public sector net borrowing (excluding public sector banks), April 1993 to April 2017
Source: Office for National Statistics
Notes:
- Financial year 2016 to 2017 represents financial year ending 2017 (April 2016 to March 2017).
- Office for Budget Responsibility (OBR) full financial year forecast of £58.3 billion for public sector net borrowing excluding public sector banks (March 2017 Economic and Fiscal Outlook).
Download this image Figure 3: UK public sector net borrowing (excluding public sector banks), April 1993 to April 2017
.png (32.6 kB) .xls (50.2 kB)
Focusing on the current month
In April 2017, the public sector spent more money than it received in taxes and other income. This meant it had to borrow £10.4 billion; £1.2 billion more than in April 2016.
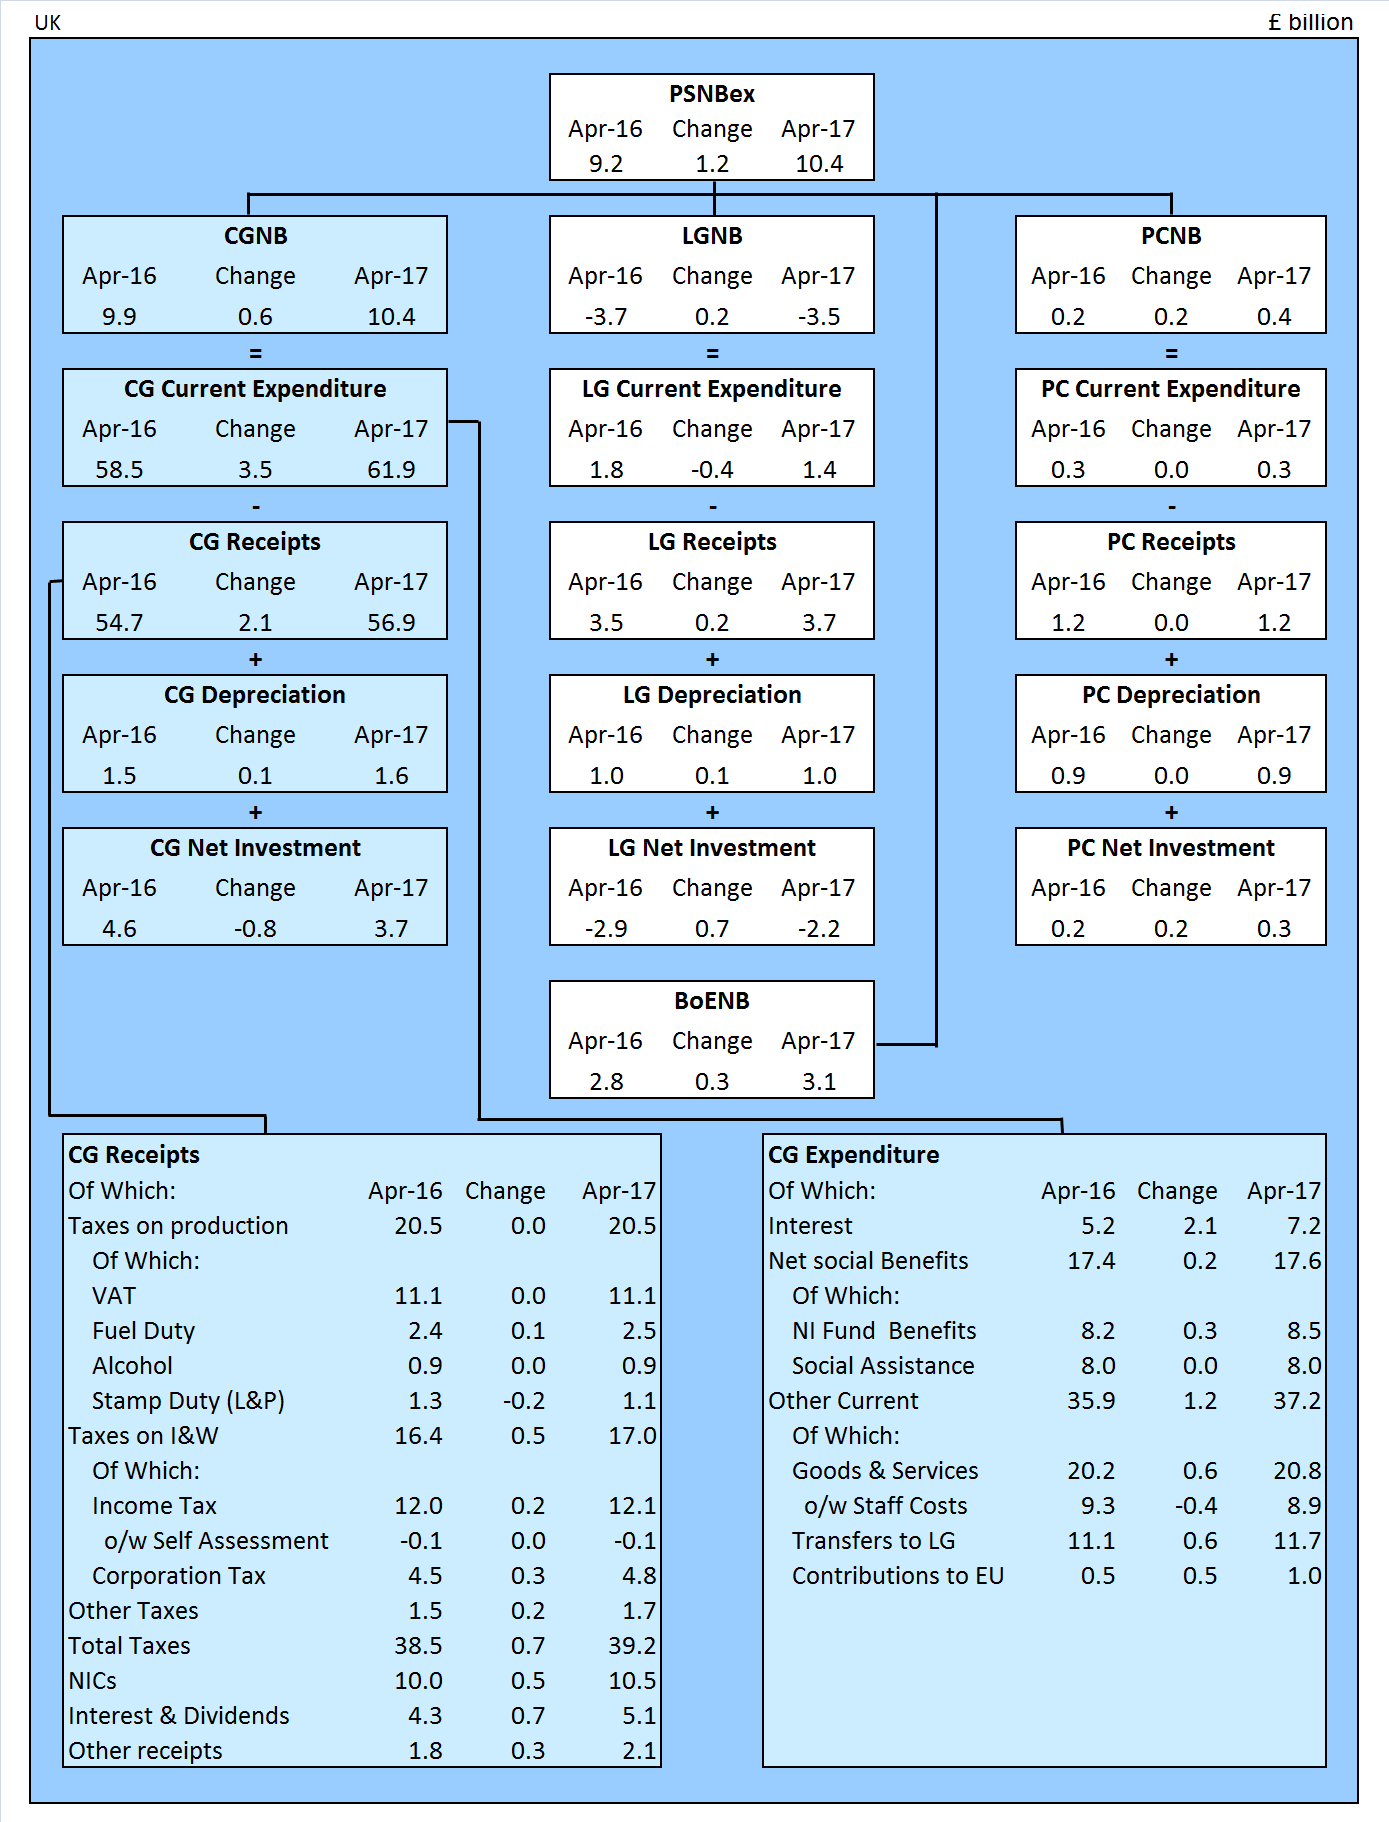
Figure 4 summarises public sector borrowing by sub-sector in April 2017 and compares this with the equivalent measures in the same month a year earlier (April 2016).
This presentation splits public sector net borrowing excluding public sector banks (PSNB ex) into each of its four sub-sectors: central government, local government, public corporations and Bank of England.
A further breakdown (receipts, current expenditure, capital expenditure and depreciation) is provided for central government, local government and public corporations; with central government current receipts and current expenditure being presented in further detail.
Both local government and public corporations data for April 2017 are initial estimates. Most of these components are calculated by Office for National Statistics (ONS) based on Office for Budget Responsibility (OBR) forecasts. Administrative source data are used for transfers to each of these sectors from central government.
Figure 4: Contributions to public sector net borrowing (excluding public sector banks) in April 2017 compared to April 2016
Source: Office for National Statistics
Notes:
- PSNBex - Public sector net borrowing excluding public sector banks.
- CGNB - Central government net borrowing.
- LGNB - Local government net borrowing.
- PCNB - Non-financial public corporations' net borrowing.
- BoENB - Bank of England net borrowing.
- L&P - Land and property.
- I&W - Income and wealth.
- NICs - National Insurance contributions.
- Contributions to EU - UK VAT, GNI and abatement contributions to the EU budget.
Download this image Figure 4: Contributions to public sector net borrowing (excluding public sector banks) in April 2017 compared to April 2016
.png (141.0 kB) .xls (67.1 kB)
6. How big is public sector debt?
The amount of money owed by the public sector to the private sector stood at just above £1.7 trillion at the end of April 2017, which equates to 86.0% of the value of all the goods & services currently produced by the UK economy in a year (or gross domestic product (GDP)).
This debt figure of £1.7 trillion (or £1,722.4 billion) at the end of April 2017 represents an increase of £114.1 billion since the end of April 2016. Of this £114.1 billion, £82.6 billion is attributable to debt accumulated within the Bank of England, nearly all of it in the Asset Purchase Facility. Of this £82.6 billion, £57.5 billion relates to the Term Funding Scheme (TFS).
Figure 5 breaks down outstanding public sector net debt at the end of April 2017 into the sub-sectors of the public sector. In addition to public sector net debt excluding public sector banks (PSND ex), this presentation includes the impact of public sector banks on debt.
Figure 5: Sub-sector contributions to public sector net debt at April 2017, UK
Source: Office for National Statistics
Notes:
- PSND - Public sector net debt.
- PSBsND - Public sector Banks net debt.
- PSNDex - Public sector net debt excluding public sector banks.
- BoEND - Bank of England's contribution to net debt.
- PSND ex Boe - Public sector net debt excluding both public sector banks and Bank of England.
- NFPCND - Non-financial public corporations' net debt.
- GGND - General government net debt.
Download this chart Figure 5: Sub-sector contributions to public sector net debt at April 2017, UK
Image .csv .xlsNet debt is defined as total gross financial liabilities less liquid financial assets, where liquid assets are cash and short-term assets, which can be released for cash at short notice without significant loss. These liquid assets mainly comprise foreign exchange reserves and bank deposits.
Figure 6 presents public sector net debt excluding public sector banks (PSND ex) at the end of April 2017 by sub-sector. Time series for each of these component series are presented in Tables PSA8A to D in the Public Sector Finances Tables 1 to 10: Appendix A dataset.
Figure 6: Sub-sector split of public sector net debt (excluding public sector banks) at April 2017, UK (£ billion)

Source: Office for National Statistics
Notes:
- Cross-holdings between sub-sectors are removed in calculating public sector net debt, gross debt and liquid assets.
- APF - Bank of England Asset Purchase Facility.
Download this image Figure 6: Sub-sector split of public sector net debt (excluding public sector banks) at April 2017, UK (£ billion)
.png (73.1 kB) .xls (166.4 kB)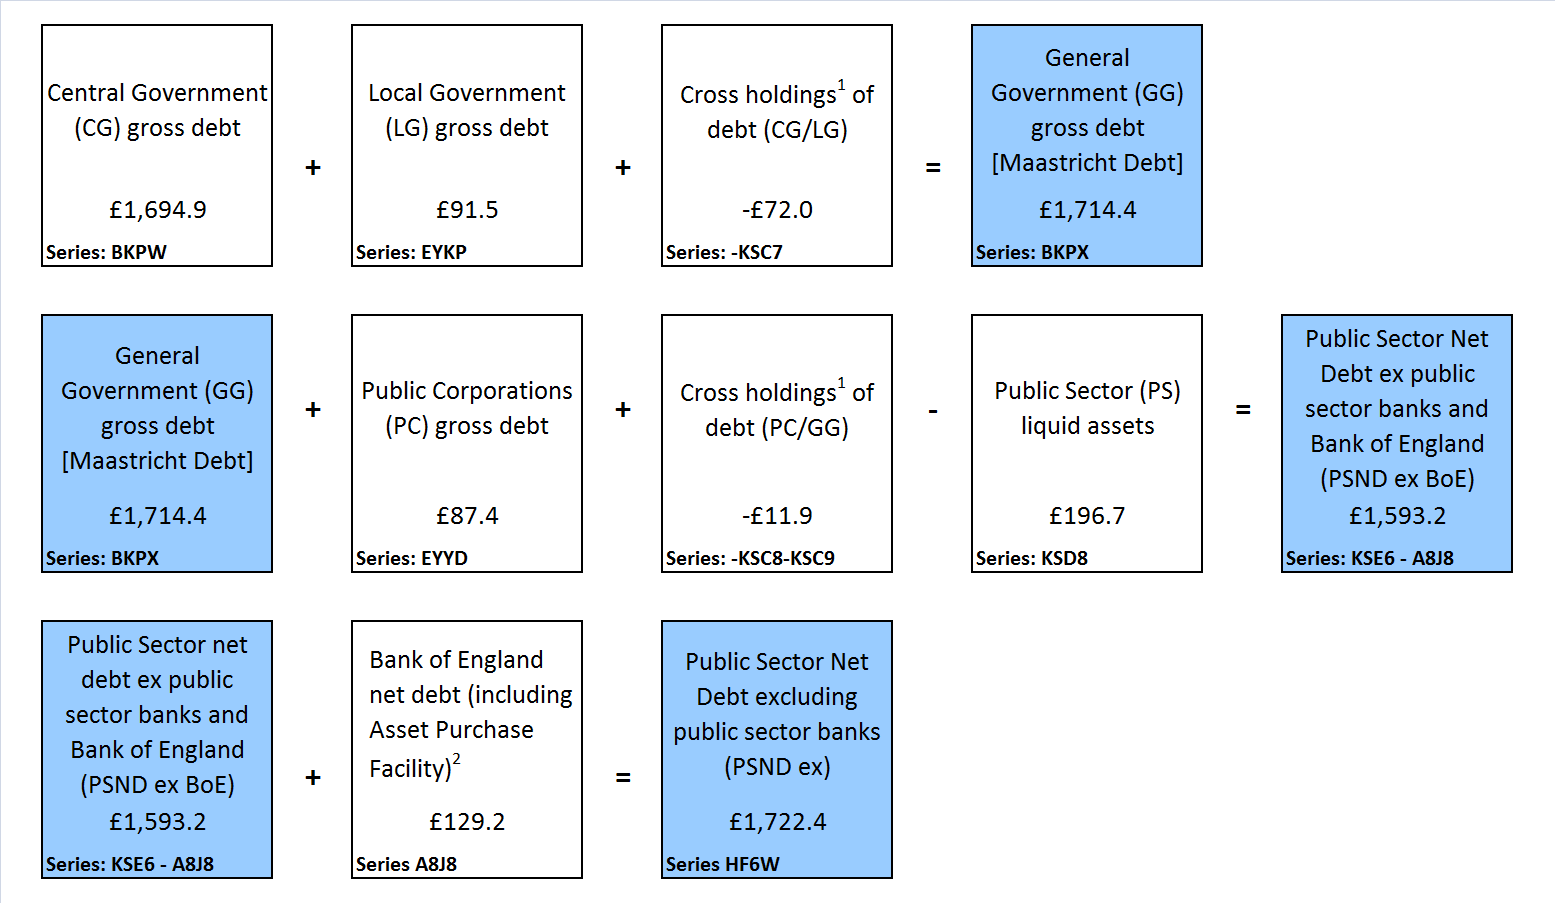
Figure 7 illustrates PSND ex from the financial year ending March 1994 to the end of April 2017.
Figure 7: UK public sector net debt (excluding public sector banks), March 1994 to the end of April 2017

Source: Office for National Statistics
Download this image Figure 7: UK public sector net debt (excluding public sector banks), March 1994 to the end of April 2017
.png (36.3 kB) .xls (41.0 kB)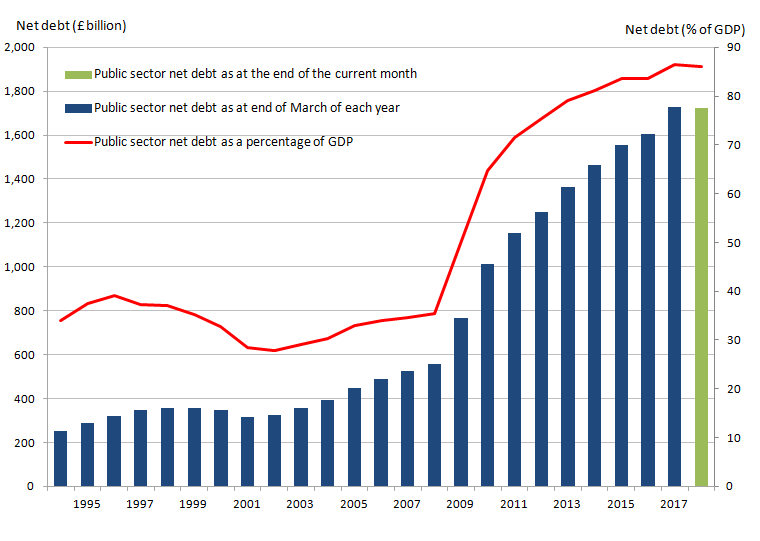
PSND ex increased at the time of the economic downturn. Since then, it has continued to increase but at a slower rate. The introduction of the Term Funding Scheme in late 2016 has led to a rise in net debt, as the loans provided under the scheme are not liquid assets and therefore do not net off in public sector net debt (against the liabilities incurred in providing the loans).
Back to table of contents7. How much cash does the public sector need to raise?
The net cash requirement is a measure of how much cash the public sector needs to raise from the financial markets (or pay out from its cash reserves) to finance its activities. This amount can be close to the deficit for the same period but there are some transactions, for example, lending to the private sector or the purchase of shares, that need to be financed but do not contribute to the deficit. Similarly, repayments of principal on loans extended by government or sales of shares will reduce the level of financing necessary but not reduce the deficit.
Figure 8 presents public sector cash requirement by sub-sector for April 2017. Time series for each of these component series are presented in Table PSA7A in the Public Sector Finances Tables 1 to 10: Appendix A dataset.
Figure 8: Sub-sector split of public sector net cash requirement (excluding public sector banks), April 2017, UK (£ billion)

Source: Office for National Statistics
Notes:
- Effects of cash transactions between sub-sectors are removed in calculating public sector total net cash requirement (and consolidated expenditure and income totals).
- APF - Bank of England Asset Purchase Facility.
Download this image Figure 8: Sub-sector split of public sector net cash requirement (excluding public sector banks), April 2017, UK (£ billion)
.png (53.0 kB) .xls (151.6 kB)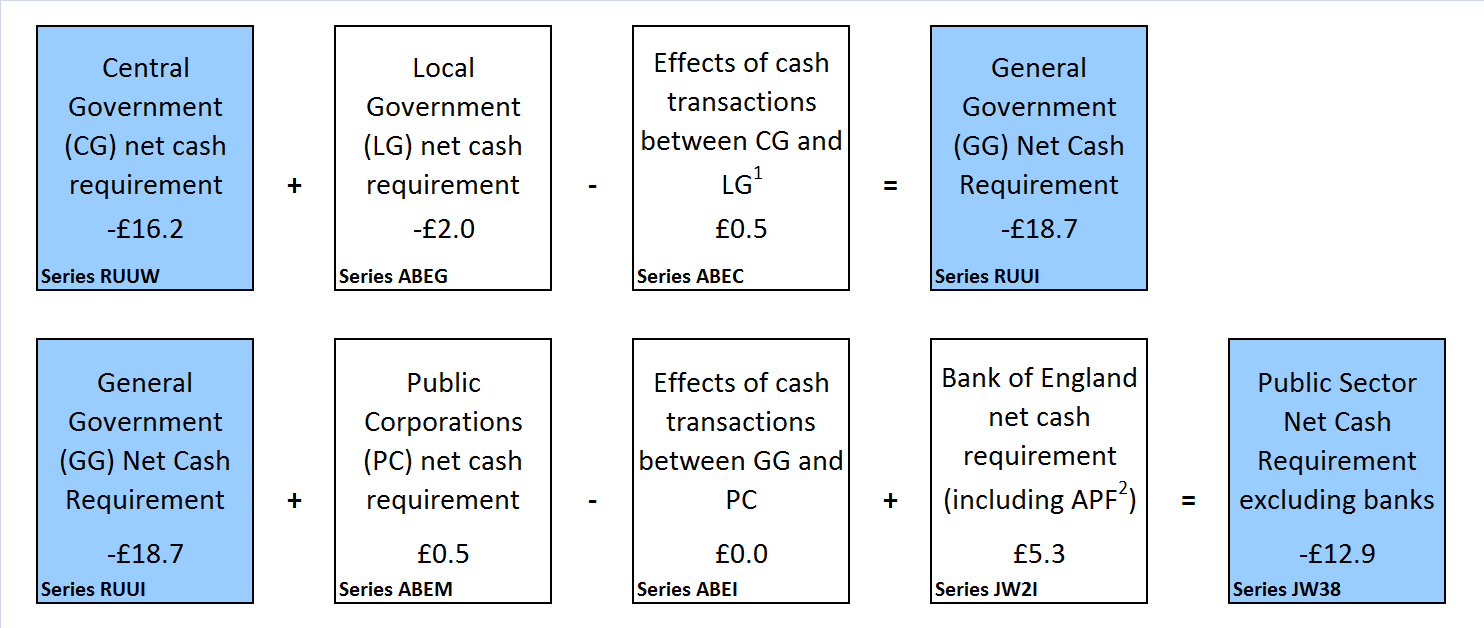
Central government net cash requirement (CGNCR) is a focus for some users, as it provides an indication of the volume of gilts (government bonds) the Debt Management Office may issue to meet the government’s borrowing requirements.
CGNCR is quoted both including and excluding the net cash requirement of Network Rail (NR) and UK Asset Resolution LTD (UKAR) (who manage the closed mortgage books of both Bradford & Bingley and Northern Rock Asset Management). It is the CGNCR excluding NR and UKAR that is the particular focus of users with an interest in the gilt market.
CGNCR excluding NR and UKAR was in surplus by £15.2 billion in April 2017; largely due to the sale of £11.8 billion worth of Bradford & Bingley loans to Prudential plc.
Back to table of contents8. How was debt in the latest financial year accumulated?
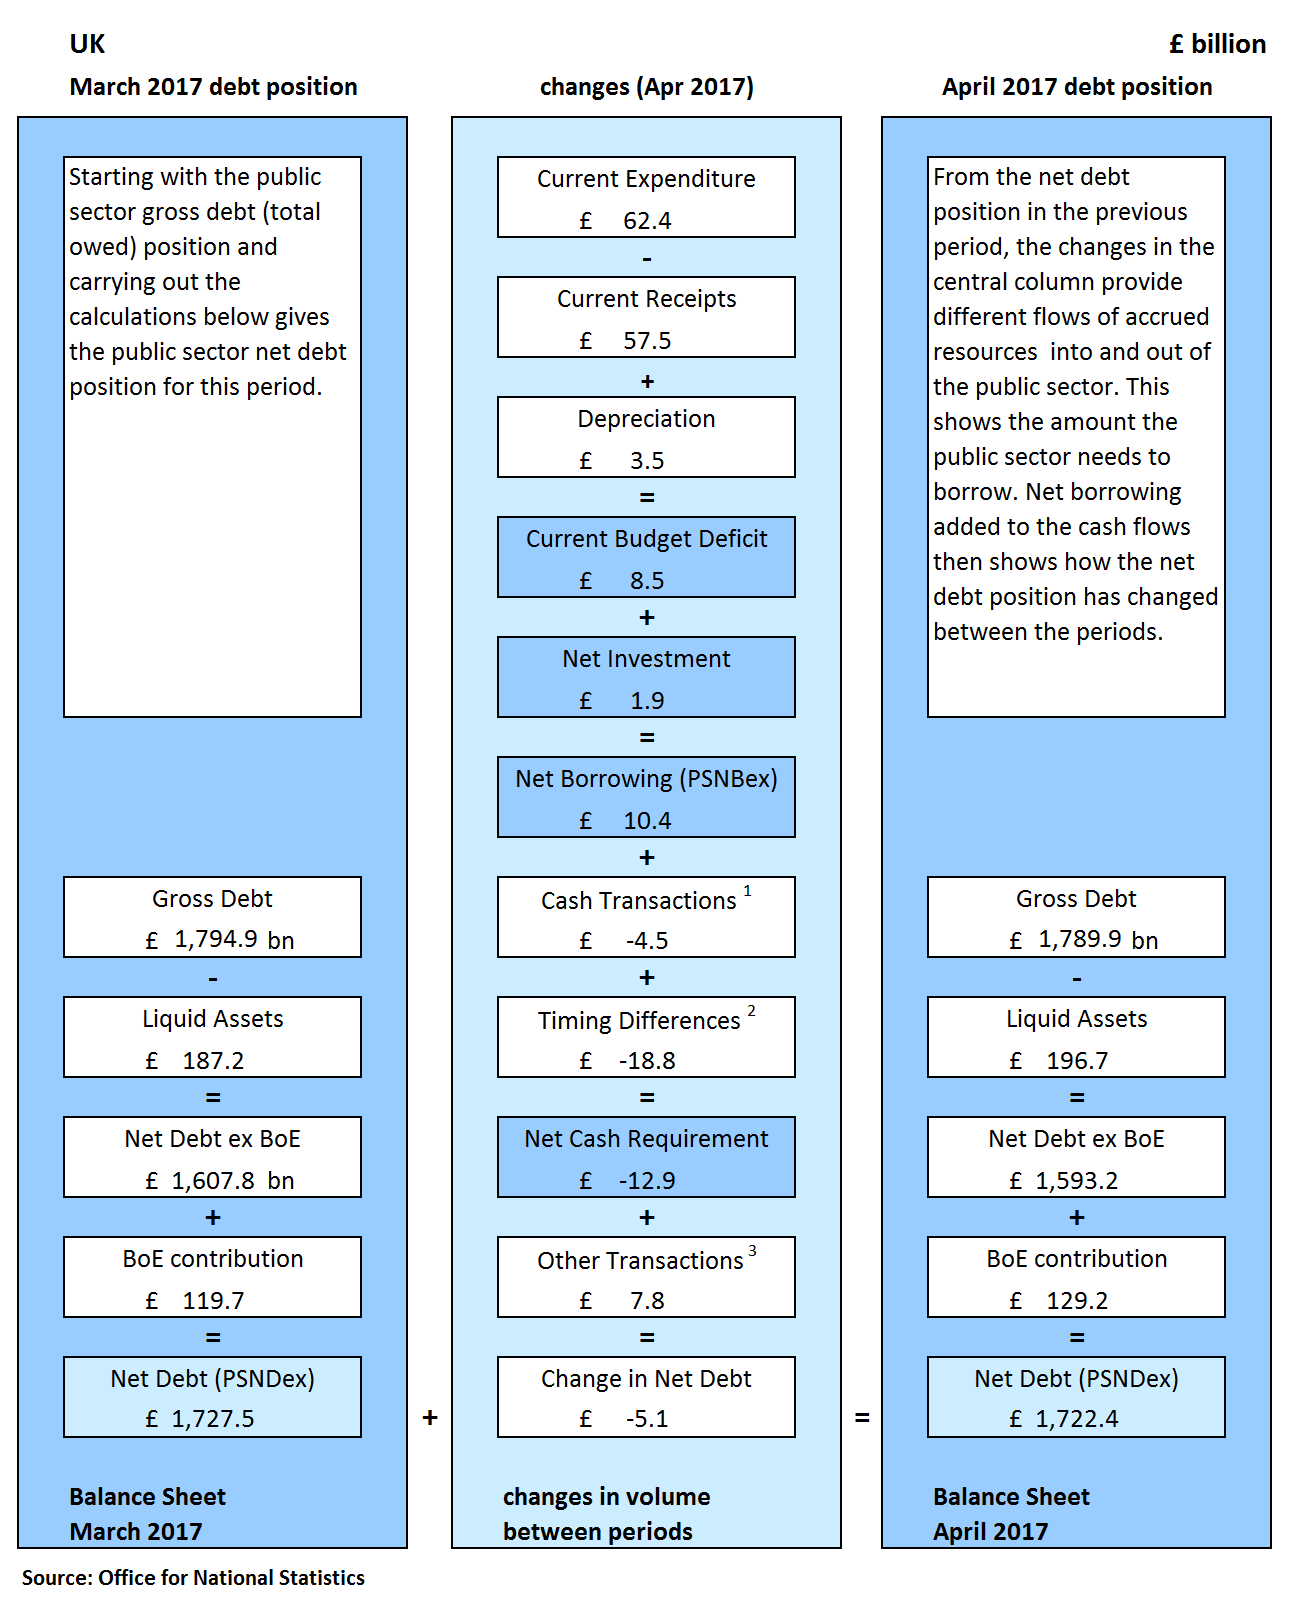
Figure 9 brings together the borrowing components detailed in Figure 2 to illustrate how the differences between income and spending (both current and capital) have led to the accumulation of debt in the current financial year.
This presentation excludes public sector banks, focusing instead on the public sector net borrowing excluding public sector banks (PSNB ex) measure.
Figure 9: Changes in public sector finances (excluding public sector banks) in April 2017, UK (£ billion)
Source: Office for National Statistics
Notes:
- Cash transactions in (non-financing) financial assets, which do not impact on net borrowing.
- Timing differences between cash and accrued data.
- Revaluation of foreign currency debt (for example, foreign currency). Debt issuances or redemptions above or below debt valuation (for example, bond premia and discounts and capital uplifts). Changes in volume of debt not due to transactions (for example, sector reclassification).
Download this image Figure 9: Changes in public sector finances (excluding public sector banks) in April 2017, UK (£ billion)
.png (134.5 kB) .xls (42.5 kB)
The reconciliation between public sector net borrowing and net cash requirement is presented in more detail in Table REC1 in the Public Sector Finances Tables 1 to 10: Appendix A dataset.
Back to table of contents9. How do these figures compare with official forecasts?
The Office for Budget Responsibility (OBR) normally produces forecasts of the public finances twice a year (currently in March and November). The latest OBR forecast was published on 8 March 2017.
The government has adopted OBR forecasts as its official forecast.
OBR forecast that the public sector would borrow £51.7 billion during the financial year ending March 2017; a reduction of £20.4 billion on outturn for the financial year ending March 2016. The provisional outturn estimate for the financial year ending March 2017 was £48.7 billion, £3.0 billion less than the OBR forecast.
OBR forecast that the public sector would borrow £58.3 billion during the financial year ending March 2018; an increase of £9.6 billion on the provisional outturn estimate for the financial year ending March 2017.
Figure 10 presents the cumulative public sector net borrowing for the latest full and previous financial years. The figure also presents the OBR forecasts for the corresponding financial years.
Figure 10: Cumulative public sector net borrowing by month; current year-to-date (April 2017) and financial year ending March 2017
UK, all data excluding public sector banks
Source: Office for National Statistics
Notes:
- For the financial year ending 2016 (April 2015 to March 2016) and the financial year ending 2017 (April 2016 to March 2017).
- OBR forecast for public sector net borrowing excluding public sector banks from March 2017 Economic and Fiscal Outlook (EFO).
Download this chart Figure 10: Cumulative public sector net borrowing by month; current year-to-date (April 2017) and financial year ending March 2017
Image .csv .xlsTable 1 compares the first estimates of full financial year data against the OBR forecasts. Caution should be taken when comparing public sector finances data with OBR figures for the full financial year, as data are not finalised until after the financial year ends.
Initial estimates soon after the end of the financial year can be subject to sizeable revisions in later months.
In addition, the monthly path of spending and receipts is not smooth within the year and also can vary compared with previous years, both of which can affect year-on-year comparisons.
There can also be methodological differences between OBR forecasts and out-turn data. In its latest publication, OBR published a table within its Economic and fiscal outlook supplementary fiscal tables: receipts and other – March 2017 titled “Table: 2.46 Items included in OBR forecasts that ONS have not yet included in out-turn”.
Table 1: Public sector latest outturn estimates compared with Office for Budget Responsibility (OBR) forecasts, full financial year ending 2017 (April 2016 to March 2017)
| UK, excluding public sector banks | £ billion1 (not seasonally adjusted) | |||
| Full financial year7 | ||||
| 2016/17 Outturn | 2016/17 OBR Forecast8 | Difference | ||
| Current budget deficit2 | 10.7 | 15.2 | -4.5 | |
| Net investment3 | 38.0 | 36.5 | 1.5 | |
| Net borrowing 4 | 48.7 | 51.7 | -3.0 | |
| Net debt 5 | 1,727.5 | 1,730.0 | -2.5 | |
| Net debt as a percentage of GDP6 | 86.5 | 86.6 | -0.1 | |
| Source: Office for National Statistics | ||||
| Notes: | ||||
| 1. Unless otherwise stated. | ||||
| 2. Current budget deficit is the difference between current expenditure (including depreciation) and current receipts. | ||||
| 3. Net investment is gross investment (net capital formation plus net capital transfers) less depreciation. | ||||
| 4. Net borrowing is current budget deficit plus net investment. | ||||
| 5. Net debt is financial liabilities (for loans, deposits, currency and debt securities) less liquid assets. | ||||
| 6. GDP at current market price. | ||||
| 7. 2016 and 2017 refers to financial year ending in March 2017 and 2015 to 2016 refers to financial year ending in March 2016. | ||||
| 8. All OBR figures are from the OBR Economic and Fiscal Outlook published in March 2017. | ||||
Download this table Table 1: Public sector latest outturn estimates compared with Office for Budget Responsibility (OBR) forecasts, full financial year ending 2017 (April 2016 to March 2017)
.xls (33.8 kB)10. Revisions since previous release
Revisions can be the result of both updated data sources and methodology changes. This month the reported revisions to borrowing are largely the result of data changes, while the revisions to net debt are largely due to a change in methodology.
Table 2 summarises revisions to the headline statistics presented in this bulletin compared with those presented in the previous publication (25 April 2017).
Table 2: Revisions between this bulletin (May 2017) and the previous bulletin (April 2017)
| UK, previous bulletin refers to the PSF bulletin published on 25 April 2017 | ||||||||
| £ billion1 (not seasonally adjusted) | ||||||||
| Net Borrowing | ||||||||
| Period | CG2 | LG3 | NFPCs4 | BoE5 | PSNB ex6 | PSND ex7 | PSND % of GDP | PSNCR ex8 |
| 2009/10 | 0.0 | 0.0 | 0.0 | 0.0 | 0.0 | 0.0 | 0.0 | 0.0 |
| 2010/11 | -0.1 | 0.0 | 0.0 | 0.0 | -0.1 | 0.0 | 0.0 | 0.0 |
| 2011/12 | -0.1 | 0.0 | 0.0 | 0.0 | -0.1 | 0.0 | 0.0 | 0.0 |
| 2012/13 | -0.3 | 0.0 | 0.0 | 0.0 | -0.3 | 0.0 | 0.0 | 0.0 |
| 2013/14 | -0.3 | 0.0 | 0.0 | 0.0 | -0.3 | 0.0 | 0.0 | 0.0 |
| 2014/15 | -0.4 | 0.0 | 0.0 | 0.0 | -0.4 | 0.4 | 0.0 | 0.0 |
| 2015/16 | 0.1 | 0.0 | 0.0 | 0.0 | 0.1 | -2.5 | -0.1 | 0.0 |
| 2016/17 | -3.5 | 0.1 | 0.0 | 0.0 | -3.3 | -2.0 | -0.1 | 0.0 |
| 2016 April | 0.0 | 0.0 | 0.0 | 0.0 | 0.0 | -1.3 | 0.0 | 0.0 |
| 2016 May | -0.1 | 0.0 | 0.0 | 0.0 | -0.1 | -3.2 | -0.1 | 0.0 |
| 2016 June | 0.2 | 0.0 | 0.0 | 0.0 | 0.1 | -3.3 | -0.2 | 0.0 |
| 2016 July | 0.2 | 0.0 | 0.0 | 0.0 | 0.2 | -3.1 | -0.2 | 0.0 |
| 2016 Aug | 0.2 | 0.0 | 0.0 | 0.0 | 0.2 | -3.0 | -0.1 | 0.0 |
| 2016 Sept | 0.1 | 0.0 | 0.0 | 0.0 | 0.1 | -4.4 | -0.2 | 0.0 |
| 2016 Oct | -0.1 | 0.0 | 0.0 | 0.0 | -0.1 | -4.5 | -0.3 | 0.0 |
| 2016 Nov | -0.2 | 0.0 | 0.0 | 0.0 | -0.2 | -4.6 | -0.2 | 0.0 |
| 2016 Dec | -0.6 | 0.0 | 0.0 | 0.0 | -0.6 | -4.4 | -0.2 | 0.0 |
| 2017 Jan | -0.6 | 0.0 | 0.0 | 0.0 | -0.6 | -4.6 | -0.3 | 0.0 |
| 2017 Feb | -0.5 | 0.0 | 0.0 | 0.0 | -0.4 | -4.6 | -0.2 | 0.0 |
| 2017 Mar | -2.2 | 0.2 | 0.0 | 0.0 | -2.0 | -2.0 | -0.1 | 0.0 |
| Source: Office for National Statistics | ||||||||
| Notes: | ||||||||
| 1. Unless otherwise stated. | ||||||||
| 2. Central government. | ||||||||
| 3. Local government. | ||||||||
| 4. Non-financial public corporations. | ||||||||
| 5. Bank of England. | ||||||||
| 6. Public sector net borrowing excluding public sector banks. | ||||||||
| 7. Public sector net debt excluding public sector banks. | ||||||||
| 8. Public sector cash requirement excluding public sector banks. | ||||||||
| 9. 2015 to 2016 represents financial year ending 2016 (April 2015 to March 2016). | ||||||||
Download this table Table 2: Revisions between this bulletin (May 2017) and the previous bulletin (April 2017)
.xls (36.9 kB)Revisions to net borrowing in the latest full financial year
Figure 11 compares the latest estimate of public sector net borrowing excluding public sector banks (PSNB ex) for the full financial year ending March 2017 (April 2016 to March 2017), with that presented in the previous bulletin (25 April 2017).
This presentation splits PSNB ex into each of its four sub-sectors: central government, local government, public corporations and Bank of England (BoE).
Given that, in the latest full financial year, £39.9 billion of the £48.7 billion borrowed by the public sector was borrowed by central government, a further breakdown of central government current receipts and current expenditure is presented to reflect the significance of these components.
Since the previous bulletin, the provisional estimate of central government net borrowing for the full financial year ending March 2017 has been revised down by £3.5 billion. Of this:
current receipts were revised upwards by £2.4 billion; VAT receipts were revised up by £1.7 billion between January and March 2017, largely due to higher than forecast cash receipts in April 2017; and Income Tax and National insurance contributions received in March were revised upwards by £0.5 billion and £0.3 billion respectively
current Expenditure was revised downward by £1.0 billion; largely due to a decrease of £0.6 billion in the expenditure on goods and services across the financial year
expenditure on capital spending (or net investment) was revised downwards by £0.1 billion
Revisions to net borrowing in earlier financial years
Central government receipts of taxes on production have been revised for the financial years ending March 2009 to March 2016 due to incorporating the latest data for business rates in Scotland and in Wales.
In most of the years, the figures have been revised up, but for the financial year ending March 2016, these receipts have been revised down. The largest revision of around £0.5 billion was for the financial year ending March 2015.
Revisions to net debt at the end of March 2017
Since the previous publication, the estimate of public sector net debt excluding public sector banks (PSND ex) recorded at the end of March has decreased by £2.0 billion due to improvements in our recording of central government liquid asset data (which is a component of net debt), relating to the recording of UKAR bank deposits with Bank of England (see section 3 of this bulletin).
Revisions to public sector banks data
This month, we have updated balance sheet data for public sector banks (now only Royal Bank of Scotland). These updates, extending from July 2016 to date, have resulted in revisions to both public sector net cash requirement and public sector net debt but have no impact on the “ex” measures.
The reporting of errors in the public sector finance dataset
It is important to note that revisions do not occur as a result of errors; errors lead to corrections and are identified as such when they occur.
There are no errors reported in this bulletin.
Figure 11: The latest estimate of public sector borrowing (excluding public sector banks) over the period April 2016 to March 2017, compared with that presented in the previous bulletin (25 April 2017)
Source: Office for National Statistics
Notes:
- PSNBex - Public sector net borrowing excluding public sector banks.
- CGNB - Central government net borrowing.
- LGNB - Local government net borrowing.
- PCNB - Non-financial public corporations' net borrowing.
- BoENB - Bank of England net borrowing.
- L&P - Land and property.
- I&W - Income and wealth.
- NICs - National insurance contributions.
- Contributions to EU - UK VAT, GNI and abatement contributions to the EU budget.
Download this image Figure 11: The latest estimate of public sector borrowing (excluding public sector banks) over the period April 2016 to March 2017, compared with that presented in the previous bulletin (25 April 2017)
.png (148.6 kB) .xls (68.1 kB)
11. International comparisons of borrowing and debt
The UK government debt and deficit for Eurostat statistical bulletin is published quarterly (in January, April, July and December each year), to coincide with when the UK and other EU member states are required to report on their deficit (or net borrowing) and debt to the European Commission.
On 18 April 2017, we published the latest UK government debt and deficit for Eurostat statistical bulletin, consistent with the February 2017 public sector finance bulletin (21 March 2017). In this publication we stated that:
general government gross debt was £1,731.4 billion at the end of December 2016, equivalent to 89.3% of gross domestic product (GDP); an increase of £65.4 billion on December 2015
general government deficit (or net borrowing) decreased by £24.2 billion to £57.2 billion (equivalent to 3.0% GDP) in 2016, compared with 2015
This bulletin presents a slightly revised estimate of deficit at £57.5 billion for 2016, while the estimate of debt at the end of December 2016 is unchanged.
It is important to note that the GDP measure, used as the denominator in the calculation of the debt ratios in the UK government debt and deficit for the Eurostat statistical bulletin, differs from that used within the public sector finances statistical bulletin.
An article, The use of GDP in public sector fiscal ratio statistics explains that for debt figures reported in the monthly public sector finances, a 12-month GDP total centred on the month is employed, while in the UK government debt and deficit for Eurostat statistical bulletin, the total GDP for the preceding 12 months is used.
Back to table of contents12. Quality and methodology
The public sector finances Quality and Methodology Information document contains important information on:
- the strengths and limitations of the data and how it compares with related data
- uses and users of the data
- how the output was created
- the quality of the output including the accuracy of the data
UK Statistics Authority assessment of public sector finances
On 8 November 2015, the UK Statistics Authority published its latest assessment report of public sector finances. The report confirmed the National Statistics status of the public sector finances bulletin subject to certain requirements being met.
In order to meet these requirements we published an article, Quality assurance of administrative data used in the UK public sector finances. This report provides an assessment of the administrative data sources used in the compilation of the public sector finance statistics in accordance with the UK Statistics Authority’s Administrative Data Quality Assurance Toolkit.
How are classification decisions made?
Each quarter we publish a forward workplan outlining the classification assessments we expect to undertake over the coming 12 months. To supplement this, each month a classifications update is published, which announces classification decisions made and includes expected implementation points (for different statistics) where possible.
Classification decisions are reflected in the public sector finances at the first available opportunity and, where necessary, outlined in this section of the statistical bulletin.
The Monthly statistics on the Public Sector Finances: A methodological guide was last updated in August 2012. We are currently working to update this publication in 2017.
Figures expressed as a ratio of gross domestic product
At the end of each financial year, while data for current budget deficit, net investment and net borrowing for the final quarter of the financial year (January to March) are available, gross domestic product (GDP) for the corresponding period is not. To enable us to publish estimates of these figures as ratios of GDP for the latest full financial year, the final quarter of the GDP denominator is estimated based on forecasts produced by the Office for Budget Responsibility (OBR).
This estimate of GDP will be used in the March, April and May publications and revised in the June publication when the published value of GDP becomes available.
Further details on classification decisions and data changes that impact on this (and future) publications
Green Investment Bank
On 20 April 2017, the government announced the sale of Green Investment Bank (GIB plc) to Macquarie Group Limited. The sale is expected to complete in around 2 months. The implications of this sale on public sector finances will be announced in due course.
Diverted Profits Tax
As of March 2017, total Corporation Tax includes Diverted Profits Tax (DPT). Although these are different taxes, they have been combined to prevent the publication of disclosive taxpayer information.
Blue Book 2017
In September 2017, the public sector finances will incorporate methodological improvements being implemented for the annual UK National Accounts publication, the Blue Book 2017. These improvements will include updated estimates for gross fixed capital formation (GFCF), specifically with regard to estimates for the cost of transfer of fixed assets (such as legal costs incurred at point of sale of a property) and the net acquisition of entertainment, literary and artistic originals (such as film and TV recordings).
The first of these improvements will not impact the fiscal aggregates for the financial year ending March 2015 onwards (either net investment or net borrowing), as public sector data sources already include expenditure on costs of transfer. There will be revisions for earlier financial years as a result of removing existing negative estimates of transfer costs.
The second of these improvements is expected to impact the public corporations sub-sector by both increasing net investment and decreasing current budget deficit by equal and offsetting amounts (expected to be less than £0.5 billion) in recent years, with no impact, therefore, on public sector net borrowing. It will not impact general government estimates.
We have published an article National Accounts articles: Impact of Blue Book 2017 changes on current price gross domestic product estimates, 1997 to 2012 explaining these methodological improvements in more detail.
Supporting documentation
Documentation supporting this publication is available in appendices to the bulletin.
- Appendix A – Public Sector Finances Tables 1 to 10
- Appendix B – Large impacts on public sector fiscal measures excluding financial intervention (one off events)
- Appendix C – Revisions analysis on several main components of the central government account (current receipts, current expenditure, net borrowing and net cash requirement)
- Appendix D – Public sector current receipts table
- Appendix E – Impact of the reclassification of housing associations into the public sector: the financial year ending March 2009 to the financial year ending March 2016
- Appendix F – Supplementary fiscal measures
- Appendix G – Revisions to the first reported estimate of financial-year-end public sector net borrowing (excluding public sector banks) by sub-sector
Public sector borrowing by sub-sector
Each month, at 9.30am on the working day following the public sector finance statistical bulletin, we publish Public sector finances borrowing by sub-sector. This release contains an extended breakdown of public sector borrowing in a matrix format and also estimates of Total Managed Expenditure (TME).
Back to table of contents