Table of contents
- Main points
- Acknowledgements and collaboration
- Things you need to know about this release
- Extent of urban space in the UK
- Extent of green and blue spaces in urban areas in Great Britain
- What is the condition of the green space in urban areas?
- What ecosystem services do urban areas provide?
- Provisioning services
- Regulating services
- Cultural services
- Future Urban Extent methodology
- Methodology by condition type
- Methodology by service type
1. Main points
The total annual value of cooling from green and blue space in 2017 in Great Britain was valued at £243.6 million in labour productivity savings and avoided air conditioning energy costs.
In 2017, the removal of air pollution by urban green and blue space in Great Britain equated to a saving of £162.6 million in associated health costs.
The amount of carbon removed by woodland in UK urban areas was estimated to be worth £89.0 million during 2017.
Noise mitigation by urban vegetation in the UK led to a saving of £14.4 million in avoided loss of quality of life years during 2017.
Recreation spent in nature in the UK urban environment was valued at £2.5 billion in 2017.
Urban areas represent an estimated 8% of the total UK land area.
2. Acknowledgements and collaboration

This publication is produced in partnership with the Department for Environment, Food and Rural Affairs (Defra). Further details about the natural capital accounting project are available.
The recently published 25 Year Environment Plan restated the government’s commitment to working with the Office for National Statistics (ONS) to develop a full set of natural capital accounts for the UK. Such accounts will help support the monitoring of progress under the plan as well as providing evidence and statistics to inform better decision-making as envisaged in the plan.
We would also like to thank Ordnance Survey for their hard work and contributions which made much of the urban accounts possible. The valuable contributions from Eftec and the Centre for Ecology and Hydrology (CEH) for their initial urban accounts scoping study and their extended work on the valuation of noise mitigation and urban cooling are also gratefully acknowledged.
Back to table of contents3. Things you need to know about this release
This bulletin is an update for the ecosystem accounts for urban areas. This forms part of the UK natural capital accounts being developed by the Department for Environment, Food and Rural Affairs (Defra) and the Office for National Statistics (ONS). This is the second iteration of the urban ecosystem account.
There are also two datasets attached to this article, one of which looks at the extent and type of green and blue spaces within urban areas in Great Britain. Another dataset will be provided that shows the time series for some of the ecosystem services provided in this bulletin.
All methods are continually improved upon as the natural capital accounts are developed, so remain in experimental status. Revisions to estimates in future releases are highly likely. The monetary accounts should be interpreted as a partial or minimum value of the services provided by the natural environment, as a number of ecosystem services, such as flood protection from natural resources, are not currently measured, and conservative assumptions are typically adopted where there is uncertainty.
Back to table of contents4. Extent of urban space in the UK
Throughout this bulletin, when talking about the UK’s urban extent, the urban extent account created by Eftec and others (2017) is used. This extent uses the Office for National Statistics (ONS) Built-Up Areas (2011) dataset, which defines urban as any area “irreversibly urban in character”1.
The Built-Up Areas (BUA) dataset is modified to include nature around the periphery of an urban site where high levels of interaction between people and nature are still expected, and to include larger areas of green space within urban environments, such as city parks and rivers.
More information on why the BUA (2011) dataset was chosen and how it was modified for use in the ecosystem accounts is available at Eftec and others (2017). There is ongoing work on looking at the UK urban extent, please see the future urban extent summary.
Figure 1 depicts the extent of the urban area using the BUA definition in the UK. According to Eftec and others (2017), the urban area covered 1,833,015 hectares, which is about 8% of the total land area.
Figure 1: Urban boundary defined by Eftec1 /CEH2 (2017) for DEFRA3 and ONS, 2011 to 2012
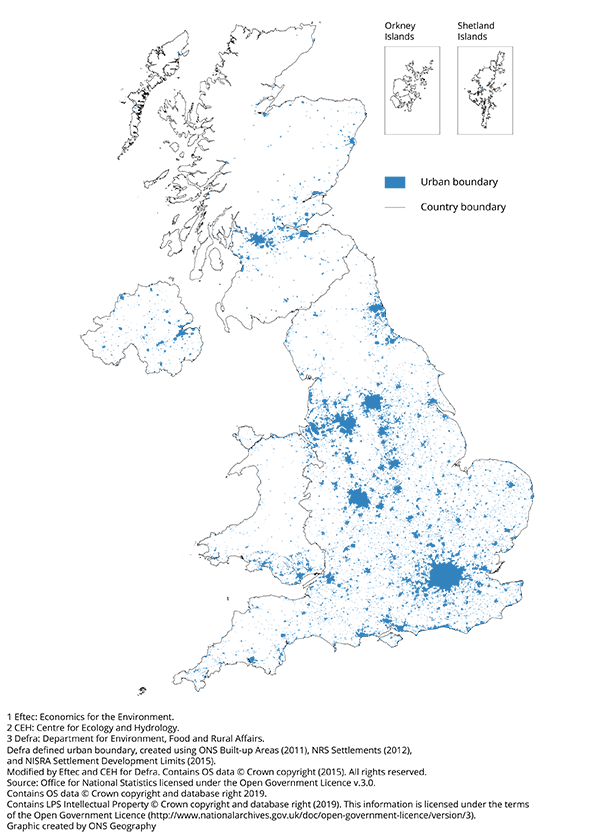
Source: Urban boundary defined by Eftec/CEH (2017) for Defra and ONS, 2011 to 2012, UK
Download this image Figure 1: Urban boundary defined by Eftec^1^ /CEH^2^ (2017) for DEFRA^3^ and ONS, 2011 to 2012
.png (279.9 kB)
However, during the development of this account, the UK extent defined by Eftec and others (2017) has been improved and slight alterations made, which can be explained in the methodology note. A shape file for this development will be available to download but please be aware that due to timings we were not able to use this extent in the rest of this account. This newly improved method will be used in future iterations of the urban account.
Habitats within the UK urban area using the Land Cover Map 2015
Within the urban boundaries in the UK are a range of habitats, see Table 1. The largest being enclosed farmland at 302,098 hectares, 16.5% of the total urban area.
Due to methodology changes in the Land Cover Map we are unable to compare change in area from the previous ONS urban publication. The previous publication was based on Land Cover Map 2007 and this publication uses data from the Land Cover Map 2015. Information on the methodology changes to the Land Cover Map 2015 can be found on the Centre for Ecology website.
| Aggregate Habitat | Area (hectares) |
|---|---|
| Coastal Margins | 6,880 |
| Enclosed Farmland | 302,098 |
| Freshwater | 11,414 |
| Marine | 1,860 |
| Mountain, Moorland, Heathland | 4,086 |
| Semi-natural Grassland | 13,351 |
| Woodland | 82,661 |
| Total | 422,350 |
| UK Urban Extent | 1,833,015 |
Download this table Table 1: Extent of urban area and broad habitats contained within it, UK, 2015
.xls .csvNotes for: Extent of urban space in the UK
- Further information about the BUA dataset can be found on the ONS geography portal.
5. Extent of green and blue spaces in urban areas in Great Britain
Outdoor green and blue space, such as parks, gardens, rivers and lakes are important for well-being. Through collaborative work between the Office for National Statistics (ONS) and the Ordnance Survey (OS), estimates for the extent of green space in urban areas have been developed. The estimates aim to complement those in Table 1 by providing more detail about the smaller areas of green space and their functionality, for example, what it is used for and if it is publicly accessible.
Although the estimates provided by OS aim to complement the Land Cover Map 2007 (LCM 2007) broad habitat metrics they are currently incompatible due to overlaps and differing timeframes for when measurements were taken. The remainder of the extent account refers to the OS estimations of green and blue space.
The OS Open Green Space Map (2019) and OS Mastermap Topography Layer were used in accordance with a modified ONS Built-Up Area map (2011) to calculate the areas of natural land cover and blue space.
Definitions of land cover, green and blue space
Natural land cover
Any land cover classified as being natural in type, for example, grassland, heath, scrub, orchards, coniferous trees and so on but does not include inland water bodies.
Functional green space
Any green space that has a specific function in its use, for example, public parks or gardens, playing fields, golf courses, allotments and so on. These spaces contain natural land cover, and can also include some blue space, for example, a park that has a lake within it.
Publicly accessible functional green space
A subset of functional green space, it removes green spaces expected to have restriction to entry, for example, golf courses. Restrictions to entry limits the ability of the green space to provide cultural services. Publicly accessible green space is defined in Table 2.
Blue space
All inland water bodies, for example, rivers, lakes, ponds, canals and so on.
| Publicly accessible | Non-publicly accessible |
|---|---|
| Parks and public gardens | Golf course |
| Playing fields | Allotments and growing spaces |
| Cemetery | Bowling green |
| Religious grounds | Other sports facility (for example cricket ground) |
Download this table Table 2: Defining publicly and non-publicly accessible functional green space
.xls .csvHow much green space is there in urban areas?
There are approximately 1.77 million hectares of urban area in Great Britain. Of these, 0.54 million hectares are classified as natural land cover (30.7%), compared with 0.53 million (31.0%) in 2017. As shown in Table 3, on average Scotland has the greenest urban areas (36.4%).
On average, 23.3% of natural land cover in urban areas has a specific function, for example, a park or bowling green. England has a greater proportion of functional green space relative to urban natural land cover (23.8%), this compares with 22.9% in Scotland and 15.9% in Wales. Although, as shown in Table 3, due to having greener urban spaces, Scotland has more functional green space relative to urban area (8.3%).
Of all functional green space area, 67.9% is publicly accessible in Great Britain, made up of parks and gardens (51.3%), playing fields (33.1%), cemeteries (8.9%), and religious grounds (6.7%). In Wales, 69.9% of functional green space is publicly accessible, higher than England and Scotland with 68.4% and 64.2% respectively.
| England | Scotland | Wales | Great Britain | |
|---|---|---|---|---|
| Extent (hectares) | ||||
| Urban area | 1,502,015 | 176,009 | 90,535 | 1,768,560 |
| Natural land cover | 451,225 | 64,025 | 27,337 | 542,588 |
| Blue space | 17,694 | 2,462 | 982 | 21,138 |
| Functional green space | 107,388 | 14,663 | 4,351 | 126,402 |
| Publicly accessible green space | 73,400 | 9,407 | 3,041 | 85,847 |
| Proportion of urban area (%) | ||||
| Natural land cover | 30.00% | 36.40% | 30.20% | 30.70% |
| Blue space | 1.20% | 1.40% | 1.10% | 1.20% |
| Functional green space | 7.10% | 8.30% | 4.80% | 7.10% |
| Publicly accessible green space | 4.90% | 5.30% | 3.40% | 4.90% |
| Number of sites | ||||
| Functional green space | 56,420 | 6,303 | 3,988 | 66,708 |
| Publicly accessible green space | 36,627 | 4,173 | 2,754 | 43,551 |
Download this table Table 3: Extent of urban green spaces in 2019, Great Britain
.xls .csvFigure 2 presents types of functional green space in Great Britain. Specific functions vary, but public parks and gardens account for the largest proportion of green space in terms of area (44,040 hectares), yet more individual sites are classified as playing fields (15,899), closely followed by religious grounds (14,319).
Religious grounds are high in number but tend to be small in size. The average area of a religious ground in Great Britain is 0.4 hectares, larger only than the average bowling green (0.3 hectares). The sites with the largest average area are golf courses (9.3 hectares), public parks or gardens (4.7 hectares), and other sports facilities (2.0 hectares).
Figure 2: Parks and playing fields represent the majority of functional green space area
Extent of functional green space (hectares) by type of function and number of sites, Great Britain, 2019
Source: Ordnance Survey
Download this chart Figure 2: Parks and playing fields represent the majority of functional green space area
Image .csv .xlsHow does green space extent vary by region?
Figure 3 depicts the percentage of urban natural land cover in the 10 largest associated built-up areas, by residential addresses, in Great Britain. The associated built-up area (BUA) with the largest proportion of urban natural land cover is West Yorkshire (which consists of Leeds, Bradford, Huddersfield and Wakefield), where 45.8% of the urban area consists of natural land cover. Liverpool has a smaller proportion of natural land cover (27.4%).
Figure 3: West Yorkshire is the greenest of the 10 largest associated built-up areas by number of residential addresses
Percentage of urban area comprised of natural land cover, Great Britain 2019
Source: Ordnance Survey
Download this chart Figure 3: West Yorkshire is the greenest of the 10 largest associated built-up areas by number of residential addresses
Image .csv .xlsPrivate outdoor space
Residential gardens provide outdoor space and the potential for private green and blue space, potentially offering a range of ecosystem services, for example, recreation, noise mitigation and food if homegrown.
Using Ordnance Survey maps it has been possible to estimate the extent of private outdoor space. It is estimated by extracting the size of property plots in Great Britain and removing the size of buildings in the plot, the residual is assumed to be outdoor space. These estimates include both front and back gardens, but currently do not tell us anything about natural land covering these spaces. For example, a garden could comprise grass and hedgerows or could be paved with a fence.
Following work from the Data Science Campus, Office for National Statistics, it was estimated that 62% of garden space in Great Britain could be vegetation. However, further work is needed to make this estimate more accurate in order to be able to look at different regions.
Approximately 520 thousand hectares of residential garden exist in urban areas in Great Britain, accounting for 29.5% of the total urban area, down from 29.9% in 2017. England has the largest proportion of urban area attributed to residential gardens (30.1%). Scotland, which had the highest proportion of natural land cover, has the smallest proportion of residential garden area (24.9%).
| England | Scotland | Wales | Great Britain | |
|---|---|---|---|---|
| Built-up area (hectares) | 1,502,015 | 176,009 | 90,535 | 1,768,560 |
| Residential garden (hectares) | 452,397 | 43,841 | 25,633 | 521,872 |
| Percentage of urban area comprised of residential gardens (%) | 30.1 | 24.9 | 28.3 | 29.5 |
Download this table Table 4: Extent of urban residential gardens and proportion of total urban area, Great Britain, 2019
.xls .csv6. What is the condition of the green space in urban areas?
Urban green and blue space can be made up of broader habitat types, including woodland and enclosed farmland. The green and blue space reported in these accounts overlap with existing and developing ecosystem accounts for each of these broad habitats, such as woodland, farmland and freshwater accounts.
Because of this overlap, identifying and measuring condition indicators for urban ecosystems is not straightforward, as condition indicators may differ according to the nature of the habitat. As a result, two aggregated indicators providing a sense of overall condition rather than specific dimensions were chosen, condition of sites of special scientific interest (SSSI) sites and number of sites awarded Green Flag status. Functionality of green space is important in highly populated urban areas, therefore accessibility to green space is also included.
Biodiversity indices including looking at the number of mammals and birds in the urban area are included in this iteration. However, further work is needed to establish other indicators (for example, soil indicators, ecological condition indicators, spatial configuration, air quality and management practices) that could be used in this account.
Condition of sites of special scientific interest (SSSI) within built-up areas
Sites of special scientific interest of land (SSSI) are protected by law to conserve wildlife or geology. For England, Scotland and Wales the spatial condition of SSSI sites is collected and some overlap with urban areas providing an indicator of condition of both urban green and blue spaces. No condition data were available for Northern Ireland areas of special scientific interest (ASSI).
When conducting this analysis, the most up-to-date data were used for each of the four countries1.
Due to the differences in the dates that the latest condition was assessed we are unable to directly compare between the countries.
As known in January 2019, an estimated 11,653 hectares of SSSIs fell within the UK’s urban boundary. England contained up to 83% of the area of SSSIs that fell in the UK urban boundary (see Table 5).
| England¹ | Northern Ireland² | Scotland³ | Wales⁴ | UK | ||
|---|---|---|---|---|---|---|
| Condition⁵ | Number of sites | 3,385 | NA | 483 | NA | NA |
| Extent (hectares) | 9,685 | 220 | 1,174 | 574 | 11,653 | |
| Favourable | 45% | NA | 69% | 44% | NA | |
| Unfavourable | 53% | NA | 27% | 55% | NA | |
| Destroyed/Partially destroyed | 1% | NA | 1% | NA | NA | |
| No condition stated | 1% | NA | 3% | 1% | NA |
Download this table Table 5: Breakdown by country of urban sites of special scientific interest and areas of special scientific interest condition and extent as known at January 2019, UK
.xls .csvAs reported in January 2019, the extent of SSSIs in England’s urban areas was 9,685 hectares, which is a slight increase to that observed in May 2018 (9,590 hectares)2. When looking at the condition of the SSSI sites, 45% were considered in favourable condition, whereas over half of these sites were registered as in an unfavourable condition3 (see Table 5). Again, the extent and condition of sites have not changed much from those observed in May 2018. When comparing this to all SSSIs in England, this is not much different, with 51% of sites registered as unfavourable.
The data from Natural England also allow us to look at the sites that fall completely within the Office for National Statistics (ONS)-defined urban boundary and the condition of these sites are shown in Table 6. In January 2019, only 41% of SSSIs that fell within England’s urban boundary were reported as in favourable condition, whilst 56% were registered as unfavourable.
| No of SSSI's that fall completely in England's urban areas | Condition | |||||
|---|---|---|---|---|---|---|
| Favourable | Unfavourable¹ | Destroyed or partly destroyed | Blank | |||
| January 2019 | 515 | 41% | 56% | 2% | 1% | |
Download this table Table 6: Over half of sites of special scientific interests that fall completely within England’s urban boundary were reported as unfavourable or destroyed/partly destroyed
.xls .csvAs of December 2018, the extent of SSSIs in urban areas in Scotland was 1,174 hectares, this is slightly higher than the extent as known in May 2018 (1,170 hectares, which is based on information in 2010). Since 2010, the number of total SSSI sites in Scotland has increased by 5.1% from 5,122 to 5,384 sites in 2018.
Looking at the condition of those sites that fall within urban areas, 69% were recorded as in favourable condition, while 27% were reported as unfavourable. The condition statuses are similar to those reported in the June 2018 report.
When comparing with the condition of all SSSIs in Scotland, again the story is similar, with 20% being reported as unfavourable and 71% in favourable condition. Therefore, this indicates that generally SSSIs in Scotland are kept in better condition than those in both Wales and England.
However, it is important to highlight that for Scotland SSSIs there is no efficient or reliable way of separating out which features (that is, invertebrates, woodland, wetlands, and so on) fall within the urban boundary, so in this analysis all features are included. Therefore, these numbers should be interpreted as the condition of SSSIs where any part of the SSSI falls within Scotland’s urban areas.
13% of public parks or gardens in Great Britain’s urban areas were awarded a Green Flag
The Green Flag Award is designed to recognise and reward well-managed parks and green spaces and aims to set the standard for the management of recreational outdoor spaces. The main purpose of the award is to ensure that everybody has access to green spaces and that these spaces are appropriately managed to enable people to live healthier lifestyles. Further details about the aim and purpose of the Green Flag Awards are given on the Green Flag Award Website.
To be awarded Green Flag status, sites are judged on 27 criteria split between eight different sections some of which are included in the categories of condition indicators identified separately by both Eftec (2017) and Natural England. These eight sections include:
- a welcoming place
- healthy, safe and secure
- well-maintained and clean
- environmental management
- biodiversity, landscape and heritage
- community involvement
- marketing and communication
- management
Table 7 shows the number of sites awarded Green Flag status for each country in Great Britain’s urban areas for 2018. Only 13% of public parks or gardens were awarded Green Flag status in 2018, with England representing the greatest percentage (14%), while only 6% of public parks or gardens in Scottish urban areas were awarded Green Flag status.
The number of Green Flag awards awarded to parks or gardens in Great Britain’s urban areas increased by 3.8% from 1,133 awards in 2017 to 1,176 in 2018, with Wales seeing the biggest increase (10.6%) from 47 to 52 Green Flag awards.4
| England | Scotland | Wales | Great Britain | |
|---|---|---|---|---|
| Number of Green Flag Awarded sites in urban areas | 1,062 | 62 | 52 | 1,176 |
| % of public parks or gardens with Green Flag status | 14% | 6% | 13% | 13% |
| Total public parks or gardens in urban areas | 7,828 | 1,056 | 393 | 9,276 |
Download this table Table 7: England’s urban areas had the most public parks or gardens with Green Flag award status
.xls .csvIn 2018, there was a total of 1,362 Green Flag Awards given to public parks or gardens in England, with over three-quarters of these falling within England’s urban extent. This was similar to Scotland, with 86% of Green Flag Awards being awarded to public parks or gardens in urban areas. Meanwhile, just over half of Green Flag Awards were awarded to public parks or gardens in Welsh urban areas.
Green Flag Awards give us an indication of the condition of public parks or gardens in Great Britain’s urban areas. The condition of a park can potentially have impacts on other ecosystem services such as recreation and maybe urban cooling, these are explained in the Ecosystem services section.
It is important to note that although the Green Flag Awards are a good indicator of the condition of public parks or gardens, organisations or individuals have to apply for them. Therefore, there are potentially some public parks or gardens that are in good condition but have not applied for a Green Flag Award.
Across Great Britain, there was an average 1.7 access points per hectare of functional green space in 2019
For the public to enjoy outdoor spaces they need to be within a reasonable distance of their homes and accessible. Accessibility of green spaces is therefore an important measure of the supply of cultural services like outdoor recreation.
In these accounts we rely upon the Ordnance Survey Green Space Map, which provides information about the number of access points available for functional green space in urban areas in Great Britain. This provides a basic indicator of the accessibility of green spaces within the urban environment. The Ordnance Survey Open Green Space Map is updated continuously so these numbers can be updated in future iterations.
The country with the greatest number of access points to urban green space is Wales, with the data indicating an average of 2.5 access points per hectare of functional green space. Meanwhile, urban areas in England only had 1.6 access points per hectare of functional green space. Due to improvements made to the Ordnance Survey Green Space Map we are unable to compare 2019 data with previously published data; therefore no time series will be analysed in this iteration.
An improved measure of accessibility is in development at the moment, which will look at the percentage of households, schools and workplaces within a certain distance of at least a certain amount of green space. This work will be included in future iterations.
| Urban Access Points | England | Scotland | Wales | Great Britain |
|---|---|---|---|---|
| Total access points per hectare of functional greenspace | 1.6 | 1.6 | 2.5 | 1.7 |
| Total access points | 174,083 | 23,619 | 11,027 | 208,729 |
| Functional Greenspace | 107,388 | 14,663 | 4,351 | 126,402 |
Download this table Table 8: Total number of access points for functional green space per hectare, Great Britain, 2019
.xls .csvSpecies composition and diversity of biodiversity in urban areas
Measuring the species composition and diversity of biodiversity provides an important indicator of the condition of the urban environment. In this section we make use of two long-term datasets, one on mammals and the other birds, to provide indicators of the health of urban wildlife populations.
Urban bird species have declined by 15% overall between 2005 and 2017
In the UK, 27 bird species have been identified as “urban” using the England Biodiversity Strategy (EBS), this list includes blackbirds, blackcaps and blue tits (for a full list please see the Urban birds section in the methodology.
Using data from the British Trust for Ornithology (BTO) Survey, an geometric mean index was calculated for the 27 bird species and this is shown in Figure 4 (again for more information on how the index was created see the methodology section.
While these figures may provide a general indication of major changes in abundance over time, they do not provide a statistically robust measure of such changes because they do not take account of the Breeding Birds Survey (BBS) sampling strategy or of temporal variation in the sample of squares surveyed.
Bird species in urban areas fluctuated between the years 1994 and 2017 (Figure 4). The number of sightings of urban birds peaked in 2005, with urban bird species increasing by 19% compared with 2004. But since 2005, urban bird species have fallen by 15% to 2017.
Figure 4: In 2017, urban bird species have increased by 5% compared with the base year 1994 but fallen 15% from the 2005 high
Urban bird species, UK, 1994 to 2017
Source: British Trust for Ornithology
Download this chart Figure 4: In 2017, urban bird species have increased by 5% compared with the base year 1994 but fallen 15% from the 2005 high
Image .csv .xlsThe trends for urban specialist birds are less encouraging. For birds such as the house sparrow, collared dove, house martin and swift, the indices showed a decline in numbers during 2017 compared with the base year 1994 (see Figure 5). That said, collared doves have only shown a slight decline in the most recent years, with their numbers increasing until 2013 before declining.
Swift numbers have fallen by nearly 60% in 2017, with evidence showing that many established swift colonies are being lost through building demolition, renovation and roof repair. Meanwhile, there was a decline in house sparrows by 18%, which some evidence attributes to air pollution and a lack of food in urban areas as well as an increase in the mosquito-borne disease called avian malaria.
Figure 5: Urban specialists all showed a decline in numbers in 2017 compared with 1994, with swift numbers almost 60% lower than in 1994
Urban bird species, UK, 1994 to 2017
Source: British Trust for Ornithology
Notes:
We have removed 2001 from the analysis due to foot and month disease which caused decreased sightings for bird species.
Download this chart Figure 5: Urban specialists all showed a decline in numbers in 2017 compared with 1994, with swift numbers almost 60% lower than in 1994
Image .csv .xlsThe number of mammal counts in urban areas increased by 17% overall between 2004 and 2015
The Living with Mammals survey (LwM) started in 2003, with the aim of producing effort-based indices of mammal abundance across the built environment and has run annually ever since. Its geographical focus on homes, longevity and quantitative measures means the outputs lend themselves more readily to the ONS urban natural capital account than other indictors.
They also enable us to look specifically at counts in areas defined for the urban accounts. Although count data does not indicate the population or species richness of mammals, it gives an indication of whether the number observed has gone up or down.
While count data implies changes in the underlying population size we must be cautious not to over-interpret these figures. Even if count data are proportional to the population we cannot see the functional relationship and alternative factors can drive visibility of species. For more information on how the effort-based indices were created and which species were included in the survey please see the Living with Mammals survey section in the methodology.
The combined index showed overall that the counts of mammal species in Great Britain’s urban areas increased by 17% in 2015 compared with 2004 (see Figure 6). However, as will be explained further in the text, some mammals’ counts have not increased. In recent years there has been no significant change in the overall number of counts. Despite the positive increase in 2015 compared with 2004 for urban areas overall, in the UK, mammal species have not done so well with a review published by Natural England showing a greater number of native mammals decreasing rather than increasing since 1995.
Throughout this section the charts’ upper and lower confidence intervals refer to the 95% confidence interval.
Figure 6: In 2015, the combined all species index increased by 17% and showed no significant change in recent years
Number of mammal species, Great Britain, 2004 to 2017
Source: People’s Trust for Endangered Species
Download this chart Figure 6: In 2015, the combined all species index increased by 17% and showed no significant change in recent years
Image .csv .xlsAlthough the overall index shows a positive trend for the counts of mammal species in 2015 compared with 2004, some mammal species have not done as well as other species (see Figure 7).
Figure 7 shows the species that showed a significant change between 2004 and 2015. Compared with 2004, the counts of hedgehogs have declined by over a quarter in 2015, while the counts of grey squirrels have fallen by a tenth. Meanwhile, roe deer, badgers and brown rats all increased in counts compared with 2004, with roe deer counts rising by over 80%, while badger counts increased by almost two-thirds.
Figure 7: Compared with 2004, Roe deer, badgers and brown rats counts all increased in 2015, while hedgehogs declined by over a quarter
Mammal species in urban areas, Great Britain, 2004 and 2015
Source: People’s Trust for Endangered Species
Download this chart Figure 7: Compared with 2004, Roe deer, badgers and brown rats counts all increased in 2015, while hedgehogs declined by over a quarter
Image .csv .xlsSome trends for three of the species that have shown a significant change in counts in urban areas follow.
Hedgehog counts in urban areas in all years (except 2016 and 2017) declined compared with 2004 (see Figure 8). A decrease in the abundance of hedgehogs has also been documented by A review of the population and conservation status of British mammals published in June 2018 by Natural England.
Figure 8: Hedgehog counts show a significant decline in most years compared with 2004
Number of hedgehogs in urban areas, Great Britain, 2004 to 2017
Source: People’s Trust for Endangered Species
Download this chart Figure 8: Hedgehog counts show a significant decline in most years compared with 2004
Image .csv .xlsMeanwhile, badgers showed a significant increase in counts in the years between 2010 and 2017 compared with 2004 (see Figure 9).
Figure 9: Badger numbers have increased significantly since 2010
Number of badgers in urban areas, Great Britain, 2004 to 2017
Source: People’s Trust for Endangered Species
Download this chart Figure 9: Badger numbers have increased significantly since 2010
Image .csv .xlsGrey squirrels in urban areas have shown a significant decline in every year (except 2017) compared with 2004. The sharpest decline was in 2007, where the counts of squirrels dropped by 11.3% compared with 2004 though the counts hold relatively steady from that point.
Figure 10: Grey squirrels in Great Britain urban areas have declined by nearly 10% in 2016 compared with 2004
Number of grey squirrels in urban areas, Great Britain, 2004 to 2017
Source: People’s Trust for Endangered Species
Download this chart Figure 10: Grey squirrels in Great Britain urban areas have declined by nearly 10% in 2016 compared with 2004
Image .csv .xlsNotes for: What is the condition of the green space in urban areas?
Data for the extent of Northern Ireland was reported on 3 October 2016, Scotland on 20 December 2018, Wales on 12 December 2018. Data for the condition of SSSI’s in Scotland was reported on the 17 January 2019. Data for the condition for Wales was last known in November 2017. Data for the extent and condition of SSSI’s in England was reported on 4 January 2019.
We cannot say for certain whether this is an actual increase in the extent of SSSI’s in England due to inconsistencies, but this has been noted and will be looked at in future iterations.
When looking at the condition of all the SSSI sites that fall within the urban boundary, it is important to note that not all of the SSSI unit will actually fall within the urban boundary and some will overlap the urban boundary. For example, Downe Bank and High Elms SSSI in Greater London has about 4% of its extent within the ONS-defined urban area.
The percentage of public parks or gardens with Green Flag status published in last year’s publication cannot be compared with this year. This is because of methodological improvements made by Ordnance Survey in capturing the numbers of public parks or gardens in Great Britain.
7. What ecosystem services do urban areas provide?
This section assesses the contribution of the services nature in urban areas provides to the economy and society, capturing the flow of services in monetary and non-monetary units.
Currently the services accounts are partial and there are other services provided but not captured in the accounts. The Common International Classification of Ecosystem Services (CICES version 5.1) is followed, which uses the familiar practice of splitting the services into provisioning, regulating and cultural services. Table 9 presents the services captured in this release.
The estimates presented are initial and highly experimental. It can be difficult to measure with precision the services nature provides to society. Many services, especially regulating services will depend on highly localised features (for example, climate and topological as well as the precise structure and nature of the vegetation), which may not be readily modelled at a national scale. For more information on the techniques used and the difficulties with measuring ecosystem services please see the principles paper.
| Description | Provisioning | Regulating | Cultural |
|---|---|---|---|
| Products such as food, water, fibre and fuel | Services such as water purification, climate regulation, noise and air pollution reduction and flood hazard reduction | Non-material services, for example recreational enjoyment and aesthetic experience | |
| Goods and Services Included | Included | Included | Included |
| Food - Allotments | Carbon Sequestration | Recreation (day trips by UK residents) | |
| Air filtration | Aesthetic interactions | ||
| Noise regulation | Physical health | ||
| Urban cooling | |||
| Goods and Services not included | Not included | Not included | Not included |
| Fish caught | Waste water cleaning | Scientific and educational interactions | |
| Wild plants and animals | Mediation of smell and visual pollution, solid wastes | Heritage interactions | |
| Water provisioning | Flood, erosion and landslide protection, water flow control | Symbolism of certain plants and animals | |
| Materials, including minerals and timber | Lifecycle regulation | Value placed on nature simply existing | |
| Energy production | Water condition regulation | Overnight visits and visits by non-residents | |
| Mental health |
Download this table Table 9: Services included in this publication¹
.xls .csv⁷The breakdown provided has been adapted from the Common Classification of Ecosystem Services (CICES) developed by the European Environment Agency.
Back to table of contents8. Provisioning services
Allotments
Community gardens and allotments enable food production in the urban area, although on a small scale.
In the previous iteration of this report, data was taken from an Eftec and others (2017) report on UK urban natural capital. However, new, more accurate and timely data have since been obtained.
Using satellite data, Ordnance Survey estimated the area of community gardens and allotments within Great Britain’s urban habitat area at 7,925 hectares in 2019, therefore there are an estimated 316,998 allotment plots currently within Great Britain’s urban areas. We estimate that the total production of food, from community gardens and allotments, is 154,000 thousand kilogrammes a year.
Using data from capital growth 2016 (PDF, 4.45MB), the estimated value of allotment output is £294 million. There is a cost to producing that output, but allotments are run for recreational benefits and rarely as part of a subsistence lifestyle. We could therefore add the cost of production as a form of recreational value but for now we do not.
If we took to ratio of output to resource rent based on UK agriculture, the resource rent of allotments would be £30.4 million. However, allotments differ considerably from large-scale agriculture and significant input costs, such as labour, could be considered a recreational benefit from allotments. For more information on how we calculated these numbers please see the Methodology section.
At present, it has not been possible to obtain a time series of data for the extent of allotment plots. However, for future iterations of this report it will be possible to build up a time series and to determine whether or not the yield from allotment plots has been increasing and therefore whether or not the value has been increasing.
Back to table of contents9. Regulating services
The amount of carbon removed by woodland in UK urban areas was estimated to be worth £89.0 million during 2017 Vegetation within the urban environment removes carbon from the atmosphere via a process known as photosynthesis. Using data from Forest Research, which measures woodlands and tree cover outside woodland, it was estimated that urban woodland makes up around 7.5% (286,500 hectares) of total woodland in Great Britain.
Using this figure, the Office for National Statistics can estimate how much carbon was sequestrated by urban woodlands in the UK. For more information on how the ONS calculated this please see carbon sequestration in the Methodology section.
Carbon sequestrated by urban woodland has declined since 2010 from 1,463,000 tonnes in 2010 to 1,366,000 tonnes in 2017. Meanwhile, since 2014, carbon sequestration by woodland in urban areas has remained broadly stable (see Figure 11).
Figure 11: Carbon sequestration in UK urban areas stabilised in recent years
Carbon sequestration for woodland in UK urban areas, 2010 to 2017
Source: Office for National Statistics, Forest Research and National Atmospheric Emissions Inventory (NAEI)
Download this chart Figure 11: Carbon sequestration in UK urban areas stabilised in recent years
Image .csv .xlsThe annual value of this service has generally increased year-on-year between 2010 and 2017 reaching a high of £88.95 million in 2017 (see Figure 12). This is due to increases in the non-traded carbon prices (11% over this period), which is estimated to keep increasing until 2080. Subsequently, the asset value of carbon sequestrated in urban areas was estimated to increase year-on-year, reaching £4,616.58 million in 2017.
Figure 12: Carbon removed by UK urban woodland was estimated to be worth £88.95 million in 2017
Annual value of regulating services, UK urban woodland, 2010 to 2017
Source: Office for National Statistics, Department for Business, Energy and Industrial Strategy
Download this chart Figure 12: Carbon removed by UK urban woodland was estimated to be worth £88.95 million in 2017
Image .csv .xlsRecent research by Forest Research has shown how the management of urban forests (selection of trees planted, how trees are maintained and so on) can have an impact on the amount of ecosystem services provided by trees such as carbon sequestration. Their results show that healthy large trees are shown to provide the greatest quantities of ecosystem services per tree. With this research, it helps to inform forestry decision-making to achieve greater benefits from urban trees.
The removal of pollution by urban green and blue space in Great Britain equated to a saving of £162.6 million in health costs in 2017
The World Health Organization estimated that air pollution contributed to 7.6% of all deaths in 2016. Vegetation in urban green and blue spaces can play a useful role in mitigating this danger by removing air pollution.
This physical flow account estimates the quantity of pollutants removed from the atmosphere by urban vegetation such as woodland and grassland1. In 2017, urban green and blue space in Great Britain removed 27,900 tonnes of PM10, SO2, NO, NH3 and O3 (excludes PM2.5 as a subset of PM10). Ground-level ozone (O3) represented the majority of total pollution removal (79.1%) in 2017 (Figure 13).
However, the most harmful pollutant is PM2.5 (fine particulate matter with a diameter of less than 2.5 micrometres, or 3% of the diameter of a human hair), which can bypass the nose and throat to penetrate deep into the lungs, leading to potentially serious health effects and healthcare costs. This can be seen in Figure 14, with the removal of PM2.5 accounting for over 70% of the total avoided health costs in 2017.
Figure 13: Urban woodland removed the most harmful pollutant PM2.5 during 2017
Pollutant removed by habitat, urban green and blue space in Great Britain, 2017
Source: Office for National Statistics and Centre for Ecology and Hydrology
Download this chart Figure 13: Urban woodland removed the most harmful pollutant PM2.5 during 2017
Image .csv .xlsIt is estimated that in 2017, the avoided health costs in the form of avoided deaths, avoided life years lost, fewer respiratory hospital admissions, and fewer cardiovascular hospital admissions amounted to a substantial £162.6 million2. Although the removal of PM2.5 represents only 3.5% of total pollution removed, over 70% of the avoided health impacts are due to reductions in PM2.5 concentrations caused primarily by urban woodland (see Figure 13).
Most of the remaining health value is due to NO2 removal, which is removed mainly by urban grassland (see Figure 13). When partitioned by health impact, the greatest value comes from avoided loss of life years lost (£153.0 million). The long-term asset value of urban natural capital calculated over a 100-year period with income uplift and population growth, is £6.3 billion for 2017.
Figure 14: The removal of PM2.5 made up over 70% of total avoided health costs in 2017 due to air pollutant removal
Avoided health costs from the removal of pollutants in 2017, (£ million, 2017 prices)
Source: Office for National Statistics and Centre for Ecology and Hydrology
Download this chart Figure 14: The removal of PM2.5 made up over 70% of total avoided health costs in 2017 due to air pollutant removal
Image .csv .xlsThe health benefits from the removal of air pollutants by urban green and blue space have an equivalent value of approximately 14% of the estimate for UK vegetation, which could be viewed as greater than expected considering 70% of urban areas are buildings, sealed surfaces and mixed surfaces.
There are three main reasons for this. Firstly, urban green and blue space reduces air pollution concentrations in neighbouring areas outside of the urban extent. Secondly, the majority of the UK population reside in urban areas, therefore the population benefiting from reduced exposure to air pollutants due to pollution removal by urban vegetation is much larger. Thirdly, PM2.5 (the most harmful pollutant) concentrations are higher in the populated south-east, and the rate of PM2.5 removal is greater at higher concentrations.
In 2017, the industry sector that produced the most PM2.5 and PM10 was the consumer expenditure sector, which produced 50% and 35% of total PM2.5 and PM10 emissions (excluding natural world), respectively. For more information on which sectors produce PM2.5 and PM10 see the environmental accounts Atmospheric emissions: other pollutants by industry and gas.
Cooling by urban green and blue spaces led to an estimated saving in £244 million in avoided labour productivity and air conditioning energy costs during 2017
Green and blue space (rivers, lakes, canals) can cool urban environments, which benefits the economy by mitigating labour productivity loss and reducing artificial cooling (air conditioning).
Eftec and others (2018) estimated the cooling benefit provided by natural capital in urban environments for 11 city regions3 in the UK in aggregate by individual land cover types as shown in Table 10. This benefit is assumed to be felt over the whole urban area.
The method used enables a consistent nationwide approach, but this means there are some limitations, for example, some elements of urban blue space and green space have not been valued, that is, street trees. For a full list of the caveats please see page 32 in the scoping study produced by Eftec and others in 2018.
As can be seen from Table 9, the aggregate cooling effect varies between negative 0.63 and negative 0.88 degrees Celsius, with green space providing a greater cooling effect than blue space.
The city with the greatest cooling effect combined was the Edinburgh City Region (0.88 degrees Celsius) due to the region having the greatest amount of woodland relative to the size of the urban area. Meanwhile, the Liverpool City Region had the lowest annual cooling effect with the least amount of woodland relative to the size of the urban area.
The cooling effect is only part of the monetary account service calculation, other important factors are the number of hot days4 and the size of the region’s economy as will be explained further in this section.
| Combined | Woodland | Parks/grass | Gardens | Rivers/canals | |
|---|---|---|---|---|---|
| Cardiff City Region | -0.71 | -0.23 | -0.2 | -0.26 | -0.01 |
| Edinburgh City Region | -0.88 | -0.39 | -0.24 | -0.24 | -0.01 |
| Glasgow City Region | -0.8 | -0.32 | -0.22 | -0.24 | -0.02 |
| Greater Manchester City Region | -0.75 | -0.24 | -0.27 | -0.22 | -0.01 |
| Liverpool City Region | -0.63 | -0.15 | -0.19 | -0.28 | -0.01 |
| London City Region | -0.72 | -0.25 | -0.21 | -0.24 | -0.02 |
| North East City Region | -0.65 | -0.17 | -0.22 | -0.25 | -0.02 |
| Sheffield City Region | -0.73 | -0.23 | -0.2 | -0.29 | -0.01 |
| West Midlands City Region | -0.72 | -0.21 | -0.21 | -0.28 | -0.01 |
| West of England City Region | -0.69 | -0.19 | -0.19 | -0.29 | -0.01 |
| West Yorkshire City Region | -0.83 | -0.28 | -0.32 | -0.22 | -0.01 |
Download this table Table 10: Average annual cooling effect of green space and blue space in each of Great Britain’s city regions (degrees Celsius)
.xls .csvIt should be noted that the cooling effects may be conservative and the cooling effect of the blue space features is likely to be underestimated. Furthermore, the approach does not account for the locally felt cooling effects (for example, shading by street trees) and impacts on local beneficiaries.
The monetary account measures the value of the cooling effect in pounds. The cooling effect is monetised through the estimated cost savings from air conditioning and the benefit from improved labour productivity. The benefit from improved labour productivity makes up most of the value, with avoided air conditioning energy costs only accounting for a small fraction.
This is assessed by non-financial business sectors, based on averaging temperature mitigation across urban areas, and applying temperature-output loss functions to estimate the gross value added (GVA) that would have been lost due to heat in the absence of the cooling effect, accounting for adaptation behaviors5.
Additionally, avoided air conditioning energy costs are based on estimates in London and extrapolated to other city regions. To extrapolate to other city regions, data on the relative air conditioned office space and percentage green space in other regions are used. This figure is more tentative. The value of the service will fluctuate year-to-year reflecting the number of hot days (defined as over 28 degrees Celsius) experienced.
Table 11 shows the total annual value of labour productivity savings and avoided air conditioning energy costs across the 11 city regions.
From Table 10, the cities in the south, that is, London and Cardiff City Regions experienced the greatest benefits from urban cooling, with the London City Region by far seeing the largest amount in avoided costs of £204.3 million in 2017 (84% of the total). This is because London has the biggest economy as well as the greatest number of hot days (7.42 days out of a total of 25.71 hot days in 2017).
Between 2016 and 2017, the total annual value across all 11 city regions declined slightly from £274.1 million in 2016 to £243.6 million in 2017, despite having five more hot days (see Table 10). This is because the London City Region, the largest economy in this study, saw a reduction in avoided costs due to a fall of nearly one hot day. Also, there were no hot days in both the Edinburgh and Glasgow City Regions, so no values were assigned to these regions. The Cardiff City Region saw the biggest increase in the annual value of the cooling effect between 2016 and 2017 due to the city region observing the largest rise in the number of hot days.
| Annual value | ||||
|---|---|---|---|---|
| 2016 | 2017 | |||
| Total avoided costs | Number of hot days | Total avoided costs | Number of hot days | |
| Cardiff city region | 3,311 | 1.28 | 5,174 | 3.14 |
| Edinburgh city region | 229 | 0.21 | - | 0 |
| Glasgow city region | 320 | 0.24 | - | 0 |
| Greater Manchester city region | 7,686 | 0.98 | 1,410 | 0.86 |
| Liverpool city region | 4,154 | 1 | 847 | 2.17 |
| London city region | 232,993 | 8.2 | 204,275 | 7.42 |
| North East city region | 346 | 0.35 | 35 | 0.02 |
| Sheffield city region | 3,401 | 2.42 | 3,129 | 1.91 |
| West Midlands city region | 12,425 | 2.81 | 15,804 | 4.57 |
| West of England city region | 4,572 | 1.62 | 11,170 | 4.63 |
| West Yorkshire city region | 4,633 | 1.1 | 1,743 | 1 |
| Total | 274,070 | 20.22 | 243,587 | 25.71 |
Download this table Table 11: The total annual value of cooling from green and blue space in 2017 was valued at £243.6 million¹
.xls .csvThe monetary account of the future provision of the ecosystem service, or future benefit stream, accounts for the benefits received over a specified time period, in this case 100 years. The account incorporates a projection for an annual increase in working day productivity losses due to climate change, which increases the value of urban cooling over time.
Table 12 presents the 100-year asset value of the environmental assets for each city region over two five-year averages. The total asset value between the two years increased by 17% from £11.20 billion to £13.07 billion. This is because between the two five-year averages the number of hot days increased by seven days. Again, the London City Region saw the largest amount of avoided labour productivity costs and air conditioning costs.
| Asset value | ||
|---|---|---|
| 5-year average (2012 to 2016) | 5-year average (2013 to 2017) | |
| Cardiff city region | 118,012 | 197,270 |
| Edinburgh city region | 27,886 | 29,536 |
| Glasgow city region | 31,306 | 33,203 |
| Greater Manchester city region | 353,426 | 417,260 |
| Liverpool city region | 160,186 | 242,690 |
| London city region | 9,077,291 | 10,241,587 |
| North East city region | 33,076 | 35,796 |
| Sheffield city region | 223,227 | 253,816 |
| West Midlands city region | 634,681 | 893,666 |
| West of England city region | 245,792 | 379,418 |
| West Yorkshire city region | 298,566 | 350,496 |
| Total | 11,203,450 | 13,074,738 |
Download this table Table 12: The asset value of the urban cooling effect increased between the two averages by 17% due to a rise in the number of hot days
.xls .csvWe can now examine the productivity benefits of converting 1 percentage point of the urban area into woodland. From Table 13, an increase in woodland by 1 percentage point (relative to the urban area) caused a saving in labour productivity of at least £9.2 million. This clearly shows the benefits of increasing woodland areas in city areas. These numbers are calculated using the five-year hot day average (2013 to 2017).
| Avoided labour productivity losses | |
|---|---|
| Cardiff city region | 113,332 |
| Edinburgh city region | 4,383 |
| Glasgow city region | 5,078 |
| Greater Manchester city region | 193,085 |
| Liverpool city region | 90,140 |
| London city region | 7,639,335 |
| North East city region | 8,846 |
| Sheffield city region | 128,976 |
| West Midlands city region | 578,151 |
| West of England city region | 256,777 |
| West Yorkshire city region | 134,638 |
| Total | 9,152,742 |
Download this table Table 13: A rise in 1% point of woodland relative to the urban area can lead to an overall saving in labour productivity of at least £9.2 million
.xls .csvNoise mitigation by urban vegetation led to a saving of £14 million in avoided loss of quality of life years in 2017
Noise mitigation estimates were published in the last urban publication. The values have not been updated since then and are currently in development. A summary will be provided here but for more information please see the Eftec (2018) paper as well as last year’s publication.
Vegetation can protect against noise pollution, by acting as a physical buffer between the noise pollutant and those nearby. Noise pollution is associated with adverse outcomes through lack of sleep and annoyance.
Eftec (2018) estimated the value of noise mitigation from urban vegetation in terms of improved amenity and health outcomes. The estimated benefits were for the urban noise reduction on major roads only.
It is estimated that 167,000 buildings benefitted from noise mitigation by urban vegetation in the UK. The total annual value of noise mitigation based on the avoided loss of quality adjusted life years (QALY) associated with a loss of amenity (sleep and annoyance) and adverse health outcomes due to noise was £14,431,0006.
Valuations based on quality adjusted life years are welfare values based on willingness to pay studies. It is possible to estimate exchange values for health-related benefits by reference to the cost-effectiveness of public health providers in delivering health outcomes. This is an area of further research.
Notes for: Regulating services
Please be aware that the data are different to what was published in June 2018, this was due to a mistaken chemical conversion. The values will also be higher due to an update in the value of life years lost from £35,000 to £42,780.
Mortality and hospital admissions are valued from the perspective of willingness to pay, drawing on an earlier study by Chilton and others (2004) for Defra. Also please be aware that these numbers do not factor in the updated damage costs published in January 2019 so the values may be under estimated.
Eftec and others (2018) created a set of regions which comprised the main eleven city regions in GB. Some city regions encompass large urban conglomerations, for example Greater Manchester City Region, while others include considerable rural areas as well, for example North East City Region. All spatial calculations were made within these boundaries. For a map of the city regions please see page 21 in the scoping study.
“Hot days” throughout this section refers to any days equal to or between 28 degree Celsius and 35 degree Celsius.
These estimates represent exchange values as they are directly based on economic output and expenditure. Welfare values would be included if the valuation covered the benefits to the general public, for example, the value of tree shading.
This is at the lower end of a range reflecting uncertainty over methods and limited data resolution; (b) four approaches are estimated by CEH and Eftec (2018), which range between 167,000 and 8,228,000 buildings benefitting from noise mitigation and £14 million and £245million in annual value from these benefits.
10. Cultural services
Recreation in nature in the urban environment was valued at £2.5 billion in 2017
In 2017, 2.5 billion trips1 and 2.7 billion hours were spent in nature in the urban environment (see Figure 15). This service was valued at £2.5 billion in 2017, down from £2.9 billion in 2016 despite recording more visits to nature in the urban environment. The asset valuation of this service in 2017 was valued at £104.0 billion.
Recreational visits in nature are valued based on expenditure on that trip (that is, fuel, public transport costs, admission costs and parking fees). It is also possible to derive an economic welfare value for recreational visits, by applying unit welfare values per trip to the total number of visits, differentiated where appropriate by type of site visited2.
Figure 15: During 2017, 2500 million visits were taken in nature in the urban environment
Number of visits to urban green space and hours spent according to Monitor of Engagement with the Natural Environment survey (MENE), UK, 2009 to 2017
Source: Office for National Statistics and Natural England – Monitor of Engagement with the Natural Environment (MENE) survey
Notes:
- For the years 2016 and 2017, due to the frequency of one of the MENE questions changing to a quarterly question, we switch from using monthly to quarterly weight which might explain some of the changes in the numbers.
- For example, welfare values can be derived from the Outdoor Recreation Valuation Tool (ORVal) developed by the University of Exeter with support from Defra, which is based on an econometric model of recreational demand using MENE visitor data, and covers publicly accessible sites across England and Wales. Although urban centres cannot be selected in ORVal, it is possible to filter sites by land covers associated with urban areas (managed grassland, sports pitches and so on) to give an approximate value per urban site visit. To illustrate for England, the average value per visit of such sites is £3.12 in 2017 values. Applying this to the numbers of visits in the physical account would give a welfare value of £3.12 x 2525 million visits = £7.9 billion per annum. Some of this value is likely to be attributable to non-natural features within recreational sites such as playgrounds.
Download this chart Figure 15: During 2017, 2500 million visits were taken in nature in the urban environment
Image .csv .xls
Figure 16: In 2017, recreation in the urban natural environment was valued at £2,503 million
Annual expenditure on outdoor recreation in the urban environment, UK, 2009 to 2017
Source: Office for National Statistics and Natural England – Monitor of Engagement with the Natural Environment (MENE) survey
Download this chart Figure 16: In 2017, recreation in the urban natural environment was valued at £2,503 million
Image .csv .xlsThe valuation method has meant that trips that do not incur an out-of-pocket cost are not included in the valuation, therefore these estimates are a significant underestimation. On the other hand, it is possible that expenditure on admission fees will partly reflect a return to other capital and labour inputs, or for access to facilities and services other than those provided by nature, and hence may overstate the value of the ecosystem service to those paying the admission fees. The MENE survey also only covers domestic household participation in short day-trips.
Tourism forms a significant part of outdoor recreation that we do not yet fully quantify. Methodological development on initial estimates of outdoor tourism is nearly complete and will be included in future reports.
The MENE survey only covers England and is upscaled to the UK using UK population data, therefore the results could be different if using actual Welsh, Scottish and Northern Ireland data.
Most of the free trips (those that do not include a cost) are trips made, possibly quite frequently (such as walking a dog) to local sites.
Visits to urban green and blue spaces in 2015 was estimated to be worth £4.4 billion in social physical health gains during 2015
An increasing amount of research indicates that greater exposure to, or “contact with”, natural environments (such as parks, woodlands and beaches) is associated with better health and well-being.
Similar to noise mitigation, the numbers have not been updated since the last urban iteration and are currently in development. This is because some of the data needed to update this work have not been updated since the last report. In the scoping study, Eftec (2017) estimated there were 2.1 million active visitors3 to green and blue spaces in urban areas in 2015, providing 74,000 additional quality adjusted life years4 to society.
The welfare value is based on HM Treasury Green Book guidance, where an additional life year in perfect health is valued at £60,000. Therefore, the estimated societal gain associated with active visits to urban green spaces is over £4.4 billion a year. Valuations based on quality adjusted life years are welfare values based on willingness to pay studies. It is possible to estimate exchange values for health-related benefits by reference to the cost-effectiveness of public health providers in delivering health outcomes. This is an area of further work.
A recent study by White and others (2019) also looked at the health benefits as well as wellbeing benefits of outdoor recreation in the natural environment. They found that individuals who spent at least two hours a week in the natural environment were more likely to report good health and high well-being. Furthermore, the study looked at the impact on health and well-being by spending time in the natural environment in urban areas5. The results also showed a positive association between reporting good health and high well-being when the individual spent time of at least two hours a week in the natural environment.
Notes for: Cultural services
For the years 2016 and 2017, due to the frequency of one of the MENE questions changing to a quarterly question, we switch from using monthly to quarterly weight, which might explain some of the changes in the numbers.
For example, welfare values can be derived from the Outdoor Recreation Valuation Tool (ORVal) developed by the University of Exeter with support from Defra, which is based on an econometric model of recreational demand using MENE visitor data, and covers publicly accessible sites across England and Wales. Although urban centres cannot be selected in ORVal, it is possible to filter sites by land covers associated with urban areas (managed grassland, sports pitches and so on) to give an approximate value per urban site visit. To illustrate for England, the average value per visit of such sites is £3.12 in 2017 values. Applying this to the numbers of visits in the physical account would give a welfare value of £3.12 multiplied by 2,525 million visits equalling= £7.9 billion per year. Some of this value is likely to be attributable to non-natural features within recreational sites such as playgrounds.
“Active visitors” defined using the approach of White and others (2016), which identifies visitors that meet: (a) Duration of activity threshold (30 minutes or more) based on Beale and others (2007), which used Health Survey for England data to estimate that 30 minutes a week of moderate to intense physical activity, if undertaken 52 weeks a year, would be associated with 0.010677 Quality Adjusted Life Year (QALYs) 16 per individual, per year; (b) Intensity of activity thresholds (greater than 3 METs - Metabolic Equivalence of Task 17), which uses the Compendium of Physical Activities (Ainsworth and others, (2011)) MET rates, which had been applied to each MENE activity (Elliott and others, (2015))
Eftec adopted a unit value of £20,000 per QALY, which was considered the cost-effectiveness threshold for drug procurement by the National Institute for Health and Care Excellence.
They based their urban definition on LSOAs categorised as “Urban” (LSOAs situated within a conurbation of greater than 10,000 inhabitants) or “Town and Fridge” (within peri-urban areas and smaller conurbations).
11. Future Urban Extent methodology
Urban Extent (UE) polygons were created by Economics for the Environment Consultancy (eftec) for the Department for Environment, Food and Rural Affairs (Defra) to address the lack of official geographies that include all green and blue spaces found in urban contexts. Inclusion of these areas is important to the accurate reporting of natural capital accounts in the UK.
Office for National Statistics (ONS) Geospatial were asked by ONS’s Natural Capital Team to review the product and consider assigning GSS codes to it (as set out by the GSS Geography Policy), so it could become an official ONS-supported statistical geography.
Despite eftec’s UE being based on official 2011 ONS built-up areas (BUAs), 2012 National Records of Scotland (NRS) Scotland Settlements and 2015 Northern Ireland Statistics and Research Agency (NISRA) Northern Ireland Settlement Development Limits, the subsequent modifications and their nature, make it unsuitable for an official release. While not incorrect and internally consistent, the methodology and the outputs were based on subjective decisions that the ONS had no influence over.
For example, it was found that a simple reordering of the production stages led to a greater inclusion of green and blue spaces in several cases (Figure 17). The Urban Extent product is unlike official products supported by the ONS, such as the 2011 BUAs, which are based on well-documented procedures and had direct involvement from the ONS. More research would be needed to develop this product further and make it an official statistical geography.
Figure 17: Comparison of outputs produced by reordering the stages of production

Source: Modified by eftec and CEH for Defra. Contains OS data Crown copyright and database right (2015). All rights reserved.
Download this image Figure 17: Comparison of outputs produced by reordering the stages of production
.png (104.8 kB)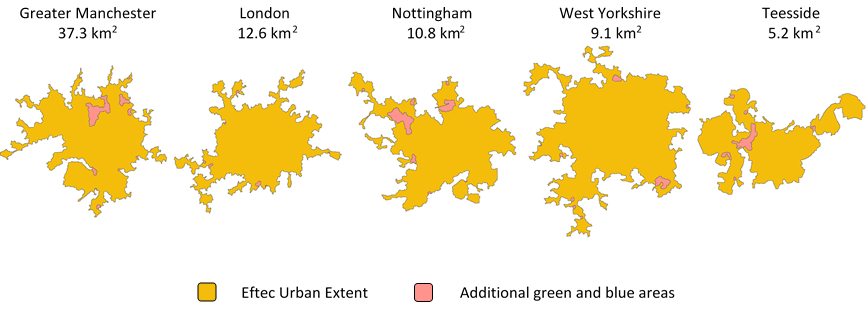
12. Methodology by condition type
Urban Bird Index
To create the Urban Bird Index, data for 27 bird species were collected from the joint BTO/RSPB/JNCC Breeding Bird survey. The birds selected to be considered urban were taken from the England Biodiversity Strategy and they are:
- blackbird
- blackcap
- blue tit
- carrion crow
- chaffinch
- dunnock
- green woodpecker
- goldfinch
- greenfinch
- great tit
- jay
- jackdaw
- long-tailed tit
- mistle thrush
- mallard
- magpie
- pied wagtail
- robin
- starling
- sparrowhawk
- song thrush
- woodpigeon
- wren
- house sparrow
- collared dove
- house martin
- swift
The names highlighted are considered to be “urban specialists”. The data for each of the bird species are used to calculate the mean count per square by dividing the species totals by the total number of squares surveyed. This number is then used to create the index for each of the 27 species and then a geometric mean is taken across all species to create the all urban bird species index.
The Living with Mammals survey
The Living with Mammals (LwM) survey creates effort-based indices of mammal abundance across the built environment and is managed by the People’s Trust for Endangered Species.
An “effort-based” index takes into account the variation in observer effort between years. Each week, survey participants record the length of time they spend observing the site in each of four periods or “times of day” – dawn, day, dusk and night. This is taken into account when calculating the index (differences between years are corrected for).
Mammals included in the survey are:
- badger
- roe deer
- voles
- brown rat
- fox
- muntjac
- rabbit
- grey squirrel
- bats
- shrews
- hedgehog
- mice
Sites are chosen by participants and are identified as one of the 13 types, described either by use (for example, “allotment” or “churchyard”) or by predominant habitat type (for example, “riverbank” or “woodland”). Participant data collectors are volunteers and self-selecting, which may bias results towards areas with more mammals to view.
For this analysis, sites within the ONS defined urban area were chosen and only those that were recorded in two or more years were included.
Individual species trends are based on fitting a Poisson GAM model to data that look at the maximum number of animals seen together in a particular week, with standard errors calculated by bootstrapping at the site level.
The all species trend is calculated as the geometric mean of the individual species, weighted equally.
Back to table of contents13. Methodology by service type
Allotments
Using satellite data, Ordnance Survey estimated the area of community gardens and allotments within the urban area at 7,925 hectares in 2019.
Under the assumption, by the National Allotment Society, that the average size of an allotment plot is 250 square metres, there are an estimated 316,998 allotment plots in Great Britain. Cook (2006) quotes the productivity per plot at 487 kilogrammes per year, which is taken from a Royal Horticultural Society 1975 study. This provides an estimated total production of 154,000,000 kilogrammes per year.
Capital growth estimated the total financial value of produce grown to be £150,477 in 2013 and £137,268 in 2014, based on 4.31 and 3.95 hectares of allotment land, respectively. Again, using the assumption that the average size of an allotment plot is 250 square metres, it is estimated that the average value of food produced by an individual allotment plot is £870.19, when averaging out the two years.
Based on the estimated 316,998 plots in Great Britain urban areas and the value of £926.37, which is estimated to be the average productivity of allotments (after being adjusted to 2017 prices), the estimated value of urban allotment food production is given as £294 million per year.
Carbon sequestration
Estimates relate to the removal of carbon dioxide equivalent (CO2e) from the atmosphere by woodland in urban areas. By using data from the National Forestry Inventory, which looks at tree cover outside woodland areas in Great Britain it was estimated that 7.5% of total woodland in Great Britain is in urban areas.
Using this percentage and assuming that Great Britain is representative of the UK and that this percentage stays constant over time, we can use this to proportion the carbon sequestration data to calculate physical flows.
The carbon sequestration data comes from the UK National Atmospheric Emission Inventory (NAEI), which reports current and future projections of carbon removal for the Land Use, Land Use Change and Forestry (LULUCF) sector.
LULUCF is divided into six land use types and in this study, we only focus on forest land which is broken down into the following subcategories:
- forest land remaining forest land
- land converted to forest land
For the years 1990 to 2017, actual physical estimates of carbon sequestration by land use class are sourced from the greenhouse gas inventory. In the asset valuation, projections of carbon sequestration rates are provided for the years 2017 to 2050 by the National Atmospheric Emission Inventory (NAEI) in the LULUCF emission projections. Central projections are used. For years used in the projections beyond 2050, the carbon sequestration rate is assumed to be constant as at 2050 levels.
To work out the annual value, the physical flow is multiplied by the carbon price. The carbon price used in calculations is based on the projected non-traded price of carbon schedule. This is contained within the data Table 3 of the Green Book supplementary guidance. Carbon prices are available from 2010 to 2100. Prices beyond 2100 are assumed to be constant at 2100 levels.
The non-traded carbon prices are used in appraising policies influencing emissions in sectors not covered by the European Union Emissions Trading System (EU ETS) (the non-traded sector). This is based on estimates of the marginal abatement cost (MAC) required to meet a specific emission reduction target. Beyond 2030, with the (expected) development of a more comprehensive global carbon market, the traded and non-traded prices of carbon are assumed to converge into a single traded price of carbon.
Air quality regulation
Air quality regulation estimates have been supplied in consultation with the Centre for Ecology and Hydrology (CEH). A very brief overview of the methodology will be explained in this section. A more detailed explanation can be found in the full methodology report published in July 2017.
The urban account was only calculated for Great Britain, as the Centre for Ecology and Hydrology did not have access to data equivalent to Ordnance Survey Mastermap for Northern Ireland. The scenarios compared “current urban green and blue space” with a “no green and blue space” scenario.
Calculation of the physical flow account uses the European Monitoring and Evaluation Program Unified Model for the UK (EMEP4UK) atmospheric chemistry and transport model, which generates pollutant concentrations directly from emissions and dynamically calculates pollutant transport and deposition, considering meteorology and pollutant interactions.
Air pollution data removal by urban green and blue spaces in Great Britain has been modelled for 2015 and then scaled to create values in 2030. Between these years a linear interpolation has been used and adjusted for real pollution levels as an estimation of air pollution removal.
The health benefits were calculated from the change in pollutant exposure from the EMEP4UK scenario comparisons, that is, the change in pollutant concentration to which people are exposed. Damage costs1 per unit exposure were then applied to the benefitting population at the local authority level for a range of avoided health outcomes:
- respiratory hospital admissions
- cardiovascular hospital admissions
- loss of life years (long-term exposure effects from PM2.5 and nitrogen dioxide (NO2))
- deaths (short-term exposure effects from ozone (O3))
Future flow projections used for asset valuation incorporate population projections and an assumed 2% increase in income per year (declining to 1.5% after 30 years and 1% after 75 years). Income elasticity is assumed to be 1. More work is being conducted in this area.
Visits to green and blue space
Physical data for the number of visits to urban green spaces are from Natural England’s Monitoring Engagement in the Natural Environment (MENE) survey, which also collects data for spending during trips.
Trips to urban green space are separated from other visits by using only visit data for those who chose one or more of the options “townpark, allotment, path, playground, playfield, town, village” when answering the question, “Which of the following list of types of place best describe where you spent your time during this visit?”
MENE allows respondents to record multiple locations for their recreational visit, for example, a visitor may spend some time in a woodland and a beach. For this reason, a habitat weighting factor was constructed to split any expenditure or time equally against the habitats. For example, if four types of habitat selected for the urban area were visited and recorded by a respondent in MENE then each habitat was assigned a weight of 0.25 (1/4) and assigned 25% of the time and expenditure.
The recreation estimates were developed by Ricardo-AEA, who also reviewed various different methods of valuing recreation. It was concluded only admission fees and travel expenditure should be included in the valuation as including the opportunity cost of time presents considerable problems. However, this will cause an underestimation, as the value of visits that have incurred no cost, for example, walking a dog locally in a city park, will not be captured.
Notes for: Methodology by service type
- As mentioned previously, the updated damage costs released in January 2019 have not been used in these calculations therefore the values may be under estimated.
Contact details for this Statistical bulletin
natural.capital.team@ons.gov.uk
Telephone: +44 (0)1633 455096/+44 (0)1329 447076