Table of contents
- Main points
- Acknowledgments and collaboration
- Things you need to know about this release
- What are ecosystem accounts?
- Defining urban areas and why they differ from previous habitat based accounts
- Extent of urban space in Great Britain
- What is the condition of the green space in Great Britain?
- What ecosystem services do urban areas provide?
- The value of nature implicit in the property market
- Next steps
- Methodology
1. Main points
On average, almost a third of urban area in Great Britain consists of natural land and green space.
There are over 62,000 urban green space sites in Great Britain adapted for a specific function e.g. public gardens and parks.
This urban natural land and green space provides society with many services including protecting urban properties from noise pollution and cooling cities by over half a degree Celsius.
Proximity to natural land and green space can influence property values as premiums are paid for a nice view or easy access to a local park. The value associated with living near a green space is estimated to be just over £130 billion in the UK.
2. Acknowledgments and collaboration

This publication is produced in partnership with the Department for Environment, Food and Rural Affairs (Defra). For full details about the natural capital accounting project please refer to our website.
The recently published 25 Year Environment Plan restated the government’s commitment to working with the ONS to develop a full set of natural capital accounts for the UK. Such accounts will help support the monitoring of progress under the plan as well as providing evidence and statistics to inform better decision making as envisaged in the plan.
We would also like to thank Steve Kingston, Andrew Cooling and colleagues at Ordnance Survey for their hard work on both the extent account and the creation of variables used in a hedonic regression to value ecosystem services provided by natural capital in the urban environment. The valuable contributions from Eftec and the Centre for Ecology and Hydrology (CEH) for their initial urban accounts scoping study and their extended work on the valuation of noise mitigation and urban cooling are also gratefully acknowledged.
Back to table of contents3. Things you need to know about this release
This bulletin contains ecosystem accounts for the urban environment in the Great Britain. This forms part of the UK natural capital accounts being developed by the Department for Environment, Food and Rural Affairs (Defra) and Office for National Statistics (ONS). This is the first iteration of the urban ecosystem account.
All methods are continually improved upon as the natural capital accounts are developed, so remain in experimental status. Revisions to estimates in future releases are highly likely. The monetary accounts should be interpreted as a partial or minimum value of the services provided by the natural environment, as a number of ecosystem services, such as flood protection from natural resources, are not currently measured, and conservative assumptions are typically adopted where there is uncertainty.
Different definitions of green space are used throughout this bulletin, the definitions are as follows
Natural land cover
Any land cover classified as being natural in type for example, grassland, heath, scrub, orchards, coniferous trees and so on. It does not include inland water bodies.
Functional green space
Any green space that has a specific function in its use for example, public parks or gardens, playing fields, golf courses, allotments and so on.
Publicly accessible green space
A subset of functional green space, it removes green spaces expected to have restriction to entry for example, golf courses.
Blue space
All inland water bodies for example, rivers, lakes, ponds, canals and so on.
Back to table of contents4. What are ecosystem accounts?
Each area of a particular land cover or habitat can be thought of as an asset supplying a number of services that the economy and society benefit from. For example, food, water or clean air. The ecosystem accounts monitor the size and condition of these assets and also the quantity and value of the services supplied.
In this bulletin, the urban ecosystem accounts are presented in three sections:
the size of the area covered by each habitat (extent account)
indicators of the quality of the ecosystem and ability to continue supplying services (condition account)
quantity and value of services supplied by the ecosystem to society
5. Defining urban areas and why they differ from previous habitat based accounts
An urban area is defined as a human settlement with a high population density and the associated features of a built environment with infrastructure (National Ecosystem Assessment , 2011). The dominant features of urban areas are humans and the built environment, although urban areas can also encompass a variety of natural landscapes and biodiversity.
The urban ecosystem is comprised of a variety of land cover types, largely built-up areas with very little vegetation, but also large parks and areas consisting of other broad habitats (such as woodland, freshwater and even farmland).
As stated in the Principles of Natural Capital Accounting (ONS, 2017) the starting point of classifying an ecosystem type is the Land Cover Map (LCM), defining ecosystems based on land cover classification. Urban has been defined in previous releases by the land cover habitat descriptors “Built-up areas and gardens” and “Suburban”. In developing these accounts, it was found this excluded most green and blue spaces which are captured under other categorisations (for example, woodland, coastal margins etc.). Using a land cover-based definition would not provide information about the extent of green and blue space in the urban environment and the interaction between society and the environment in these areas that would be of most use to policy.
Due to this we follow Eftec (2017) in their use of a modified Built-Up Areas (ONS, 2011) dataset to define the urban boundary. This boundary was developed for the purpose of national natural capital accounting and uses the ONS Built-Up Areas (2011) dataset, which defines urban as any area “irreversibly urban in character”1. The Built-Up Areas (BAU) dataset is modified to include nature around the periphery of an urban site where high levels of interaction between people and nature are still expected, and to include larger areas of green space within urban environments, such as city parks and rivers.
The ONS (2011) Built-Up-Areas dataset was selected on the basis that:
it captures all built-up-area and therefore all areas that will not be included in other broad habitat accounts (this is not the case for Rural Urban Classification 2011 (RUC2011), Major Towns and Cities);
other urban classifications (for example major towns and cities) can be looked at within this dataset
it is based on physical settlement morphology and not statistical units (that is Output Areas that RUC2011 uses) which will extend into rural areas.
More information on why the BUA (2011) dataset was chosen and how it was modified for use in the ecosystem accounts is available. Figure 1 depicts the extent of the urban area using the BUA definition in United Kingdom.
Figure 1: Urban Boundary defined by Eftec/CEH (2017) for DEFRA and ONS, 2011 to 2012
United Kingdom

Source: Office for National Statistics
Download this image Figure 1: Urban Boundary defined by Eftec/CEH (2017) for DEFRA and ONS, 2011 to 2012
.png (266.1 kB)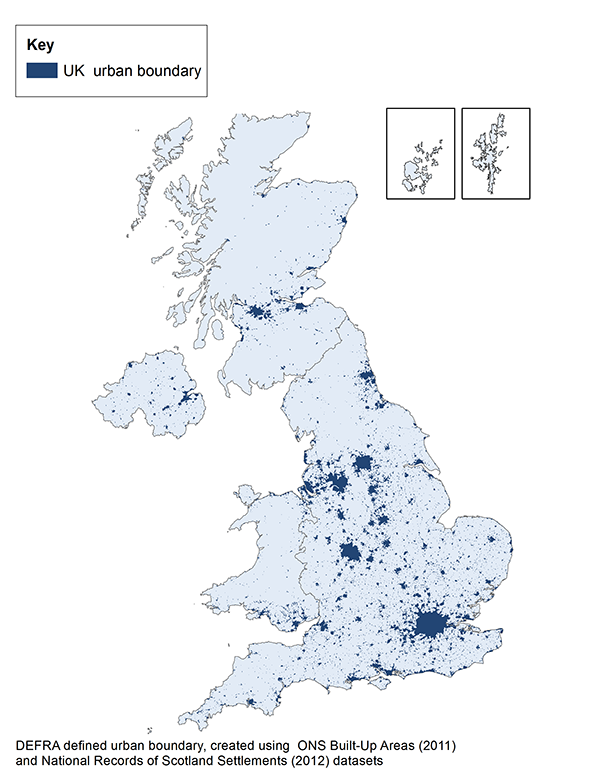
Notes for: Defining urban areas and why they differ from previous habitat based accounts
- Further information about the BUA dataset can be found on our archive.
6. Extent of urban space in Great Britain
The extent refers to the area of land the habitat or environmental asset covers, in the case of urban it is the thousands of hectares of urban area that exist in Great Britain.
As described in the previous section, the urban environment can compromise of a variety of ecosystem types or habitats. Table 1 reports the total “urban area” as defined within this study and the extent of different types of ecosystems based on land cover information.
The urban environment accounted for 1,768,000 hectares of the 21 million hectares in Great Britain in 2011. The urban area therefore covers around 8% of land in Great Britain.
Table 1: Extent of urban area and broad habitats contained within it, Great Britain, 2007 to 2011
| Extent | Extent (hectares) | Source | |
|---|---|---|---|
| Total Urban Area | 1,768,000 | Enhanced ONS BUA (2011) | |
| Area of ‘broad’ habitats contained within the urban area | Coastal Margins | 4,000 | Land Cover Map 2007 |
| Enclosed farmland | 403,400 | ||
| Freshwater | 9,100 | ||
| Marine | 4,100 | ||
| Mountains, moorlands and heaths | 11,200 | ||
| Semi-natural grassland | 34,200 | ||
| Woodland | 87,900 | ||
| Grey space1 | 1,212,000 | ||
| Source: Eftec (2017) A study to scope and develop urban natural capital accounts for the UK | |||
| Notes: | |||
| 1. As defined by LCM definitions ‘Built-up Areas’ and ‘Suburban’. This will include areas of greenspace and bluespace smaller than 0.0025 ha, as these areas were too small to detect by methods used to develop the Land Cover Map | |||
| 2. These figures may not sum due to rounding. | |||
Download this table Table 1: Extent of urban area and broad habitats contained within it, Great Britain, 2007 to 2011
.xls (37.4 kB)Outdoor green and blue space, such as parks, gardens, rivers and lakes are important for well-being. Through collaborative work between ONS and the Ordnance Survey (OS), estimates for the extent of green space in urban areas have been developed. The estimates aim to complement those in Table 1 by providing more detail about the smaller areas of green space and their functionality, for example what it is used for and if it is publicly accessible.
Although the estimates provided by OS aim to complement the LCM 2007 broad habitat metrics they are currently incompatible due to overlaps and differing timeframes for when measurements were taken. The remainder of the extent account refers to the OS estimations of green and blue space.
The OS Open Green space map (2017) and OS Mastermap Topography Layer were used in accordance with a modified ONS Built-Up Area map (2011) to calculate the areas of natural land cover and blue space, described as follows:
Natural land cover
Any land cover classified as being natural in type for example, grassland, heath, scrub, orchards, coniferous trees and so on. but does not include inland water bodies
Functional green space
Any green space that has a specific function in its use for example, public parks or gardens, playing fields, golf courses, allotments and so on; These spaces contain natural land cover, and can also include some blue space for example, a park that has a lake within it.
Publicly accessible green space
A subset of functional green space, it removes green spaces expected to have restriction to entry for example, golf courses. Restrictions to entry limits the ability of the green space to provide cultural services. Publicly accessible green space is defined in Table 2.
Blue space
All inland water bodies for example, rivers, lakes, ponds, canals and so on.
Table 2: Defining publicly and non-publicly accessible green space
| Publicly accessible | Non-publicly accessible |
|---|---|
| Parks/ Public Gardens | Golf Course |
| Playing Fields | Allotments and Growing spaces |
| Cemetery | Bowling Green |
| Open Access Land | Other Sports Facility (for example cricket ground) |
| Religious Grounds |
Download this table Table 2: Defining publicly and non-publicly accessible green space
.xls (34.3 kB)How much green space is there in urban areas?
There are approximately 1.77 million hectares of urban area in Great Britain, of these 0.55 million hectares are classified as natural land cover (31%). Table 3 presents the extent of urban green space by country.
Scotland has the largest proportion of both natural land cover (37%) and blue space (1%) in its urban areas. Both Wales and England had 30% natural land cover in urban areas.
On average 23% of natural land cover in urban areas had a specific function, for example, a park or bowling green and 68% of this was publicly accessible. England had the largest proportion of functional green space relative to urban natural land cover (24%), this compares to 16% in Wales and 20% in Scotland.
Approximately 62,000 functional green space sites exist in urban areas in Great Britain. Approximately 67% (42,000) functional green space sites are publicly accessible Wales had the largest proportion of functional green space sites that were publicly accessible (73%), this compares to 61% in Scotland and 68% in England.
Table 3: Extent of urban green spaces in 2017, Great Britain
| England | Scotland | Wales | Great Britain | |
|---|---|---|---|---|
| Extent (hectares) | ||||
| Urban area | 1,502,000 | 176,000 | 91,000 | 1,768,000 |
| Natural land cover | 456,700 | 64,700 | 27,600 | 549,000 |
| Blue space | 17,900 | 2,500 | 1,000 | 21,400 |
| Functional green space | 107,600 | 12,700 | 4,500 | 124,800 |
| Publicly accessible green space | 73,600 | 7,710 | 3,300 | 84,610 |
| Proportion of urban area (%) | ||||
| Natural land cover | 30% | 37% | 30% | 31% |
| Blue space | 1% | 1% | 1% | 1% |
| Functional green space | 7% | 7% | 5% | 7% |
| Publicly accessible green space | 5% | 4% | 4% | 5% |
| Number of sites | ||||
| Functional green space | 53,085 | 5,500 | 3,700 | 62,300 |
| Publicly accessible green space | 35,900 | 3,300 | 2,400 | 41,600 |
| Source: Ordnance Survey | ||||
| Notes: | ||||
| 1. These figures may not sum due to rounding. | ||||
Download this table Table 3: Extent of urban green spaces in 2017, Great Britain
.xls (36.4 kB)Figure 2 presents types of functional green space in Great Britain. Specific functions vary, but public parks and gardens account for the largest proportion of green space in terms of area (37,500 hectares), yet more individual sites are classified as playing fields (14,900), closely followed by religious grounds (14,400).
Religious grounds are high in number but tend to be small in size. By hectare, religious grounds are the second smallest type of green space, with bowling greens covering the least hectares.
Figure 2: Extent of functional green space (hectares) by type of function and number of sites, 2017
Great Britain
Source: Ordnance Survey
Download this chart Figure 2: Extent of functional green space (hectares) by type of function and number of sites, 2017
Image .csv .xlsHow does green space extent vary by region?
Figure 3 depicts the 10 built-up areas (BUA) of the fifty largest BUAs in Great Britain with the largest and smallest proportion of urban natural land cover. The BUA with the largest proportion of urban natural land cover is West Yorkshire (which consists of Leeds, Bradford, Huddersfield and Wakefield), 46% of the urban area consists of natural land cover. Brighton and Hove have the smaller proportion of natural land cover (20%).
Figure 3: Proportion of urban area comprised of Natural Land Cover as a percentage (2017)
Great Britain
Source: Ordnance Survey
Download this chart Figure 3: Proportion of urban area comprised of Natural Land Cover as a percentage (2017)
Image .csv .xlsPrivate outdoor space
Residential gardens provide outdoor space and the potential for private green and blue space, potentially offering a range of ecosystem services for example recreation, noise mitigation and food if homegrown.
Using Ordnance Survey maps it has been possible to estimate the extent of private outdoor space. It is estimated by extracting the size of property plots in Great Britain and removing the size of buildings in the plot, the residual is assumed to be outdoor space. These estimates include both front and back gardens, but currently do not tell us anything about natural land covering these spaces. For example, a garden could comprise of grass and hedgerows or could be paved with a fence.
Further work is needed to estimate the extent of vegetation in gardens, currently only outdoor space is estimated.
Approximately 530 thousand hectares of residential garden exist in urban areas in Great Britain, accounting for 30% of the total urban area. England has the largest proportion of urban area attributed to residential gardens (31%). Scotland, which had the highest proportion of natural land cover and blue space in its urban area, has the smallest proportion of residential garden area (25%).
Table 4: Extent of urban residential gardens and proportion of total urban area, Great Britain, 2017
| England | Scotland | Wales | Great Britain | |
|---|---|---|---|---|
| Built-Up Area (Hectares) | 1,502,000 | 176,000 | 91,000 | 1,768,000 |
| Residential Garden (Hectares) | 459,500 | 44,100 | 25,700 | 529,300 |
| Proportion of urban area comprised of residential gardens (%) | 31% | 25% | 28% | 30% |
| Source: Ordnance Survey | ||||
Download this table Table 4: Extent of urban residential gardens and proportion of total urban area, Great Britain, 2017
.xls (35.8 kB)7. What is the condition of the green space in Great Britain?
Urban green and blue space can be made up of broader habitat types, including woodland and enclosed farmland. The green and blue space reported in these accounts overlap with existing and developing ecosystem accounts for each of these broad habitats, such as woodland, farmland and freshwater accounts.
Because of this overlap, identifying and measuring condition indicators for urban ecosystems is not straightforward, as condition indicators may differ according to the nature of the habitat. As a result, two aggregated indicators providing a sense of overall condition rather than specific dimensions were chosen, condition of sites of special scientific interest (SSSI) sites and number of sites awarded Green Flag status. Functionality of green space is important in highly populated urban areas, therefore accessibility and proximity to green space are also included.
Further work is needed to establish if other indicators (for example, biodiversity indicators, soil indicators, ecological condition indicators, spatial configuration, air quality and management practices) could be used in this account. Eftec (2017) and Mapping and Assessment of Ecosystems and their Services (2018) have both suggested relevant indicators and potential data sources for the urban environment, these should be consulted further in the future.
Condition of sites of special scientific interest (SSSI) within Built-up Areas
Sites of special scientific interest are areas of land protected by law to conserve wildlife or geology. Spatial information is collected about the condition of SSSI sites, some of which overlap with urban areas and can provide an indicator of condition of urban green and blue space. The extent of SSSIs in urban areas in the UK is 11560 hectares.
When comparing the condition of SSSI sites, comparison between countries is difficult as information is collected separately by each country with terminology of condition and how it is designated differing.
Table 5 aggregates to the number of sites generally classified as favourable, unfavourable and partially or fully destroyed. Generally, a higher proportion of SSSI sites in Scotland are in favourable condition, compared to England and Wales. No data was available for Northern Ireland ASSI sites.
Table 5: Breakdown by country of urban SSSI/ASSI condition and extent as known at May 2018, United Kingdom
| Country | Extent (hectares) | Condition5 | Favourable | Unfavourable | Destroyed/ Partially destroyed | NA |
|---|---|---|---|---|---|---|
| England 1 | 9,590 | Units | 1,317 | 1,592 | 20 | 3 |
| % | 45% | 54% | 1% | 0% | ||
| Scotland 2 | 1,170 | Units | 335 | 134 | 3 | 18 |
| % | 68% | 27% | 1% | 4% | ||
| Wales 3 | 580 | Units | 1,090 | 1,344 | 20 | |
| % | 44% | 55% | 1% | |||
| Northern Ireland 4 | 220 | Units | NA | NA | NA | NA |
| United Kingdom | 11,560 | Units | NA | NA | NA | NA |
| Source: Natural England, Natural Resources Wales, Natural Scottish Heritage, Opendata Northern Ireland | ||||||
| Notes: | ||||||
| 1. Unfavourable includes sites recorded as ‘unfavourable recovering’, ‘unfavourable no change’ and ‘unfavourable declining’. | ||||||
| 2. Favourable includes sites recorded as ‘favourable maintained’, favourable recovered, ‘favourable declining’. Unfavourable includes sites recorded as ‘unfavourable recovering’, ‘unfavourable no change’ and ‘unfavourable declining’. | ||||||
| 3. Favourable includes sites recorded as ‘appropriate conservation management’. ‘Unfavourable sites include those recorded as ‘needs action’. | ||||||
| 4. No data containing condition of ASSI sites is included. | ||||||
| 5. The ‘Latest Assessed Condition” is used for the condition indicator for Scottish SSSI’s. | ||||||
Download this table Table 5: Breakdown by country of urban SSSI/ASSI condition and extent as known at May 2018, United Kingdom
.xls (39.4 kB)Data collected for Scottish and English sites have both reported using categories provided by the Joint Nature Conservation Committee (favourable, unfavourable, part destroyed and destroyed). This enables some comparison and aggregation to be made. Data for Wales is more difficult to compare as sites were only recorded as “appropriate conservation management” and “needs action”.
Further, the conditions of the SSSI units were taken at different points in time. For England was collected between 2005 and 2018, Scotland between 1995 and 2017 and data for Wales is taken from a live database which is updated continuously. Further work is needed to determine change over time.
All countries measure the condition of units or natural features within the SSSI boundaries. For example, in Scotland there are 125 SSSIs that lie within or intersect the urban boundary and within these there are 490 natural features that are assessed (for example, woodland, birds, invertebrates and so on). Where possible, the units and natural features that are within the urban boundary are included as an urban condition indicator and those that fall out are excluded. For Scotland, currently there is no efficient or reliable way of separating out which features lay within the urban boundary and which don’t, therefore all features have been included in the analysis.
Green Flag Awards
The Green Flag Award is designed to recognise and reward well-managed parks and green spaces and aims to set the standard for the management of recreational outdoor spaces. The main purpose of the award is to ensure that everybody has access to green spaces and that these spaces are appropriately managed to enable people to live healthier lifestyles. Further details about the aim and purpose of the Green Flag Awards are given on the Green Flag Award website.
To be awarded Green Flag status sites are judged on 27 criteria split between eight different sections some of which are included in the categories of condition indicators identified separately by both Eftec (2017) and Natural England. These eight sections include:
A welcoming place
Healthy, safe and secure
Well Maintained and Clean
Environmental Management
Biodiversity, Landscape and Heritage
Community Involvement
Marketing and Communication
Management
Table 6 shows the number of sites awarded Green Flag status for each country in Great Britain.
Table 6: Urban sites awarded Gleen Flag status, Great Britain, 2017
| England | Scotland | Wales | Great Britain | |
|---|---|---|---|---|
| Number of Green Flag Awarded sites in urban areas | 1,026 | 60 | 47 | 1,133 |
| % of public parks/gardens with greenflag status | 18% | 9% | 15% | 17% |
| Source: Green Flag Award | ||||
| Notes: | ||||
| 1. These results are for Green Flag Awarded sites only and not Green Flag Community or Heritage Awards. | ||||
Download this table Table 6: Urban sites awarded Gleen Flag status, Great Britain, 2017
.xls (35.8 kB)Accessibility
The accessibility of green spaces is important in the delivery of cultural ecosystem services from urban green space sites.
The Ordnance Survey Green space map provides information about number of access points available for green space in urban areas in Great Britain. This provides a basic indicator of the accessibility of green spaces within the urban environment. The Ordnance Survey Open Greenspace map is updated continuously so these figures can be updated in future iterations.
In Great Britain on average 1.4 access points are available per hectare of functional green space. In Wales, two access points are available per hectare.
Table 7: Total number of access points for functional green space per hectare, Great Britain, 2017
| Urban Access Points | England | Scotland | Wales | Great Britain |
|---|---|---|---|---|
| Total access points per hectare of functional greenspace | 1.32 | 1.38 | 2.02 | 1.35 |
| Total access points | 142,340 | 17,522 | 9,068 | 168,930 |
| Functional Greenspace (hectares) | 107,600 | 12,700 | 4,500 | 124,800 |
| Source: Ordnance Survey | ||||
Download this table Table 7: Total number of access points for functional green space per hectare, Great Britain, 2017
.xls (35.3 kB)Proximity to functional green space provides further information about the accessibility of the green space and the value is it has the local population. Table 8 shows that the average distance to a functional green space in Great Britain is 259 metres, this is the average distance from a property to the nearest access point of functional green space. The average distance to blue space is greater at 365 metres.
Further, there are 4.6 hectares of natural land cover within a 200-metre radius of the average property in an urban area.
Table 8: Proximity to green space, Great Britain, 2018
| Average distance to functional green space | Average distance to blue space site | Average area of natural land cover within 200m | Average area of functional green space within 200m | Average area of blue space within 200m | |
|---|---|---|---|---|---|
| Great Britain | 259m | 365m | 4.6 hectares | 4.2 hectares | 1.9 hectares |
| Source: Ordnance Survey | |||||
Download this table Table 8: Proximity to green space, Great Britain, 2018
.xls (34.8 kB)8. What ecosystem services do urban areas provide?
This section assesses the contribution of the services nature in urban areas provides to the economy and society, capturing the flow of services in monetary and non-monetary units. Currently the service accounts are partial and there are other services provided but not captured in the accounts. The Common International Classification of Ecosystem Services (CICES version 5.1) is followed, which uses the familiar practice of splitting the services in to provisioning, regulating and cultural services. Table 9 presents the services captured in this release.
The estimates presented are initial and highly experimental. It can be difficult to measure with precision the services nature provides to society. Many services, especially regulating services will depend on highly localised features (for example climate and topological as well as the precise structure and nature of the vegetation) which may not be readily modelled at a national scale
In addition, most of the services provided by the natural environment are not traded in the market place and do not therefore have known “prices”. There are a number of techniques which can be used to attribute a monetary value to these services. Some of these techniques reveal an implicit price which may be interpreted as one which would be paid if a market for the service existed; these values are known as exchange values and are conceptually consistent with the output values within the system of national accounts.
Other non-market valuation techniques measure the full value that beneficiaries receive (including what economics calls “consumer surplus”), which will be greater than the exchange values. Welfare values are typically used in economic appraisal of policies or projects. In compiling monetary ecosystem service accounts, it is important to be clear about the nature of the valuation method used and the extent to which such values are compatible with other values.
Whilst the primary basis of valuation of ecosystem service accounts is exchange values (as set out in System of Environmental-Economic Accounting (SEEA EEA)), it is increasingly recognised by the international community that fuller welfare estimates, where appropriate, can be of significant interest. So too can the comparison of welfare and exchange values. We are not yet in a position to set out systematically both sets of estimates, but in this initial account we make more explicit what type of value is being estimated. Further comment is provided within the discussion on individual services.
Table 9: Services included in this publication
| Provisioning | Regulating | Cultural |
|---|---|---|
| Products such as food, water, fibre and fuel | Services such as water purification, climate regulation, noise and air pollution reduction and flood hazard reduction | Non-material services, for example recreational enjoyment and aesthetic experience |
| Included | Included | Included |
| Agricultural production - allotments only | Carbon Sequestration | Recreation (day trips by UK residents) |
| Water for public water supply | Air filtration | Aesthetic interactions |
| Fish | Noise regulation | Physical health |
| Timber | Urban cooling | |
| Not included | Not included | Not included |
| Agricultural production - farming | Waste water cleaning | Scientific and educational interactions |
| Fish caught | Mediation of smell and visual pollution, solid wastes | Heritage interactions |
| Wild plants and animals | Flood, erosion and landslide protection, water flow control, temperature regulation | Symbolism of certain plants and animals |
| Water provisioning | Lifecycle regulation | Value place on nature simply existing |
| Materials, including minerals and timber | Water condition regulation | Overnight visits and visits by non-residents |
| Energy production | Mental health | |
| Source: Office for National Statistics | ||
| Notes: | ||
| 1. The breakdown provided has been adapted from the Common Classification of Ecosystem Services (CICES) developed by the European Environment Agency. | ||
Download this table Table 9: Services included in this publication
.xls (36.9 kB)Provisioning services
Over a fifth of the urban area is covered in farmland. Food production (albeit on a small scale) does also take place in community or domestic gardens and allotments in addition to wild berries and fruit being available to forage within the urban boundary.
In this release it has not been possible to estimate the provisioning service supplied through farmland, however, Eftec (2017) estimated the total production of food from allotments to be 80,000,000 kg per year. The estimated monetary value of urban allotment food production is estimated to be £114 million per year.
Further work is needed to disaggregate the woodland, farmland and freshwater accounts to establish the monetary and non-monetary flows of timber, water and agricultural production that take place in urban areas.
Estimates of the service of food production represent an exchange value, because they are based on actual traded values. Welfare valuation is not really appropriate or feasible for estimating the value of food production.
Regulating services
Global climate regulation (carbon sequestration)
Vegetation within the urban environment removes carbon from the atmosphere via a process known as sequestration. Urban woodland accounts for 5% of the urban area and Eftec (2017) estimated that 537,000 tonnes of CO2 equivalent are removed by this woodland each year. Using the non-traded carbon price, £61 per tonne of CO2 a year (BEIS, 2018), this service was valued at £32.8m in 2015.
This is an underestimate as smaller clumps of trees or lines of singular trees are not captured. Additionally, other forms of vegetation (hedges, shrubs, bushes etc.) are omitted.
However, based on this estimate urban woodland contributes only a small amount of the value of the total carbon sequestered across all woodland in the UK which is estimated to be over £1 billion in 2015 according to the ONS (2017) woodland account.
The non-traded carbon price is based on the economic cost to society of mitigating a unit of carbon consistent with greenhouse gas targets. It could be interpreted as an exchange value if it was assumed that government would transact at this price for every unit of carbon reduced. In practice, this is unlikely, which implies that estimates of carbon sequestration should be considered an upper bound of an exchange value. Further work is needed on this.
Air filtration
Estimates developed by the Centre for Ecology and Hydrology (CEH) (2017), report that in 2015 urban natural capital assets in the form of vegetation only, removed 31.7 ktonnes of fine particulate matter (PM2.5), sulphur dioxide (SO2), nitrogen dioxide (NO2) and Ozone (O3) (43.2 ktonnes including PM10 and NH3) in 2015.
It is estimated that in 2015 the avoided health costs in the form of avoided deaths (105), avoided life years lost (5,900), fewer respiratory hospital admissions (538), and fewer cardiovascular hospital admissions (182) amounted to a substantial £211m, this is shown in Table 10.
Table 10: Annual value of air quality regulation from urban green and blue space (£'000), United Kingdom, 2015
| 2015 | |||||
|---|---|---|---|---|---|
| £'000 per yr | |||||
| PM2.5 | Respiratory hospital admission | £800 | |||
| Cardiovascular hospital admissions | £700 | ||||
| Life years lost | £193,800 | ||||
| SO2 | Respiratory hospital admission | £300 | |||
| NO2 | Respiratory hospital admission | £200 | |||
| Cardiovascular hospital admissions | £100 | ||||
| Life years lost | £12,600 | ||||
| O3 | Respiratory hospital admission | £2,200 | |||
| Cardiovascular hospital admissions | £300 | ||||
| Deaths | £600 | ||||
| Total | £211,600 | ||||
| Source: Eftec (2017) "A study to scope and develop urban natural capital accounts" | |||||
Download this table Table 10: Annual value of air quality regulation from urban green and blue space (£'000), United Kingdom, 2015
.xls (36.4 kB)The contribution vegetation in urban areas provides in health benefits by removing pollution is far greater than might be expected considering the urban area is only around 8% of UK land. This is largely because the majority of the UK population reside in urban areas, therefore the population benefiting from reduced exposure to air pollutants due to pollution removal by urban vegetation is much larger.
Estimates are based on EMEP4UK1 modelling and vegetation is defined by the Land Cover Map 2007. Results are expected to be an underestimate as specific natural features such as street trees are likely to have been omitted from the analysis.
Valuation of avoided of life-years lost and avoided admissions are based on willingness to pay values, and so represent a welfare value. Valuation of health benefits and better air quality is an area of ongoing research.
Urban cooling (local climate regulation)
Green and blue space can cool urban environments, which has benefits to the economy at the margin by mitigating labour productivity loss and reducing artificial cooling costs (air conditioning).
Eftec (2018) estimated the cooling benefit provided by natural capital in urban environments for 11 city regions in the UK in aggregate and by individual land cover types, this is depicted in Table 11. These values are averaged across the whole urban area so as to facilitate measurement of the benefits.
The aggregate cooling effect varies between -0.63 and -0.88 degrees Celsius. In all the regions analysed green space provides greater cooling effects than blue space.
Table 11: Annual cooling effect of green space and blue space in each of Great Britain’s city regions (degrees Celsius), 2007 to 2016 average
| Woodland | Parks/grass | Gardens | Rivers/canal | Lakes/ponds | Total effect | |
|---|---|---|---|---|---|---|
| Cardiff City Region | -0.23 | -0.20 | -0.26 | -0.01 | 0 | -0.71 |
| Edinburgh City Region | -0.39 | -0.24 | -0.24 | -0.01 | 0 | -0.88 |
| Glasgow City Region | -0.32 | -0.22 | -0.24 | -0.02 | 0 | -0.80 |
| Greater Manchester City Region | -0.24 | -0.27 | -0.22 | -0.01 | 0 | -0.75 |
| Liverpool City Region | -0.15 | -0.19 | -0.28 | -0.01 | 0 | -0.63 |
| London City Region | -0.25 | -0.21 | -0.24 | -0.02 | 0 | -0.72 |
| North East City Region | -0.17 | -0.22 | -0.25 | -0.02 | 0 | -0.65 |
| Sheffield City Region | -0.23 | -0.20 | -0.29 | -0.01 | 0 | -0.73 |
| West Midlands City Region | -0.21 | -0.21 | -0.28 | -0.01 | 0 | -0.72 |
| West of England City Region | -0.19 | -0.19 | -0.29 | -0.01 | 0 | -0.69 |
| West Yorkshire City Region | -0.28 | -0.32 | -0.22 | -0.01 | 0 | -0.83 |
| Source: Eftec (2018) “Scoping UK urban natural capital account - local climate regulation extension” | ||||||
| Notes: | ||||||
| 1. Figures may not sum due to rounding. | ||||||
Download this table Table 11: Annual cooling effect of green space and blue space in each of Great Britain’s city regions (degrees Celsius), 2007 to 2016 average
.xls (36.9 kB)Avoided heat-related productivity losses and air conditioning cost savings were used to value the cooling service. The vast majority of the benefits arise from avoided productivity loss of manual type work. London has the highest total annual value with £140m. The overall value of urban green and blue space across all 11 city regions is found to be £166 million annually. This value is based on a five-year average number of hot days between 2012 and 2016. For 2016, which experienced an above average number of hot days, the total value of the service was £274m.
This is assessed by sector based on averaging temperature mitigation across urban areas, and applying temperature-output loss functions to monetise the gross value added (GVA) that would have been lost due heat in the absence of the cooling effect, accounting for adaptation behaviour. Additionally, energy cost savings from air conditioning are based on estimates in London and extrapolated to other city regions. This figure is more tentative. The value of the service will fluctuate year to year reflecting the number of hot days (over 28 degrees Celsius) experienced.
These estimates represent exchange values as they are directly based on economic output and expenditure. Welfare values would be included if the valuation covered the benefits to the general public of, for example, the value of tree shading.
Table 12: Total annual value of cooling from green space and blue space in each of Great Britain's city regions (£'000), 2012 to 2016 average
| Annual value from avoided labour productivity loss | Annual value from air conditioning savings | Total annual value | ||||
|---|---|---|---|---|---|---|
| Total | £159,396 | £6,245 | £165,641 | |||
| Cardiff city Region | £1,304 | £149 | £1,453 | |||
| Edinburgh city region | £110 | £26 | £135 | |||
| Glasgow city region | £116 | £26 | £141 | |||
| Greater Manchester city region | £3,909 | £241 | £4,150 | |||
| Liverpool city region | £1,499 | £241 | £1,740 | |||
| London city region | £135,560 | £4,304 | £139,863 | |||
| North East city region | £161 | £26 | £187 | |||
| Sheffield city region | £2,115 | £159 | £2,274 | |||
| West Midlands city region | £8,804 | £483 | £9,286 | |||
| West of England city region | £2,931 | £432 | £3,363 | |||
| West Yorkshire city region | £2,890 | £159 | £3,049 | |||
| Source: Eftec (2018) “Scoping UK urban natural capital account - local climate regulation extension” | ||||||
| Notes: | ||||||
| 1. Figures may not sum due to rounding. | ||||||
Download this table Table 12: Total annual value of cooling from green space and blue space in each of Great Britain's city regions (£'000), 2012 to 2016 average
.xls (36.9 kB)Noise mitigation
Vegetation can protect against noise pollution, by acting as a physical buffer between the noise pollutant and those nearby. Noise pollution is associated with adverse health outcomes through lack of sleep and annoyance.
Eftec (2018) estimated the value of noise mitigation from urban vegetation in terms of improved amenity and health outcomes. The estimated benefits were for the urban noise reduction on major roads only. Table 13 provides estimates of the number of buildings benefiting from noise mitigation by urban vegetation as well as the annual value of noise mitigation.
The total number of buildings benefiting from noise mitigation by urban vegetation in the UK is given as 167, 000. The total annual value of noise mitigation in the UK based on the avoided loss of quality adjusted life years (QALY) associated with a loss of amenity (sleep and annoyance) and adverse health outcomes due to noise is £14,431,0002.
Valuations based on quality adjusted life years are welfare values based on willingness to pay studies. It is possible to estimate exchange values for health-related benefits by reference to the cost-effectiveness of public health providers in delivering health outcomes. This is an area of further research.
Table 13: Summary physical and monetary flow accounts for the noise mitigation benefits of urban natural capita, United Kingdom, 2017
| Noise band 1 | Number of buildings benefiting from noise mitigation by urban vegetation 2 (‘000s) | ||||
|---|---|---|---|---|---|
| England | Scotland | Wales | Northern Ireland | UK | |
| more than=80 | Less than 1 | - | - | - | |
| 75.0-79.9 | Less than 1 | - | Less than 1 | Less than 1 | |
| 70.0-74.9 | 8 | Less than 1 | Less than 1 | Less than 1 | |
| 65.0-69.9 | 36 | 1 | 3 | 1 | |
| 60.0-64.9 | 98 | 6 | 8 | 4 | |
| Total | 142 | 7 3 | 12 | 6 | 167 |
| Noise band 1 | Annual value of noise mitigation (£’000/yr) | ||||
| England | Scotland | Wales | Northern Ireland | UK | |
| more than=80 | 1 | - | - | - | |
| 75.0-79.9 | 139 | - | 11 | 2 | |
| 70.0-74.9 | 1,041 | 7 | 100 | 53 | |
| 65.0-69.9 | 3,799 | 117 | 295 | 133 | |
| 60.0-64.9 | 7,339 | 454 | 634 | 305 | |
| Total | 12,320 | 578 | 1,040 | 493 | 14,431 |
| Source: Eftec (2018) “Scoping UK urgan natural capital account - local climate regulation extension” | |||||
| Notes: | |||||
| 1. 5 dB bands applied along with guidance in Defra (2014a). | |||||
| 2. Urban vegetation includes large woodlands (>3,000m2) and smaller woodlands (<3,000m2), but not very small woodlands (<200m2). | |||||
| 3. Number of dwellings receiving mitigation in Scotland is likely to be lower than the estimates for the other countries because we used the Lden noise metric rather than the LA1018 metric which was not available for Scotland. | |||||
Download this table Table 13: Summary physical and monetary flow accounts for the noise mitigation benefits of urban natural capita, United Kingdom, 2017
.xls (38.9 kB)Cultural services
Natural areas and vegetation play an important role in providing opportunity for recreation and exercise. Three estimates for cultural services provided by green and blue space in urban areas are provided below. Each focus on a different aspect of cultural services provided and are designed to be complementary, however as it can be difficult to be distinguish between cultural services there will likely be some overlap. Further work is needed to establish the size of the overlaps and if there is a risk of double counting.
Visits to green and blue spaces
In 2015, almost 2 billion trips and 2 billion hours were spent in nature in the urban environment. This service was valued at £2.1 billion in 2015.
Recreational visits in nature are valued based on expenditure on that trip (that is, fuel, public transport costs, admission charges and parking fees). This expenditure is currently assumed to proxy a marginal price for accessing the site. It is therefore an exchange value. It is also possible to derive a welfare value for recreational visits, by applying unit welfare values per trip to the total number of visits, differentiated where appropriate by type of site visited.3
Table 14: Number of visits to urban green space, hours spent and expenditure according to MENE survey (millions), United Kingdom, 2009 to 2016
| 2009/10 | 2010/11 | 2011/12 | 2012/13 | 2013/14 | 2014/15 | 2015/16 | |
|---|---|---|---|---|---|---|---|
| Visits | 1,671 | 1,448 | 1,682 | 1,822 | 1,886 | 1,955 | 1,981 |
| Time Spent at Habitat (hours) | 1,672 | 1,287 | 1,539 | 1,957 | 1,986 | 1,979 | 1,954 |
| Expenditure (£ million) | 2,351 | 2,140 | 2,008 | 2,715 | 2,149 | 2,011 | 2,095 |
| Source: Office for National Statistics and Monitor of Engagement with the Natural Environment (MENE) survey, Natural England | |||||||
Download this table Table 14: Number of visits to urban green space, hours spent and expenditure according to MENE survey (millions), United Kingdom, 2009 to 2016
.xls (35.3 kB)The valuation method has meant that trips that do not incur an out-of-pocket cost are not included in the valuation, therefore these estimates are a significant underestimation. On the other hand, it is possible that expenditure on admission fees will partly reflect a return to other capital and labour inputs, or for access to facilities and services other than those provided by nature, and hence may overstate the value of the ecosystem service to those paying the admission fees.
Most of the free trips (those that do not include a cost) are trips made, possibly quite frequently (such as walking a dog) to local sites. When purchasing a house, it is likely that proximity to local parks and outdoor space are implicitly or explicitly factored into the purchase decision and are therefore embedded in house prices. To capture the value of these local trips an estimate of the value of green space implicit in housing values can be estimated through the hedonic pricing method, described in the final section.
Physical health associated with outdoor recreation
A variety of urban green and blue spaces in the form of parks, public gardens, sports fields and so on offer locations for recreational and leisure activities, which are subsequently associated with physical and mental health benefits for residents.
In the scoping study, Eftec (2017) estimate there were 2.1 million active visitors4 to green and blue spaces in urban areas in 2015, providing 74,000 additional quality adjusted life years to society.
The welfare value is based on HM Treasury Green Book Guidance, where an additional life year in perfect health is valued at £60,000. Therefore, the estimated societal gain associated with active visits to urban green spaces is over £4.4b billion a year. Valuations based on quality adjusted life years are welfare values based on willingness to pay studies. It is possible to estimate exchange values for health-related benefits by reference to the cost-effectiveness of public health providers in delivering health outcomes. This is an area of further work.5
Notes for: What ecosystem services do urban areas provide?
EMEP4UK was a Defra and CEH partnership-funded project that developed and delivered an off-line atmospheric-chemistry transport model (ACTM) based on the EMEP MSC-W model. The model, termed EMEP4UK, is capable of representing UK atmospheric composition in greater detail than larger i.e. European-scale models, with the ability to simulate hourly air pollution interactions over decadal time scales using a 5km grid or finer. The Weather Research Forecast (WRF) model was used as the main meteorological driver.
(a) this is at the lower end of a range reflecting uncertainty over methods and limited data resolution; (b) four approaches are estimated by CEH / Eftec (2018), which range between 167,000 and 8,228,000 buildings benefitting from noise mitigation and £14 million and £245million in annual value from these benefits.
For example, welfare values can be derived from the Outdoor Recreation Valuation Tool (ORVal) developed by the University of Exeter with support from Defra, which is based on an econometric model of recreational demand using MENE visitor data, and covers publicly accessible sites across England and Wales. Although urban centres cannot be selected in ORVal, it is possible to filter sites by land covers associated with urban areas (managed grassland, sports pitches and so on) to give an approximate value per urban site visit. To illustrate for England, the average value per visit of such sites is £3.06 in 2016 values. Applying this to the numbers of visits in the physical account would give a welfare value of £3.06 x 1981 million visits = £5.8 billion per annum.
“Active visitors” defined using the approach of White et al (2016) which identifies visitors that meet: (a) Duration of activity threshold (30 minutes or more) based on Beale et al. (2007) which used Health Survey for England data to estimate that 30min a week of moderate-intense physical activity, if undertaken 52 weeks a year, would be associated with 0.010677 Quality Adjusted Life Year (QALYs)16 per individual, per year; (b) Intensity of activity thresholds (>3 METs - Metabolic Equivalence of Task17) which uses the Compendium of Physical Activities (Ainsworth and others., 2011) MET rates which had been applied to each MENE activity (Elliott and others, 2015))
Eftec adopted a unit value of £20,000 per QALY, which was considered the cost-effectiveness threshold for drug procurement by the National Institute for Health and Care Excellence.
9. The value of nature implicit in the property market
When deciding on a location to live the surrounding environment will usually be included in the decision-making process, for example the proximity to recreational space or aesthetic views from windows could be factored into the decision. Assuming proximity to nature has some impact on property prices, this value can be extracted and estimated using the hedonic pricing method (HPM).
HPM is a regression-based model that can be used to estimate the extent to which characteristics impact price by modelling house prices on a set of explanatory variables, including the structural, socio-economic and environmental characteristics. In this section the impact green and blue space within 200 metres of a property has on the property’s value is estimated. As green and blue spaces can vary in size and function the model is run for different types of green and blue space.
A range of data sources were used in the model. Zoopla data provided information about the property sales and property characteristics, such as number of bedrooms. Ordnance Survey data provided information about green and blue space, as well as other amenities and plot size and outdoor space. Consolidated Analysis Centre Inc. (CACI) data provide the socio-economic data, such as income and crime rates.
Full methodology is available in the methodology section of this release.
How to interpret estimates
This method will estimate a bundle of cultural services, and possibly some regulating and provisioning. It is not possible presently to disentangle why nature near property is important to the buyer, for example it could be it is aesthetically pleasing or for recreational purposes, the services it provides in clean air and protection from noise pollution could also be factored in. Currently, estimates are considered a bundle of ecosystem services also it is expected that these will be mainly cultural.
The estimated value of green and blue space implicit in the total provided stock in Great Britain is provided, but further work is needed to develop the annual service value.
All estimates are initial and experimental, therefore will be developed further in the future and subject to substantial revisions.
The model has controlled for a wide range of house and socio-economic characteristics, however, there is always a possibility that an important variable has been omitted. Therefore, estimates of the association between green and blue spaces and property prices may not reflect a causal relationship. That said, high R-squared values indicate that the model explains over 80% of the variance in house prices, suggesting that many factors relevant for determining house prices have been included.
What impact does green and blue space have on property prices?
Results indicate that as the size of green and blue space increases, the percentage change to the property also increases. Functional green space and blue space have a positive effect, when natural land cover is considered the effect is negative.
The impact different types of green and blue space have on property price are displayed in Table 15.
Table 15: Percentage change in property price in the presence of different natural capital assets within 200 metres of the property 2009 to 2016
| Presence of natural capital asset | 200m | |
|---|---|---|
| Functional green space | Small | 0.50% |
| Medium | 0.60% | |
| Large | 1.00% | |
| Very large | 1.40% | |
| Blue space | Small | 0.90% |
| Medium | 1.00% | |
| Large | 1.20% | |
| Very large | 3.60% | |
| Natural land cover | Small | -3.40% |
| Medium | -4.10% | |
| Large | -4.20% | |
| Very large | -4.30% | |
Download this table Table 15: Percentage change in property price in the presence of different natural capital assets within 200 metres of the property 2009 to 2016
.xls (35.8 kB)Very large areas of functional green space and blue space within 200m have the largest positive impact on property prices, resulting in an increase of 1.4% and 3.6% respectively.
Proximity to natural land cover, which includes all areas of green space including small areas of vegetation such as roadside vegetation, has a negative effect on property prices. A very large area of natural land cover within 200m is associated with 4.3% lower property prices. A reason for this could be properties surrounded by more natural features tend to be further from city centres and there is some characteristic variable that has been omitted. Also, the property may be near a major road or train track or derelict area that is likely to have surrounding vegetation. It suggests the functionality of the green space is an important factor, as those sites that can be utilised for a specific purpose and have likely been modified is valued more highly for its cultural benefits.
What is the implied value of green and blue space with a specific function implicit in the housing stock of the UK?
Based on the analysis presented above a model was built to predict property prices based on structural and environmental variables. The estimated average value of a property in Great Britain is £246,010, and on average the value of functional green and blue space implicit in the property value is £4,813.
This is the difference between predicted average property prices in our test data £246,010 and the predicted average property price in the absence of green and blue spaces £241,197. If this figure is multiplied by the number of residential properties (27.2 million), we obtain an estimate of £130.9 billion for the stock value of blue and green spaces. This estimate relies on the assumption that the sample used is representative of the property stock and the value implicit in property price is the same in Northern Ireland.
Back to table of contents10. Next steps
Future development of the extent account would use the most up to date version of the Land Cover Map (LCM015) to disaggregate the land cover within the urban boundary, currently the LCM2007 is used and land changes since this time especially in urban areas may be substantial.
More work also needs to be done to measure the extent of linear natural capital features such as hedgerows and street trees which are major components of the urban fabric but are not currently included.
The ONS (2017) principles paper and Natural England (2017) set out a number of condition indicators which we aim to include in future accounts, these include indicators based on biodiversity, water quality, air quality etc. Additionally, the condition indicators present in this account need to include a times series so changes to the condition of natural capital assets can be assessed over time.
A partial ecosystem service account has been included in this account, however future development is needed to make the service account compatible with other broad habitat accounts (for example, disaggregated by habitats within the urban area so double counting is avoided).
The hedonic pricing method provided experimental estimates of the value of green and blue spaces. Further work is needed to expand these results to UK estimates (currently Great Britain) and assess how the stock value can be transformed into annual flow values. Methodologically the use of data from the Valuation Office Agency and the Land Registry in future iterations may improve the robustness of estimates.
Back to table of contents11. Methodology
Food
Using a variety of sources Eftec (2017) estimated the amount of allotment plots in the UK to be between 280,000 and 330,000 (Pretty, 2000; NSALG; Crouch, 2006). Of these allotments 55% are said to be within urban areas (UKNEA, 2011) and 10% are thought to be unoccupied (Crouch, 2006). This gives an estimated number of urban allotment plots of 163,350. Cook (2006) quotes the productivity per plot at 487kg per year which is taken from a RHS 1975 study. This provides an estimated total production of 80,000,000 kg per year.
Based on the estimated 163,350 plots in the UK urban areas and the value of £695 which Cook (2006) estimated to be the average productivity of allotments (after being adjusted to 2016 prices), the estimated value of urban allotment food production is given as £114million per year.
Global climate regulation (carbon)
The methodology followed that of Eftec (2017). According to the Forestry Commission there is an estimated 3.15 million Ha of woodland in the UK at March 2015 (Forestry Commission, 2015). The ONS (2017) estimated that woodland in the UK sequestered 17MtCO2e of carbon in 2015, suggesting an average rate of sequestration of 5.4tCO2e/ha per year. Applying this to the estimated area of urban woodland within the UK of 99,397ha (using OS Mastermap), results in the estimated carbon sequestered in 2015 being 537,000tCO2e per year.
The estimated carbon sequestration in 2015 of 537,000tCO2e per year. The unit value per tonne of non-traded carbon in 2015 (BEIS, 2017) is £61/tCO2e per year giving a total estimated value across all UK urban woodland £35.4m for 2015.
Air filtration
EMEP4UK modelling was used to estimate the amount of fine particulate matter (PM) 2.5 removed by vegetation in UK urban area. This is expected to be an underestimation of the true amount due to the use of the Land Cover Map (LCM) 2007 in the identification of natural capital assets. As the LCM 2007 has a relatively coarse resolution, specific natural features such as street trees are likely to of been omitted from the analysis.
The Centre for Ecology and Hydrology (CEH) (2017) in their report “Developing Estimates for the Valuation of Air Pollution Removal in Ecosystem Accounts” for ONS developed physical accounts for six pollutants (PM10, PM2.5, sulphur dioxide (SO2), ammonia (NH3), nitrogen dioxide (NO2), ozone (O3)). In the urban account, only 2015 and 2030 were calculated. Health and monetary accounts were presented for four pollutants with damage costs available (PM2.5, SO2, NO2, O3) for the same years.
Urban cooling and Noise mitigation
Please see the following Eftec (2018) reports:
Scoping UK urban natural capital account – Local climate regulation extension
Scoping UK urban natural capital account – Noise extension
Recreational visits
Physical data for the number of visits to urban green spaces are from Natural England’s Monitoring Engagement in the Natural Environment (MENE) survey, which also collects data for spending during trips. Trips to urban green space are separated from other visits by using only visit data for those who chose one or more of the options “Townpark, Allotment, Path, Playground, Playfield, Town, Village” when answering the question, “Which of the following list of types of place best describe where you spent your time during this visit?”. Where a person has selected two or more habitats, for example, woodlands and urban, then one visit is allocated to woodlands and one to urban. The monetary valuation is divided by the number of habitats visited, therefore in this example, half the value of the visit would be allocated to woodlands and half to urban to better represent value derived from each habitat.
The recreation estimates were developed by Ricardo-AEA, who also reviewed various different methods of valuing recreation. It was concluded only admission fees and travel expenditure should be included in the valuation as including the opportunity cost of time presents considerable problems. However, this will cause an underestimation, as the value of visits that have incurred no cost, for example, walking a dog locally in a city park, will not be captured.
Physical health from outdoor recreation
This is based on evidence from the Monitor of Engagement with the Natural Environment (MENE) survey of the number and frequency of users or visitors to the urban natural environment and the activities undertaken by these users (that is physical activity of different intensities or durations) to estimate “active visits” in England that meet physical activity guidelines (150 minutes (or more) at adequate intensity. CMO, 2011) The analysis estimates there to be 2.1 million active visitors in in 2015, providing a Quality Adjusted Life Year (QALY)estimate of 74,000 QALYs (Eftec, 2017), For more information see Eftec (2017) scoping study.
Value of nature implicit in property prices – Hedonic Pricing Method (HPM)
See supplementary note attached to this release.
Back to table of contents