1. Main points
- Productivity in publicly funded adult social care services grew by 1.0% in the financial year ending (FYE) 2020, its fastest annual rate of growth since FYE 2012.
- Inputs grew for the fifth consecutive year with a growth of 1.1% in FYE 2020, while output grew almost twice as fast, delivering higher productivity.
- The 1.3% quality adjustment made the largest contribution, and its pace of growth was the fastest since FYE 2012.
- Productivity growth in residential and nursing care, which makes up a third of adult social care spending, was negative for a fifth consecutive year, falling by 0.7% in FYE 2020.
This release covers the period from FYE 1997 to FYE 2020, and only briefly overlaps with the period affected by the coronavirus (COVID-19) pandemic. As our productivity estimates are based on data aggregated by financial year, it is not yet possible to determine what impact coronavirus has had on the trends in this series.
2. Productivity
Productivity in publicly funded adult social care (ASC) services grew by 1.0% in the financial year ending (FYE) 2020, which was the fastest rate of growth for eight years. The growth rate in FYE 2020 reverses the trend of the previous two years when productivity growth was negative.
Figure 1: Productivity grew at its fastest annual rate of growth since FYE 2012
Public service adult social care quality adjusted productivity, financial year ending (FYE) 1997 to FYE 2020

Source: Office for National Statistics – Public Service Productivity
Notes:
- Output is quality adjusted from FYE 2012 onwards, except FYE 2015 because of a change in data coverage. No equivalent data are available to quality adjust output before this.
- No productivity change is calculated for FYE 2015 because of a change of data source.
- The bars, showing year-on-year growth, are referenced to the right-hand side axis and the line, showing the productivity index, is referenced to the left-hand side axis.
Download this image Figure 1: Productivity grew at its fastest annual rate of growth since FYE 2012
.png (43.2 kB) .xlsx (16.9 kB)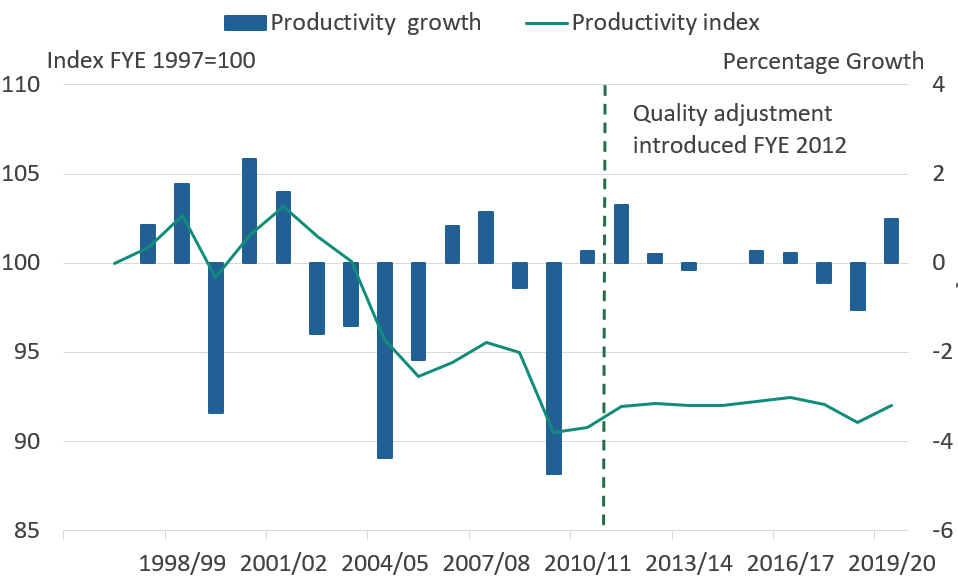
There has been an overall fall in productivity over the whole series, which means there is now 8.0% less output provided for each unit of input compared with FYE 1997. However, although ASC productivity accounts for the effect of changes in the primary care groups of clients over time, it does not capture changes in the complexity of needs within these groups. In addition, there are some changes to methods during the series, including the introduction of a quality adjustment from FYE 2012 onwards. As a result these estimates are not definitive, so care must be taken when comparing productivity over the whole series.
The level of productivity of publicly funded adult social care services cannot be compared with other service areas – only changes over time can be analysed.
Back to table of contents3. Inputs and output
Productivity is estimated by comparing growth in the total quantity of inputs used with growth in the total quantity of output. Output represents the amount of adult social care (ASC) services provided, adjusted for quality, while inputs represent the resources used to provide these services. Figure 2 shows a productivity increase in the financial year ending (FYE) 2020 because output growth exceeded input growth.
Figure 2: In FYE 2020, quality-adjusted output grew almost twice as fast as inputs
Public service adult social care inputs and output, financial year ending (FYE) 1997 to FYE 2020
Source: Office for National Statistics – Public Service Productivity
Notes:
- Output is quality adjusted from FYE 2012 onwards, except FYE 2015 because of a change in data coverage. No equivalent data are available to quality adjust output before this.
Download this chart Figure 2: In FYE 2020, quality-adjusted output grew almost twice as fast as inputs
Image .csv .xlsBetween FYE 2003 and FYE 2006, growth in inputs consistently exceeded growth in output, causing productivity to fall. Between FYE 2013 and FYE 2018, the growth of inputs and output varied relatively little.
Inputs
Inputs cover the labour, intermediate consumption of goods and services, and capital used by local authorities in providing ASC services, as well as inputs used in providing care purchased from independent sector providers. More information on inputs can be found in Section 7: Data sources and quality.
Figure 2 shows that inputs grew by 1.1% in FYE 2020. This was the fifth consecutive year of growth since FYE 2015, following five consecutive years of falling inputs from FYE 2011 to FYE 2015.
Although the level of inputs in FYE 2020 was just over 50% higher than in FYE 1997, most of this increase occurred between FYE 2002 and FYE 2006. Since FYE 2006, the total growth of inputs has been only 2.6%.
Output
Output measures the amount of ASC services provided each year. In this section we describe output both before and after it is adjusted to account for changes in the quality of services.
Output is either measured directly where we have activity data and can calculate unit costs, or if no activity data are available, by assuming output growth equals input growth. For more information on how we measure output, see Section 7: Data sources and quality.
Figure 3 shows that the quantity of publicly funded ASC services provided in FYE 2020 grew by 0.7%, which was around a third higher than in FYE 1997. When adjusted for quality, output grew by 2.1% between FYE 2019 and FYE 2020, meaning the quality of services grew by 1.3% over this period.
Figure 3: In FYE 2020 quality-adjusted output grew at the fastest rate since FYE 2016
Public service adult social care non-quality- and quality-adjusted output, financial year ending (FYE) 1997 to FYE 2020
Source: Office for National Statistics – Public Service Productivity
Notes:
- Output is quality adjusted from FYE 2012 onwards, except FYE 2015 because of a change in data coverage. No equivalent data are available to quality adjust output before this.
Download this chart Figure 3: In FYE 2020 quality-adjusted output grew at the fastest rate since FYE 2016
Image .csv .xlsThe quality adjustment measures changes in how well needs are met across domains of quality of life that are affected by social care, while taking account of factors outside the control of ASC services. More information is available in Public service productivity: adult social care, sources and methods, 2019 update.
Since its introduction in 2012, the quality adjustment has had a positive effect on output growth, except in FYE 2019 when the quality adjustment was negative. The 1.3% increase in the output quality adjustment in FYE 2020 was the fastest period of growth since FYE 2012.
Back to table of contents4. Residential and nursing care productivity
This section analyses productivity in residential and nursing care – the only services in these adult social care (ASC) statistics that are measured directly using activity data across the whole series, except from FYE 2015 when there was a change in data collection.
Services provided in residential and nursing care settings accounted for 33% of ASC spending in the financial year ending (FYE) 2020, compared with 45% in FYE 1997.
Figure 4: Residential and nursing care productivity fell by 0.7% in FYE 2020, its fifth consecutive year of negative growth
Public service residential and nursing care; inputs, and quality-adjusted and non-quality-adjusted output and productivity, financial year ending (FYE) 1997 to FYE 2020
Source: Office for National Statistics – Public Service Productivity
Notes:
- No productivity change is calculated for FYE 2015 because of a change of data source.
- Output is quality adjusted from FYE 2012 onwards, except FYE 2015 because of a change in data coverage. No equivalent data are available to quality adjust output before this.
Download this chart Figure 4: Residential and nursing care productivity fell by 0.7% in FYE 2020, its fifth consecutive year of negative growth
Image .csv .xlsThe quality adjustment for residential and nursing care services grew by 0.3% in FYE 2020, which was the first improvement since FYE 2017. As a result, quality adjusted output grew for the first time since the adjustment was introduced in FYE 2012. Despite this, inputs growth was greater than quality adjusted output, therefore quality adjusted productivity fell by 0.7% in FYE 2020.
The overall effect of the quality adjustment since its introduction in FYE 2012 has been negligible for residential and nursing care services, with little variation between the non-quality adjusted and quality adjusted productivity indices.
Back to table of contents5. Revisions
This section presents revisions to adult social care (ASC) productivity compared with the previous edition, Public service productivity: adult social care, England, financial year ending 2019.
Figure 5: Productivity has been revised up slightly because of changes to quality adjustment and short-term care measurements
Revisions to public service adult social care productivity, financial year ending (FYE) 1997 to FYE 2019

Source: Office for National Statistics – Public Service Productivity
Notes:
- No productivity change is calculated for FYE 2015 because of a change of data source.
- Output is quality adjusted from FYE 2012 onwards, except FYE 2015 because of a change in data coverage. No equivalent data are available to quality adjust output before this.
Download this image Figure 5: Productivity has been revised up slightly because of changes to quality adjustment and short-term care measurements
.png (56.5 kB) .xlsx (17.3 kB)
Overall productivity growth has been revised upwards by 0.3% compared with FYE 2019. This is predominantly because of a 0.3% revision to quality adjusted output growth.
There are two sources of revisions to output. Firstly, the quality adjustment for community care was revised to modify the method for weighting local authorities. Secondly, short term care has been changed from directly to indirectly measured because of uncertainty about the consistency of activity data reporting.
Inputs and output have been revised because of regular updates to capital consumption data in the annual National Accounts.
Back to table of contents7. Data sources and quality
Coverage of the statistics
Adult social care (ASC) services provide care and support to older people, adults with learning or physical disabilities, adults with mental health problems, drug and alcohol misusers, and carers. Therefore, although care homes form a part of ASC productivity, the overall scope of ASC services is much wider.
This publication covers publicly funded ASC services, including both local authority funding and contributions from the NHS. Privately funded ASC services are excluded from inputs, output, and productivity. However, publicly funded services provided by independent sector providers are included.
Methods
Public service productivity is estimated by comparing growth in the total quantity of inputs used with growth in the total quantity of output provided, adjusted for quality. If the growth rate of output exceeds the growth rate of inputs, productivity increases, meaning more services are being provided for the resources used. While these productivity estimates provide a measure of the amount of service provided for each unit of input used, they do not measure value for money.
Inputs are composed of labour, goods and services, and capital consumption, and are measured on a volume basis, using expenditure adjusted for the specific input cost inflation rates faced by ASC services.
Quantity output is measured directly, by calculating the growth rates of different ASC activities and weighting by their unit costs. For services where activity data are not available, output growth is measured by assuming output growth to be equal to inputs growth, before quality adjustment.
A quality adjustment is applied to output to account for changes in service quality, which measures changes in how well care clients’ needs are met across domains of quality of life that are affected by social care, while taking account of factors outside the control of ASC services.
Data sources
The expenditure and activity data used to calculate the quantity output and inputs are taken from NHS Digital’s Adult Social Care Activity and Finance Report and its predecessor publications.
We prefer to directly measure output, however, limitations in the availability of activity data mean we must use alternative approaches, as explained in the output section of our methodology article.
The deflators used to convert expenditure data into inputs are taken from a variety of sources, including labour inflation measures produced by the Department of Health and Social Care (DHSC) using Skills for Care data, LaingBuisson and Office for National Statistics (ONS) series.
The quality adjustment is produced using data from the NHS Digital Adult Social Care Survey. The survey during the financial year ending (FYE) 2020 was partially affected by the start of the coronavirus (COVID-19) pandemic, with some effects on survey fieldwork and data entry, and some potential impact on survey respondent behaviour. This is detailed in the Data quality report for the ASCS (PDF, 682KB). It is difficult to assess any bias this introduces, but users should treat this with some caution.
For further information, Public service productivity: adult social care, sources and methods, 2019 update provides a description of the methodology, and the Public service productivity: adult social care QMI provides an overview of the measures, and information about their strengths and weaknesses. The data series are revised with each release with revisions included in the accompanying dataset.
Back to table of contents