Table of contents
1. Main points
Output per hour in the UK was 18 percentage points below the average for the rest of the major G7 advanced economies in 2014, the widest productivity gap since comparable estimates began in 1991. On an output per worker basis, UK productivity was 19 percentage points below the average for the rest of the G7 in 2014.
Across the G7 as a whole, labour productivity as measured by real (inflation adjusted) output per hour and output per worker grew modestly in 2014. Output per hour was lower in all G7 countries in 2014 than would have been the case if pre-downturn trends had continued since 2007. The UK’s “productivity gap” of about 14% is about twice as large as the gap for the rest of the G7.
Revisions to source data have led to extensive revision since the last release, including upward revisions to productivity estimates for Germany and downward revisions to US productivity.
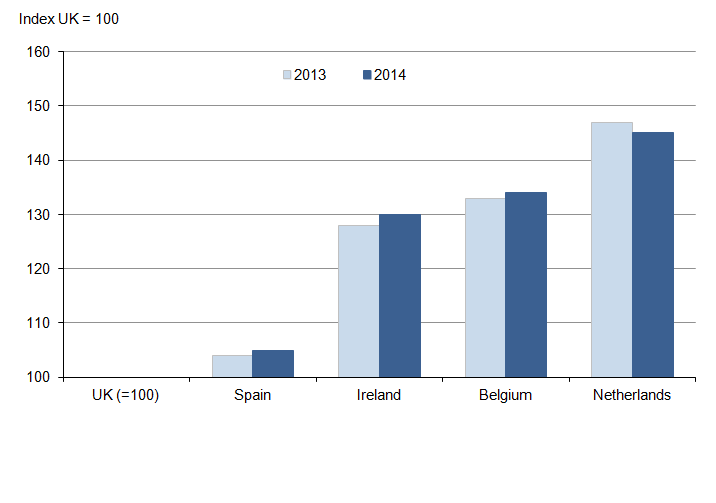
This release also includes productivity comparisons with some of the UK’s major trading partners outside the G7. In 2014, UK output per hour was 5 percentage points lower than Spain and considerably lower than productivity in Ireland, Belgium and the Netherlands.
For the first time this release includes indicative productivity comparisons for sub-sectors of the economy between the UK, the US, Germany, France and Italy. These comparisons employ the same methodology as the estimates for the whole economy, but are not wholly consistent with the whole economy estimates.
The results show that UK labour productivity trails behind the US in all sub-sectors and particularly in manufacturing. Comparisons with other European countries are more mixed. For manufacturing, UK output per hour is estimated to be above that of Italy, and UK output per worker is a little higher than equivalent estimates for Germany and France.
In financial services, the UK’s comparative productivity has deteriorated sharply since 2009 and trails France and Italy as well as the US. For private non-financial services (easily the largest component), the UK’s comparative productivity has also deteriorated since 2009 and UK output per hour trails well behind France, Germany and the US.
Back to table of contents2. About this release
This bulletin contains annual estimates of labour productivity for the G7 developed countries (Canada, France, Germany, Italy, Japan, UK and USA) up to 2014. Labour productivity measures the amount of economic output that is produced by a unit of labour input, and is an important measure of economic performance.
Output is measured by gross domestic product (GDP). Labour input is measured in 2 ways – by total hours worked and by numbers of workers in employment. These 2 measures of labour input can yield different results, reflecting differences in working patterns across countries and compositional movements over time, such as a shift towards part-time working.
Comparability across countries is achieved by using estimates of GDP and labour inputs from a common source (the Statistics Directorate of the Organisation for Economic Co-operation and Development (OECD)) as far as possible and by converting local currency based measures of GDP using purchasing power parity (PPP) exchange rates. PPP exchange rates (usually referred to simply as PPPs) attempt to equalise the cost of a representative basket of goods and services in countries with different national currencies. An article explaining the uses and limitations of PPPs is available on our website.
The estimates in this release update those published on 18 September 2015. This release cycle reflects the publication and revision cycles of the component data series.
We are currently undertaking a review of our productivity publications and are consulting with you on publishing the estimates currently included in this release alongside other productivity estimates to create a more unified presentation of productivity metrics and enable a richer analysis to be presented. Your opinions and views would be appreciated and can be sent by email to productivity@ons.gov.uk
Back to table of contents3. Interpreting these statistics
The labour productivity measures in this bulletin are presented in terms of "current prices", suitable for cross-country comparison of levels of productivity for a single year, and "constant prices", suitable for analysis of productivity performance over a number of years. The current price estimates in the international comparisons of productivity final estimate dataset tables 1 and 2 (256 Kb Excel sheet) should be read horizontally, while the constant price estimates in the international comparisons of productivity final estimate dataset tables 3 and 4 (256 Kb Excel sheet) should be read vertically1.
Current price productivity estimates are indexed spatially to UK=100 for each year and show each country’s productivity relative to that of the UK in that year. Since productivity is an important determinant of living standards, these estimates also provide an indication of living standards relative to the UK.
In interpreting these estimates users should bear in mind that PPPs provide only an approximate conversion from national currencies and may not fully reflect national differences in the composition of a representative basket of goods and services. Additionally, care should be taken in interpreting movements in current price productivity estimates over time. For example, an increase in UK productivity relative to another country could be due to UK productivity growing faster, or falling less, or due to changes in relative prices in the 2 countries, or some combination of these movements.
Constant price productivity estimates are indexed to a particular year. For each single country, these estimates are almost identical to national labour productivity series (minor differences from national sources are described in the background notes to this bulletin). The index year is set at 2007 in order to focus on movements in labour productivity over the economic downturn.
Constant price productivity estimates show the evolution of productivity for each country and for the G7 (and G7 excluding the UK) aggregates, but should not be used to compare productivity across countries at a point in time. Productivity growth can be decomposed into growth of output minus the growth of labour input, and these components can move in different directions within and across countries. This should be borne in mind in interpreting the constant price productivity estimates in this release.
More information on methodology and interpretation is available in the background notes to this bulletin. Additionally, the Quality and Methodology Information paper (123.8 Kb Pdf) for this release provides information on the quality of the estimates in this release, as well as providing a summary of methods used in compiling the estimates.
Notes for interpreting these statistics
- All estimates are also available in hard copy at the back of the PDF version of this statistical bulletin.
4. Current price productivity
Current price productivity estimates allow for comparison of how much economic output, measured in common currency terms, is produced by each hour worked and by each worker across countries in a particular year, relative to the UK=100. Further information is available in the international comparisons of productivity final estimate dataset tables 1 and 2 (256 Kb Excel sheet).
Current price GDP per hour worked (Table 1)
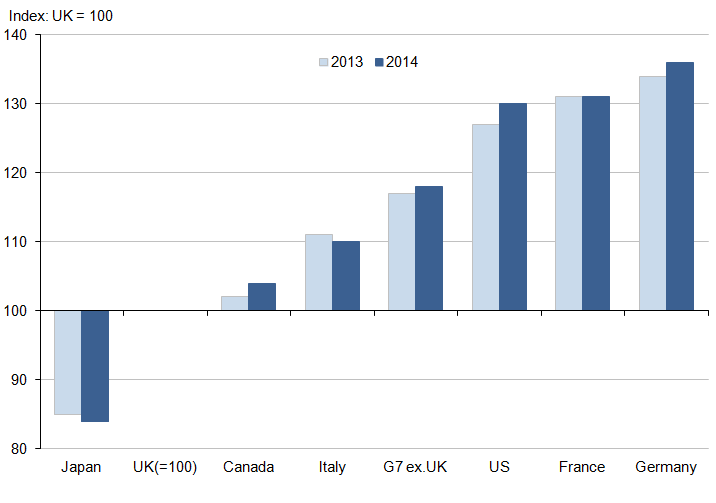
UK productivity measured as GDP per hour worked in 2014 was:
above that of Japan by 16 percentage points
lower than that of Canada by 4 percentage points
lower than that of Italy by 10 percentage points
lower than that of the US and France by 30 to 31 percentage points
lower than that of Germany by 36 percentage points
lower than that of the rest of the G7 by 18 percentage points
Figure 1: GDP per hour worked, G7 countries
2013 and 2014
Source: Office for National Statistics
Download this image Figure 1: GDP per hour worked, G7 countries
.png (11.1 kB) .xls (63.5 kB)
Comparing 2014 with 2013, the UK productivity differences relative to Canada, Germany, and the US all widened, while the productivity difference relative to Italy narrowed and the productivity advantage over Japan widened. The UK's shortfall relative to the rest of the G7 countries as a whole widened to the largest shortfall since records began in 1991. The UK’s shortfall to Germany increased by 2 percentage points and is the widest recorded against a G7 country.
The datasets (256 Kb Excel sheet) contain estimates of net domestic product (NDP) per hour worked (Table 9). NDP is GDP less consumption of fixed capital (CFC). Across the G7 countries the UK has the lowest share of CFC and Japan has the highest share. UK NDP per hour worked was 13 percentage points below the average across the rest of the G7 in 2014.
Current price GDP per worker (Table 2)
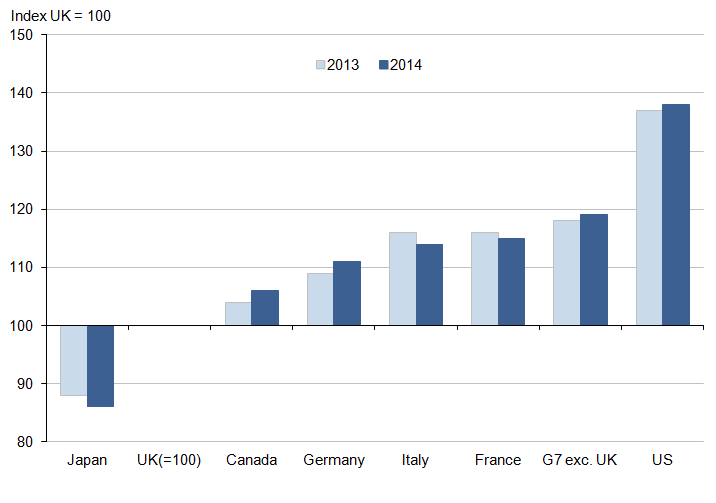
Final estimates for 2014 show that UK output per worker was:
above that of Japan by 14 percentage points
below that of Canada and Germany by 6 and 11 percentage points respectively
below that of Italy and France by 14 and 15 percentage points respectively
below that of the US by 38 percentage points
below that of the rest of the G7 by 19 percentage points
Figure 2: GDP per worker, G7 countries
2013 and 2014
Source: Office for National Statistics
Download this image Figure 2: GDP per worker, G7 countries
.png (10.3 kB) .xls (63.5 kB)
Comparing 2014 with 2013, UK productivity shortfalls increased relative to Canada, Germany and the US and narrowed relative to Italy and France. Japan’s productivity shortfall relative to the UK increased by 2 percentage points over this period.
As illustrated in Figure 3, there are significant differences in average weekly hours worked across the G7, reflecting cultural and compositional differences between economies. Different movements in average hours across countries account for differences in the patterns of productivity shown in Figures 1 and 2. For example, the productivity gap between the UK and the US is wider in terms of output per worker than in terms of output per hour because, on average, US workers work more hours than UK workers. On the other hand, the productivity differential between the UK and Germany is wider in terms of output per hour than in terms of output per worker, as German workers work fewer hours than their UK counterparts.
Figure 3: Average weekly hours per worker, G7 countries
1993 to 2014
Source: Office for National Statistics
Download this chart Figure 3: Average weekly hours per worker, G7 countries
Image .csv .xlsGenerally there has been a trend across the G7 countries towards lower working hours, perhaps reflecting workers choosing more leisure time as productivity and living standards have increased over time. Figure 3 suggests that this trend has slowed or gone into reverse in a number of G7 countries, including the UK, since the economic downturn. Furthermore, the UK labour market has performed relatively strongly compared with the G7 countries, following the economic downturn. Since 2010, out of the G7 countries the UK has the second highest average employment growth rate, behind the US only. This along with a rise in average weekly hours worked has been a contributor to the UK’s widening productivity differential against the rest of the G7.
Back to table of contents5. Constant price productivity
Constant price productivity estimates are indexed to 2007=100 and show the evolution of labour productivity for each country and group of countries over time. Further information is available in the international comparisons of productivity final estimate dataset tables 3 and 4 (256 Kb Excel sheet). The following commentary focuses on GDP per hour worked, which, by allowing for movements in average hours worked, provides a more comprehensive measure of movements in productivity than GDP per worker.
Constant price GDP per hour worked (Table 3)
Figure 4 shows GDP per hour worked for the UK and an aggregated series for the rest of the G7, together with simple projections based on average productivity growth over 1997 to 2007, that is, before the global economic downturn. On this basis, the combination of strong UK productivity growth up to 2007 and weak productivity performance since 2007 implies a productivity gap (measured as actual below trend) of around 14% in 2014. That is, under a counterfactual scenario where UK productivity had continued to grow at its pre-downturn trend since 2007, output per hour in 2014 was around 14% lower and average living standards were commensurately lower too.
Figure 4: Constant price GDP per hour worked, actuals and projections
1997 to 2015
Source: OECD, Office for National Statistics
Download this chart Figure 4: Constant price GDP per hour worked, actuals and projections
Image .csv .xlsAverage annual productivity growth between 1997 and 2007 for the rest of the G7 was lower than in the UK (around 1.9% per year, about 0.3% per year lower than average productivity growth in the UK). Since 2007, productivity growth across the rest of the G7 has been stronger. This implies a narrower productivity shortfall for the rest of the G7 of around 7% in 2014.
An important point to flag in relation to Figure 4 is that the projections are extrapolated from 2008. However, when one reviews the performance of the G7 excluding the UK (G7xUK), there is a plausible case to be made that the slowdown in productivity growth began in 2005, preceding the economic downturn, rather than commencing as a result of this event. Commencing the extrapolation from 2005 would deliver a larger gap for the G7xUK than that shown in this figure.
Figure 5 illustrates the difference in productivity trajectories over recent years between the main European economies on the one hand, and North America on the other hand. Output per hour fell in most countries during the downturn in 2008 to 2009, before rebounding sharply in Japan, Canada and the US. But a slowdown in productivity growth can be observed in several countries before this; with German productivity growth slowing from 2004, whilst Italy has demonstrated no substantive productivity growth since 2000. Comparing average productivity growth rates since 2007 the UK ranks second bottom: only Italy has a weaker average productivity growth rate over this period.
Figure 5: Constant price GDP per hour worked, selected G7 countries
1997 to 2015
Source: OECD, Office for National Statistics
Download this chart Figure 5: Constant price GDP per hour worked, selected G7 countries
Image .csv .xlsConverting the time series in Figure 5 into productivity gaps in 2014 relative to extrapolations of pre-downturn trends (as in Figure 4) would yield gaps of around 10% for France, around 7% for the US and Germany, around 6% for Italy and Japan and around 3% for Canada. The reason why the productivity gap for Italy is much narrower than that for the UK, despite a similarly weak trajectory since the economic downturn, is that the UK productivity trajectory prior to the downturn was much stronger than Italy's.
Back to table of contents6. Comparisons with other countries (not National Statistics)
In this section we update estimates for productivity comparisons between the UK and a group of smaller European countries last published in February 2015. These estimates are compiled using the same methods and sources as for the G7 estimates in this release but have not yet been assessed by the UK Statistics Authority and therefore do not have National Statistics status.
Current price comparisons of GDP per hour worked are shown in Figure 6 for 2013 and 2014. Longer time series are available in Table 5 (GDP per hour) and Table 6 (GDP per worker) in the datasets (256 Kb Excel sheet) component of this release. In 2014, Spain, Ireland and Belgium all saw a widening of their productivity differentials over the UK to 5, 30 and 34 percentage points respectively. The Netherlands’ productivity advantage over the UK is estimated to have narrowed by 2 percentage points between 2013 and 2014, but was still the largest of these smaller countries.
Figure 6: Current price GDP per hour worked, additional countries
2013 and 2014
Source: OECD, Office for National Statistics
Download this image Figure 6: Current price GDP per hour worked, additional countries
.png (8.2 kB) .xls (63.5 kB)
Constant price estimates of output per hour for these additional countries are shown in Figure 7, with UK estimates included for comparison. These series can be compared with the G7 estimates in Table 3. Figure 7 shows that since the economic downturn, Ireland, Spain and the Netherlands have all experienced relatively rapid growth of output per hour.
In the case of Spain this is in sharp contrast to a trend decline in labour productivity prior to the economic downturn. Indeed, the Spanish productivity gap in 2014 calculated on the same simple extrapolation as for the G7 countries above was minus 13% (that is, productivity in 2014 was 13% above an extrapolation of the pre-downturn trend).
Figure 7: Constant price GDP per hour, additional countries
1997 to 2015
Source: OECD, Office for National Statistics
Download this chart Figure 7: Constant price GDP per hour, additional countries
Image .csv .xls7. Revisions
Historical data used in this publication are subject to revision between publications. The international comparisons of productivity final estimate dataset tables R1 to R4 (256 Kb Excel sheet) compare the latest estimates with estimates from the previous release on 18 September 2015. Note that because Tables 1 and 2 are indexed to UK=100, revisions to the UK are zero by definition in Tables R1 and R2.
The main revisions since the previous edition published on 18 September 2015 are as follows:
Since 2011, Germany’s level of employment is now estimated to be about 2.5% lower than previously estimated. The reason for this revision is that from 2011, a new extrapolation factor for the Labour Force Survey is used. It is based on the Census 2011 in Germany. Because of this, results of the Labour Force Survey have been revised downwards retrospectively. This creates a break in the German employment time series between 2010 and 2011 and accounts for most of the upward revisions to German productivity estimates.
Similarly, Italy’s employment has been revised downwards every year since 2004. From 2004, weights are based on the population estimates derived from the 2011 Census. In the new survey, the coefficients used to estimate the population from the sample were modified.
PPPs have been revised as part of the triennial benchmarking exercise, since the last edition of this release. The largest revisions occur from 2012. The effect of the recent revisions is broadly to reduce the value of US output relative to other countries and raise the value of the rest of the G7 GDP in dollar terms (thus narrowing the level of the US productivity differential over the UK since the last release).
In 2014, PPPs of the G7 European economies are between 1.1% and 1.4 % higher than previously estimated. Canada has the largest upward revision to its PPP at 2.2%.
Since the previous edition of this release, upward revisions to UK GDP have been incorporated into OECD. More information on revisions introduced in Blue Book 2015 is available on our website.
The national accounts from Statistics Canada have been revised in December 2015. These comprehensive revisions have generated GDP revisions back to 1990. As such, the average level of current price GDP was revised upward between 1990 and 2009 and downward between 2010 and 2014. However, the average revision to growth of real GDP is zero.
UK employment has been revised upwards since 2003.
Among the additional countries, revisions (since our February 2015 edition) include upward revisions to Irish real GDP growth and upward revisions to Dutch and Spanish average hours. PPPs for all 4 additional countries have been revised in line with the PPP revisions for Germany, France and Italy noted above.