Table of contents
- Main points
- Latest indicators at a glance
- Online job adverts
- UK Spending on debit and credit cards
- Road traffic in Great Britain
- Business impacts and insights
- System average price (SAP) of gas
- Shipping
- Retail footfall
- OpenTable seated diners
- UK Flight data
- Social Impact of coronavirus
- Companies house data
- Data
- Glossary
- Measuring the data
- Strengths and limitations
- Related links
1. Main points
The total volume of online job adverts grew by 3% from the previous week, to 139% of its February 2020 average level; the highest level of job adverts relative to February 2020 continues to be in the "transport, logistics and warehouse" category at 378% (Adzuna). Section 3.
In the week to 30 September 2021, the aggregate CHAPS-based indicator of credit and debit card purchases increased by 5 percentage points from the previous week, to 100% of its February 2020 average; this was driven by a large increase in “work-related” category, which includes spending on road fuel as well as increases in the “staple” and “social” spending categories (Bank of England CHAPS data). Section 4.
The volume of motor vehicle traffic on Monday 4 October 2021 was at 96% of its level in the first week of February 2020, broadly unchanged from the previous week (Department for Transport). Section 5.
In the week ending 3 October 2021, the seasonally adjusted average count of traffic camera activity for cars in London fell by 7% from the previous week, to 107% of the average level seen in the week before the first UK-wide lockdown (week ending 22 March 2020) (Transport for London). See the accompanying dataset.
Of currently trading businesses that reported how their importing had been affected, 22% reported lack of hauliers to transport goods or lack of logistics equipment as a challenge, in early September 2021, compared with 11% in April 2021 (Business Insights and Conditions Survey (BICS)). Section 6.
The system average price (SAP) of gas has more than doubled since the start of the year and is at 213% of the 1 January 2021 level on 3 October 2021 (National Grid). Section 7.
There was an average of 273 daily ship visits in the week to 3 October 2021, a 4% decrease from 284 in the previous week; the average number of daily cargo ship visits was broadly unchanged (exactEarth). Section 8.
In the week to 2 October 2021, overall retail footfall in the UK decreased by 3% from the previous week and was at 81% of the level seen in the equivalent week of 2019 (Springboard). Section 9.
The seven-day average estimate of UK seated diners decreased by 5 percentage points in the week to 4 October 2021 to 117% of the level in the equivalent week of 2019; this is the lowest level since the week ending 19 July 2021 (OpenTable). Section 10.
The seven-day average number of UK daily flights was 3,562 in the week ending 3 October 2021, which is 55% of the level seen in the equivalent week of 2019 (EUROCONTROL). Section 11.
Of the 95% of adults who left their home in the past seven days, 86% of them reported wearing a face covering; this was a 2 percentage-point decrease from the previous survey (Opinions and Lifestyle Survey, 22 September to 3 October 2021). Section 12.
There were 7,484 company compulsory dissolution first gazettes (a notice issued by Companies House indicating their intention to remove a company from the register) issued in the UK in the week ending 28 September 2021, this is the lowest level since the week ending 22 June 2021 (5,333) (Companies House). Section 13.
Results presented in this bulletin are experimental and may be subject to revision.
2. Latest indicators at a glance
Embed code
3. Online job adverts
Job adverts by category
These figures are experimental estimates of online job adverts provided by Adzuna, an online job search engine, by category, by UK country and English region. The number of job adverts over time is an indicator of the demand for labour. The Adzuna categories used do not correspond to Standard Industrial Classification (SIC) categories, so these values are not directly comparable with the Office for National Statistics (ONS) Vacancy Survey.
Figure 1: The total volume of online job adverts on 1 October 2021 grew by 3% from the previous week, to 139% of its February 2020 average level
Volume of online job adverts by category, index: 100 = February 2020 average, 4 January 2019 to 1 October 2021, non-seasonally adjusted
Embed code
Notes:
Further category breakdowns are included in the online job advert estimates dataset and more details on the methodology can be found in Using Adzuna data to derive an indicator of weekly vacancies.
Users should note that week-on-week changes in online job advert volumes are outlined as percentages, rather than as percentage point changes. Percentage change figures quoted in the commentary will therefore not necessarily match the percentage point changes observed in the charts and accompanying dataset.
Of the 28 categories 26 saw a weekly increase in the number of online job adverts, “energy, oil and gas” was unchanged and “charity, voluntary” fell when compared with the previous week. The largest weekly increases were in “legal” and “travel and tourism” which rose by 14% and 12%, respectively.
Figure 2: “Transport, logistics and warehouse” remains the category with the highest level of job adverts relative to its February 2020 average level, at 378%
Volume of online job adverts by category, index: 100 = February 2020 average, 3 January 2020 to 1 October 2021, non-seasonally adjusted
Source: Adzuna
Download this chart Figure 2: “Transport, logistics and warehouse” remains the category with the highest level of job adverts relative to its February 2020 average level, at 378%
Image .csv .xlsFollowing the announcement of the first UK-wide lockdown in March 2020, "transport, logistics and warehouse" fell to a low of 37% of its February 2020 average level on 1 May 2020. This was then followed by a steep increase in the volume of online job adverts in this category throughout the second half of the year, reaching a yearly high of 211% of its February 2020 average level on 30 October 2020.
Since the start of 2021, the volume of online job adverts in "transport, logistics and warehouse" has risen by 258 percentage points from its February 2020 average level. In the last four weeks alone, it has risen by 52 percentage points. It is now 167 percentage points higher than its 2020 peak on 30 October 2020.
Although the total volume of online job adverts has gradually increased throughout 2021, increasing on average by 2 percentage points week-on-week, "transport, logistics and warehouse" has increased by an average of 7 percentage points over the same period.
Job adverts by region
Figure 3: London remains the region with the lowest volume of online job adverts relative to its February 2020 average level, despite five consecutive week-on-week increases
Volume of online job adverts by UK countries and English regions, index: 100 = February 2020 average, 4 January 2019 to 1 October 2021, non-seasonally adjusted
Embed code
On 1 October 2021, the volume of online job adverts had increased in 11 UK countries and English regions when compared with the previous week (24 September 2021). The largest weekly growth was in Northern Ireland, North West England and the West Midlands, increasing by 10%, 4% and 4%, respectively. The total volume of online job adverts remained unchanged in Scotland when compared to the previous week.
In the latest week, volumes of online job adverts remained above their February 2020 average levels in all UK countries and English regions. The highest of these were in Northern Ireland and the North East, at 199% and 189% of their February 2020 average levels, respectively. In comparison, this figure was lowest in London and the South East at 124% and 127% in the latest week, respectively.
Back to table of contents4. UK Spending on debit and credit cards
Daily CHAPS-based indicator
These data series are experimental faster indicators for estimating UK spending on credit and debit cards. They track the daily CHAPS payments made by credit and debit card payment processors to around 100 major UK retail corporates. These payments are the proceeds of recent credit and debit card transactions made by customers at their stores, both through physical and online platforms. More information on the indicator is provided in the accompanying methodology article.
Companies are allocated to one of four categories based on their primary business.
"staples" refers to companies that sell essential goods that households need to purchase, such as food and utilities
"work-related" refers to companies providing public transport or selling petrol
"delayable" refers to companies selling goods whose purchase could be delayed, such as clothing or furnishings
"social" refers to spending on travel and eating out
Figure 4: The aggregate CHAPS-based indicator of credit and debit card purchases increased by 5 percentage points in the latest week, driven by “work-related” spending, which includes road fuel
Index February 2020 = 100, a backward looking seven-day rolling average, 13 January 2020 to 30 September 2021, non-seasonally adjusted, nominal prices
Source: Office for National Statistics and Bank of England calculations
Notes:
- Users should note the daily payment data is the sum of card transactions processed up to the previous working day, so there is a slight time lag when compared with real-life events on the chart.
- The vertical lines indicate key events. In order, the events are: first national lockdown begins; some non-essential shops allowed to reopen; regional restrictions begin in England; Christmas period; lockdowns announced in England and Scotland; reopening of non-essential shops, and outdoor pubs and restaurants in England; further easing of lockdown restrictions, including re-opening of indoor pubs and restaurants in England; most legal restrictions to control COVID-19 lifted in England.
- Percentage point difference is derived from current week and previous week index before rounding.
- Data for one sub-sector with 15% weight in the “social” spending category has been imputed for the period of 12 August to 30 September 2021 due to data availability issues.
Download this chart Figure 4: The aggregate CHAPS-based indicator of credit and debit card purchases increased by 5 percentage points in the latest week, driven by “work-related” spending, which includes road fuel
Image .csv .xlsFigure 4 shows changes in the value of CHAPS payments received by large UK corporates from their credit and debit card processors, "merchant acquirers".
In the week to 30 September 2021, the CHAPS-based indicator of credit and debit card purchases in aggregate increased by 5 percentage points from the previous week to 100% of its February 2020 average level. "Delayable" spending remained broadly unchanged, while all other spending categories increased in this latest week:
"staple" increased by 7 percentage points
"social" increased by 1 percentage point
“work-related” increased by 40 percentage points; this sector includes road fuel spending.
In the latest week, "work-related" and "staple" spending were above their February 2020 average level at 158% and 107%, respectively. Conversely, "delayable" and "social" spending were at 88% and 93% of their respective February 2020 average levels.
Monthly CHAPS-based indicator
In September 2021, the monthly CHAPS-based indicator of aggregate credit and debit card spending was at 96% of its February 2020 average level, which was broadly unchanged from August 2021.
This is the sixth consecutive month that the monthly index has been greater than 90%, with September, October and December 2020 the only other times since March 2020 where this was the case.
The monthly data time series is available in the accompanying dataset and includes methodological notes that users should bear in mind. The monthly CHAPS index is calculated by the Office for National Statistics (ONS), rather than being an additional series that is produced and validated by the Bank of England.
Back to table of contents5. Road traffic in Great Britain
According to Department for Transport (DfT) non-seasonally adjusted road traffic data, the volume of all motor vehicle traffic on Monday 4 October 2021 remained broadly unchanged from the previous week at 96% of the level seen on the Monday of the first week in February 2020. This follows a 6 percentage-point week-on-week fall last Monday (27 September 2021).
Compared with the previous week (Monday 27 September 2021), traffic volume for cars was unchanged at 91% of the level seen in the first week of February 2020. Light commercial vehicles and heavy good vehicles increased slightly by 2 percentage points from a week ago to 109% for both.
Figure 5: The volume of motor vehicle traffic on Monday 4 October 2021 was at 96% of its level in the first week of February 2020
Daily road traffic index: 100 = same traffic as the equivalent day of the week in the first week of February 2020, 1 March 2020 to 4 October, non-seasonally adjusted
Embed code
The daily DfT estimates are indexed to the first week of February 2020 and the comparison is with the same day of the week. The data provided are useful as an indication of traffic change rather than actual traffic volumes. More information on the methods, quality and economic analysis for these indicators can be found in the DfT methodology article.
Back to table of contents6. Business impacts and insights
You can find final data for Wave 40 (reference period 6 September to 19 September 2021) of the Business Insights and Conditions Survey (BICS) in Business insights and impacts on the UK economy: 7 October 2021.
In early September 2021, of the currently trading businesses that reported how their importing had been affected, 22% said a lack of hauliers to transport goods or a lack of logistics equipment importing was a challenge, up from 11% in late April 2021. The wholesale and retail trade; repair of motor vehicles and motorcycles industry reported the largest percentage of lack of hauliers to transport goods or lack of logistics equipment as a challenge at 26%.
You can find further information in the Business insights and impact on the UK economy dataset.
Back to table of contents7. System average price (SAP) of gas
This week we are introducing the system average price (SAP) of gas. These data are available in the Data Item Explorer from the National Grid.
This is the average price of all gas traded through the balancing market. Market participants post bids or offers for volumes of gas as day-ahead and within-day trades. The SAP aggregates the trades conducted on the On-the-Day Commodity Market (OCM). This is the market that National Grid use in their role as residual balancer. Other markets exist for wholesale gas trading in GB.
These data can be used to understand the general trend of gas prices within the UK, however, should be treated with caution as these can be subject to extreme within-day trading prices and may skew actual traded prices. It must also be noted that while these prices reflect spot prices on the day, traders can opt for futures contracts where the buyer and the seller agree the market-determined price for gas for a future date. The daily SAP is used to determine the futures price and is therefore a useful indicator of supply constraints and demand pressures.
These data and the accompanying dataset will be updated weekly in this bulletin.
Figure 6: The preceding seven-day rolling average gas price increased by 2% in the week to 3 October 2021
System average price, pence per kilowatt hour, 1 January 2019 to 3 October 2021, UK, non-seasonally adjusted
Source: National Grid
Notes:
- The price trends observed above will differ from that of the monthly Producer Price Inflation (PPI) series published by the ONS because of the differences in data sources and methods.
Download this chart Figure 6: The preceding seven-day rolling average gas price increased by 2% in the week to 3 October 2021
Image .csv .xlsSince the start of 2021, the SAP has been steadily increasing. The price has more than doubled since the start of the year, with an increase of 213% since 1 January 2021, and an increase of 71% since 1 August 2021. In the latest week, from 26 September to 3 October, the SAP preceding seven-day average increased by 2% to 5.785 pence per kilowatt hour.
The full time series of actual day SAP and the preceding seven-day average, encompassing data from 2018 to the present, can be found in the accompanying dataset
Back to table of contents8. Shipping
A changeover in the systems used to collect these data has introduced a level shift in the data time series from 14 June 2021 onwards. Users should not make comparisons between data before and after this date. The data produced prior to the change, for 1 April 2019 to 13 June 2021, can still be compared within that period.
A full methodological review of our current method of data collection is under way and data may be subject to revision once this is complete. We will continue to update the accompanying dataset using the current method until the review is complete.
Figure 7: There was an average of 273 daily ship visits in the week to 3 October 2021, a 4% decrease from 284 in the previous week
Daily movements in shipping visits, UK, seasonally adjusted, 1 April 2019 to 3 October 2021
Source: exactEarth
Download this chart Figure 7: There was an average of 273 daily ship visits in the week to 3 October 2021, a 4% decrease from 284 in the previous week
Image .csv .xls
Figure 8: There was an average of 91 daily cargo ship visits in the week to 3 October 2021, broadly unchanged the previous week
Daily movements in cargo shipping visits, UK, seasonally adjusted, 1 April 2019 to 3 October 2021
Source: exactEarth
Notes:
- The vertical line indicates the date when the data collection system changed. Users should not compare data before and after this date.
- See the accompanying dataset for notable dates and weather events.
- In the coming weeks, we will continue to review the seasonally adjusted estimates of shipping indicators data following its reintroduction with the discontinuity.
Download this chart Figure 8: There was an average of 91 daily cargo ship visits in the week to 3 October 2021, broadly unchanged the previous week
Image .csv .xls9. Retail footfall
National footfall figures are supplied by Springboard, a provider of data on customer activity. They measure the following for overall UK retail footfall, as well as by high street, retail park, and shopping centre categories:
- daily retail footfall as a percentage of its level on the same day of the equivalent week of 2019; for example, Saturday 2 October 2021 is compared with Saturday 28 September 2019
- total weekly retail footfall as a percentage of its level in the equivalent week of 2019
- the percentage change in weekly footfall compared with the previous week; for example, Week 39 of 2021 is compared with Week 38 of 2021
- Springboard's weekly data are defined over a seven-day period running from Sunday to Saturday; Week 39 of 2021 therefore refers to the period Sunday 26 September to Saturday 2 October 2021
Users should note that all quoted figures have been rounded to the nearest integer.
Figure 9: Overall retail footfall in the UK decreased by 3% in the week to 2 October 2021, and was 81% of the level seen in the equivalent week of 2019
Volume of overall daily retail footfall, percentage compared with the equivalent day of the equivalent week of 2019, 1 March 2020 to 2 October 2021

Source: Springboard and the Department for Business, Energy and Industrial Strategy
Download this image Figure 9: Overall retail footfall in the UK decreased by 3% in the week to 2 October 2021, and was 81% of the level seen in the equivalent week of 2019
.png (109.7 kB)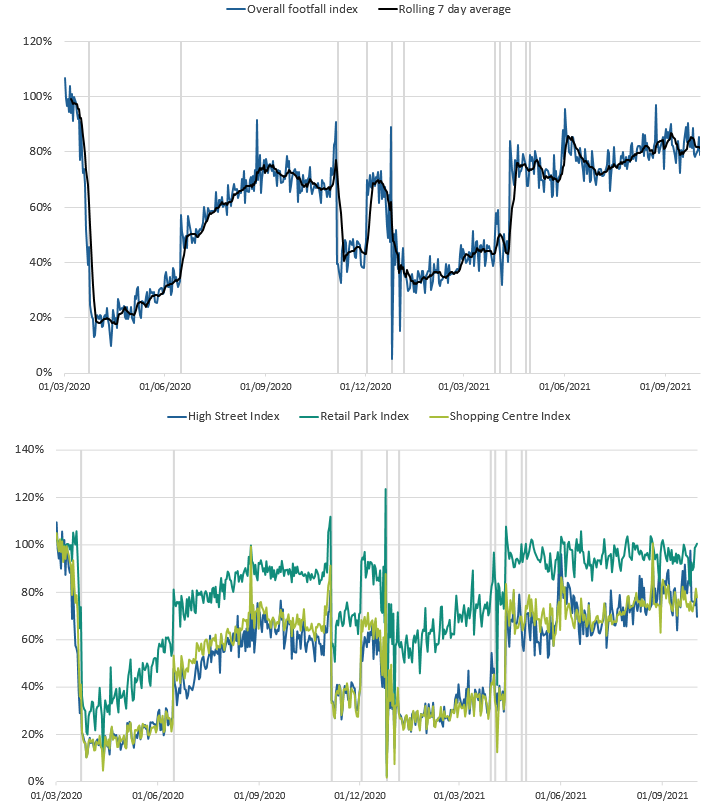
Notes:
- The vertical lines indicate notable events. In order, the events are: first national lockdowns begin; restrictions begin to ease across the UK; circuit-breaker lockdown in England; circuit breaker replaced with regional restrictions; Christmas; lockdown begins in England; "stay at home" rule ends in England; Easter; reopening of non-essential retail in England and Wales; reopening of non-essential retail in Scotland; reopening of non-essential retail in Northern Ireland; most legal restrictions to control coronavirus (COVID-19) lifted in England.
- Users should note that week-on-week changes in retail footfall volumes are outlined as percentages, rather than as percentage point changes. Percentage change figures quoted in the commentary will therefore not necessarily match the percentage point changes observed in the chart.
According to Springboard, in the week to 2 October 2021, the volume of overall retail footfall in the UK decreased by 3% from the previous week (week to 25 September 2021). This decrease in overall footfall in the UK was because of an 8% week-on-week fall in high street footfall, partially as a result of adverse weather in parts of the UK in the latest week. Meanwhile, retail park and shopping centre footfall increased slightly from the previous week by 1% and 2%, respectively.
In the latest week to 2 October 2021, overall retail footfall was at 81% of the level seen in the equivalent week of 2019. Comparing retail locations, footfall at retail parks remained the strongest relative to pre-coronavirus (COVID-19) pandemic levels, at 94% of its equivalent 2019 level. Meanwhile, the corresponding figures for high streets and shopping centres were 78% and 76%, respectively. Throughout most of the pandemic, footfall at retail parks has consistently been strongest when compared with other retail locations, relative to their 2019 levels.
Regional retail footfall
Figure 10: The South West of England had the highest retail footfall relative to pre-pandemic levels in the week to 2 October 2021, at 86% of the level in the same week of 2019
Volume of daily retail footfall, percentage of the level recorded on the same day of the equivalent week of 2019, seven-day rolling average, UK countries and English regions, 1 March 2020 to 2 October 2021
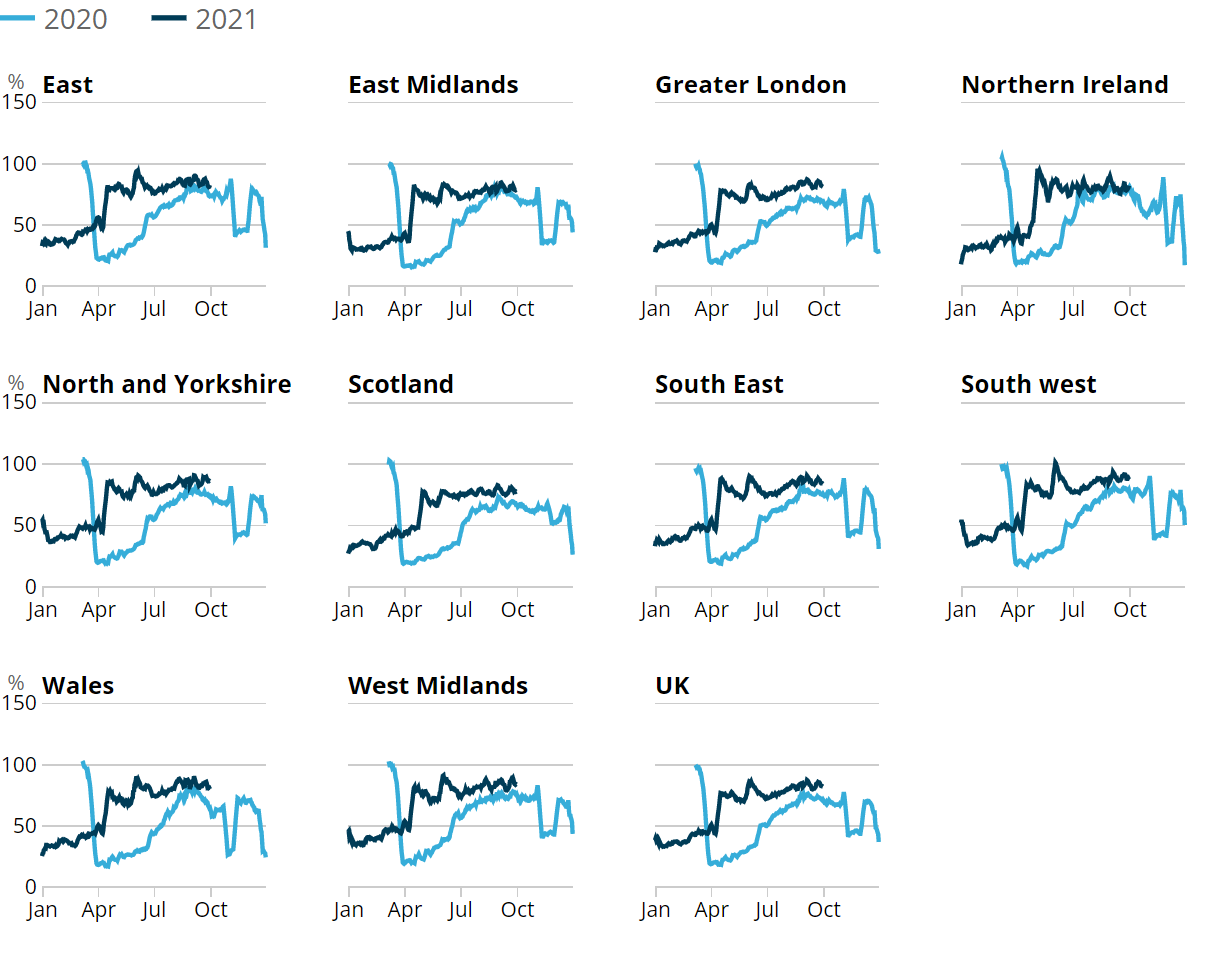
Source: Springboard and the Department for Business, Energy and Industrial Strategy
Download this image Figure 10: The South West of England had the highest retail footfall relative to pre-pandemic levels in the week to 2 October 2021, at 86% of the level in the same week of 2019
.png (91.1 kB)
In the week to 2 October 2021, retail footfall saw a week-on-week fall in 9 out of the 10 UK countries and English regions, the largest occurring in the South West, Wales and the West Midlands, where footfall fell by 5%. Northern Ireland was the only area that did not see a weekly decrease, remaining unchanged from the previous week.
In the same week, relative to the levels seen in the equivalent week of 2019, retail footfall was strongest in the South West at 86%, followed closely by the North and Yorkshire at 85%. In contrast, retail footfall was weakest in the East Midlands, Scotland and Wales, at 77%, 78% and 79%, respectively.
Back to table of contents10. OpenTable seated diners
OpenTable is a provider of data for online restaurant reservations, with daily data for the UK, London and Manchester being publicly available in its The state of the industry dashboard. These data show the impact of recent events and restrictions on the hospitality industry using a sample of restaurants on the OpenTable network across all channels, that is, online reservations, phone reservations, and walk-ins.
Figure 11: The seven-day average estimate of UK seated diners decreased by 5 percentage points in the week to 4 October 2021 to 117% of the level in the equivalent week of 2019
Seated diners, seven-day average, percentage compared with the equivalent week of 2019, week ending 24 February 2020 to week ending 4 October 2021, UK, London and Manchester
Source: OpenTable
Notes:
- Data show the percentage of seated diners when compared with the same week in 2019. For example, Week 39 2021 is compared with Week 39 2019.
- Please note that data for Manchester are only available from week ending 16 November 2020.
Download this chart Figure 11: The seven-day average estimate of UK seated diners decreased by 5 percentage points in the week to 4 October 2021 to 117% of the level in the equivalent week of 2019
Image .csv .xlsAccording to OpenTable, in the week to 4 October 2021, the seven-day average estimate of UK seated diners decreased by 5 percentage points from the previous week at 117% of its level in the equivalent week of 2019. This is the lowest level seen since the week ending 19 July 2021.
In the latest week, the seven-day average estimate of seated diners in London decreased by 6 percentage points to 80% of the level seen in the equivalent week of 2019. Meanwhile, in Manchester the corresponding figure saw a week-on-week increase of 3 percentage points to 135% of the equivalent week of 2019.
Back to table of contents11. UK Flight data
These data are daily flight figures from the European Organisation for the Safety of Air Navigation (EUROCONTROL). Daily flight numbers for the UK alongside other countries are available in EUROCONTROL's dashboard. EUROCONTROL is a pan-European, civil-military organisation dedicated to supporting European aviation. Its Aviation Intelligence and Performance Review Unit provides independent collection and validation of air navigation services performance-related data and intelligence gathering.
The flights data include international arrivals and departures to and from the UK (including crown dependencies) and domestic UK flights, but exclude overflights (flights that pass over UK territory). They capture all flight movements that operate under Instrument Flight Rules (IFR), where the pilot uses instruments in the flight deck to control, guide and adjust the plane. This includes commercial flights carrying passengers and cargo as well as non-commercial flights such as private and military flights.
Data from EUROCONTROL do not include information on the volume of passengers or cargo carried on UK flights. Especially in the context of the coronavirus (COVID-19) pandemic, flights might not be operating at full capacity and therefore trends in passengers and cargo will differ from trends in flights presented here.
Figure 12: The seven-day average number of UK daily flights was 3,562 in the week ending 3 October 2021, which is 55% of the level seen in the equivalent week of 2019
Number of daily flights, non-seasonally adjusted, and seven-day moving average, 2 January 2019 to 3 October 2021, UK
Source: European Organisation for the Safety of Air Navigation (EUROCONTROL)
Notes:
- The fall in February 2020 coincides with Storm Ciara.
- The falls in December and January coincide with Christmas Eve, Christmas Day, New Year’s Eve and New Year’s Day.
Download this chart Figure 12: The seven-day average number of UK daily flights was 3,562 in the week ending 3 October 2021, which is 55% of the level seen in the equivalent week of 2019
Image .csv .xlsIn the week ending 3 October 2021, the seven-day average number of UK daily flights was 3,562, broadly similar to the previous week (3,608). The average number of UK daily flights in the latest week was at 55% and 137% of the level seen in the equivalent week of 2019 and 2020, respectively.
The seven-day average number of UK daily flights has increased by 149% from the week-ending 23 May 2021, the week that international travel was allowed to resume and the UK government implemented the travel traffic light system (17 May 2021).
You can find the full data time series available for UK flights in the accompanying dataset, which contains daily flight numbers and the rolling seven-day averages.
Back to table of contents13. Companies house data
Company compulsory dissolution first gazettes
Compulsory dissolution first gazette statistics are a complementary indicator of potential company closure to voluntary dissolution applications and help provide a fuller picture of business demography in the UK.
Companies House paused the issuing of compulsory dissolution first gazettes between 16 March and 10 October 2020, and between 21 January and 8 March 2021. The deadline for companies to supply them with statutory documents for all filing deadlines falling between 27 June 2020 and 5 April 2021 was also extended. To ensure comparability, weekly compulsory dissolution first gazette figures are presented as annual cumulative counts in the real-time indicators bulletin. Users should bear this in mind when comparing cumulative company dissolution figures between years.
More information on compulsory dissolution first gazettes, voluntary dissolution applications and incorporations can be found in the Companies House methodology document.
Figure 13: There were 7,484 compulsory dissolution first gazettes issued in the UK in the week to 28 September 2021, bringing the cumulative total since the start of the year to 372,259
Cumulative company compulsory dissolution first gazettes, UK, week ending 2 January 2018 to week ending 28 September 2021
Embed code
Notes:
- Companies House publish weekly compulsory dissolution first gazette figures on Tuesdays, covering the period Wednesday to Tuesday. Week 39 of 2021 therefore covers the week ending 28 September 2021.
- More methodological information on company incorporations, voluntary dissolution applications, and compulsory dissolution first gazettes can be found in the Companies House methodology document.
- Companies House paused the issuing of compulsory dissolution first gazettes between 16 March and 10 October 2020, and between 21 January and 8 March 2021.
The 372,259 cumulative annual figure is 32% and 26% higher than the pre-pandemic years of 2018 and 2019, respectively. The recent increases have likely been caused by the ending of legislative easements, whereby companies were granted extensions to filing deadlines.
Company incorporations and voluntary dissolutions applications
Companies House also publish weekly data on voluntary dissolution applications (another type of company closure) and company incorporations. In the week to 1 October 2021, there were 6,202 voluntary dissolution applications, an increase of 6% from the previous week and a 27% increase from the equivalent week of 2019 (4,900). There were 15,024 company incorporations in the week to 1 October 2021, an increase of 7% from the previous week and a 9% increase from the equivalent week of 2019 (13,791).
See the accompanying dataset.
Back to table of contents14. Data
UK spending on credit and debit cards
Dataset | Released 7 October 2021
Experimental indicator for monitoring UK retail purchases derived from the Bank of England's CHAPS data.
Shipping indicators
Dataset | Released 7 October 2021
Experimental weekly and daily ship visits dataset covering UK ports.
Traffic camera activity
Dataset | Released 7 October 2021
Experimental daily traffic camera counts data for busyness indices covering the UK.
Online job advert estimates
Dataset | Released 7 October 2021
Experimental job advert indices covering the UK online job market.
Company Incorporations, Voluntary Dissolutions and Compulsory Dissolutions
Dataset | Released 7 October 2021
The number of weekly Companies House incorporations, compulsory dissolutions and voluntary dissolution applications accepted.
Daily UK flights
Dataset | Released 7 October 2021
Experimental daily UK flight numbers and rolling seven-day average, including flights to, from, and within the UK
System Average Price (SAP) of gas
Dataset | Released 7 October 2021
Daily and rolling average System Average Price (SAP) of gas traded in the UK over the On-the-Day Commodity Market (OCM)
15. Glossary
Faster indicator
A faster indicator provides insights into economic activity using close-to-real-time big data, administrative data sources, rapid response surveys or Experimental Statistics, which represent useful economic and social concepts.
Company incorporations
Incorporations are when a company is added to the Companies House register of limited companies. This can also include where an existing business applies to become a limited company, where it was not one before.
Voluntary dissolution applications
A voluntary dissolution application is when a company applies to begin dissolution proceedings. As such, they effectively choose to be removed from the Companies House register. For a company to be eligible to voluntarily dissolve, it should not have completed any trading activity for a period of three months.
Compulsory dissolutions
When a company fails to file the required financial accounts and/or confirmation statements, if no contact is received by Companies House following a series of letters to the company and its officers, a first gazette notice is published in the Gazette, a notice of the Registrar's intention to dissolve the company.
Back to table of contents16. Measuring the data
UK coronavirus restrictions
A full overview of coronavirus (COVID-19) restrictions for each of the four UK constituent countries can be found here:
These restrictions should be considered when interpreting the data featured throughout this bulletin.
Back to table of contents17. Strengths and limitations
Information on the strengths and limitations of the indicators in this bulletin is available in the Coronavirus and the latest indicators of the UK economy and society methodology.
Back to table of contents
12. Social Impact of coronavirus
This section includes some provisional results from the Opinions and Lifestyle Survey (OPN) covering the period 22 September to 3 October 2021. The survey went out to 5,000 adults in Great Britain and had a response rate of 67% (3,326 responses). Further information to help understand the impact of the coronavirus (COVID-19) pandemic on people, households and communities in Great Britain will be available in Coronavirus and the social impacts on Great Britain, due to be published on 8 October 2021.
Travelling to work
In the period 22 September to 3 October 2021, the proportion of working adults in Great Britain who in the past seven days:
Shopping
Of the 95% of adults in Great Britain who reported leaving home in the past seven days, the proportion that did so to shop for food and medicine was broadly similar to the previous period at 82%.
The proportion of these adults who shopped for things other than food and medicine in the past seven days decreased by 3 percentage points from the previous period to 44%.
Face coverings
Of the 95% of adults in Great Britain who reported leaving home in the past seven days, the proportion that did so and reported wearing a face covering decreased by 2 percentage points from the previous period to 86%. Further breakdowns such as the situation when a face covering was worn (for example, while shopping) and by country, will be available in Coronavirus and the social impacts on Great Britain due to be published on 8 October 2021.
Back to table of contents