Table of contents
- Main points
- Latest indicators at a glance
- Restaurant seated diners
- Business impacts and insights
- Online job adverts
- Vehicle flows around ports
- UK spending on debit and credit cards
- Retail footfall
- Ship visits
- Road traffic in Great Britain
- Data
- Glossary
- Measuring the data
- Strengths and limitations
- Related Links
1. Main points
We are currently undertaking research to improve this bulletin for our users. Please complete this 5-minute survey to tell us your views.
In the week to Monday 24 May 2021, the seven-day average estimate of UK seated diners was at 132% of the level in the same week of 2019; this is an increase of 59 percentage points from the previous week and follows the reopening of indoor dining across much of the UK on 17 May 2021. See Section 3.
Around a third of UK businesses experienced a decrease in turnover in early May compared with what is normally expected at this time of year, the lowest proportion reported since the series began in June 2020 (Initial results from Wave 31 of the Business Insights and Conditions Survey (BICS)). See Section 4.
The volume of UK online job adverts on 21 May 2021 was at 118% of its February 2020 average level; this is up 4 percentage points from the previous week and higher than the volume of online job adverts on the equivalent day in 2019 (Adzuna). See Section 5.
After a fall in January 2021, average counts of vehicles in most vehicle categories on the Strategic Roads Network around English ports returned to their December 2020 levels by March 2021 (Highways England). See Section 6.
In the week to 20 May 2021, the aggregate CHAPS-based indicator of credit and debit card purchases was at 96% of its February 2020 average level; this is an increase of 31 percentage points from the level seen in early January 2020 (Bank of England Clearing House Automated Payment System (CHAPS) data). See Section 7.
In the week to 22 May 2021, UK retail footfall was at 71% of its level in the equivalent week of 2019, with footfall at retail parks still faring much more strongly than at high streets and shopping centres relative to their pre-pandemic levels (Springboard). See Section 8.
There was an average of 365 daily ship visits in the week ending 23 May 2021, an increase of 4% from the previous week (350) but 6% lower than the equivalent week in 2019 (390) (exactEarth). See Section 10.
The volume of motor vehicle traffic on Monday 17 May 2021 was at 97% of the level seen in the first week of February 2020, broadly unchanged from the previous week (Department for Transport (DfT)). See Section 11.
There were 15,638 company incorporations in the week to 21 May 2021, a 10% decrease from the previous week (17,316), but 6% higher than the equivalent week in 2019 (14,807) (Companies House). See the accompanying dataset.
There were 6,634 voluntary dissolution applications in the week to 21 May 2021, a 15% increase from the previous week (5,790) and 39% higher than the equivalent week of 2019 (4,787) (Companies House). See the accompanying dataset.
The overall price of items in the online food and drink basket increased by 0.1% in the week ending 23 May 2021; the main upward contributions came from "meat" and "bread and cereals", but this was offset in part by a price decrease for "sugar, jam, syrup, chocolate and confectionery" (online price collection). See the accompanying dataset.
Results presented throughout this bulletin are experimental and may be subject to revision.
2. Latest indicators at a glance
Embed code
This week, the following indicators are featured in this section of the bulletin only:
Companies House company incorporations and voluntary dissolution applications. See also the accompanying dataset.
Online price changes. See also the accompanying dataset.
Energy Performance Certificate (EPC) lodgements.
Traffic camera activity data are available in the accompanying dataset only.
Back to table of contents3. Restaurant seated diners
OpenTable is a leading provider of online restaurant reservations, with daily data being publicly available in its The state of the industry dashboard. These data show the impact of recent events and restrictions on the hospitality industry using a sample of restaurants on the OpenTable network across all channels, that is, online reservations, phone reservations, and walk-ins.
Figure 1: In the week to Monday 24 May 2021, the seven-day average estimate of UK seated diners was at 132% of its level in the same week of 2019, an increase of 59 percentage points from the previous week
Seated diners, seven-day average, percentage compared with the equivalent week of 2019, week ending 24 February 2020 to week ending 24 May 2021, UK, London and Manchester
Source: OpenTable
Notes:
- Data show the percentage of seated diners when compared with the same week in 2019. For example, Week 20 2021 is compared with Week 20 2019.
- Please note that data for Manchester are only available from week ending 16 November 2020.
Download this chart Figure 1: In the week to Monday 24 May 2021, the seven-day average estimate of UK seated diners was at 132% of its level in the same week of 2019, an increase of 59 percentage points from the previous week
Image .csv .xlsIn the week to Monday 24 May 2021, the seven-day average estimate of UK seated diners was at 132% of the level seen in the equivalent week of 2019. This is a 59 percentage point increase when compared with the previous week and is the highest level seen since the week to 31 August 2020 (165%), around the time of the Eat Out to Help Out Scheme. This latest week's substantial increase follows the reopening of indoor dining in England, Wales, and Scotland on 17 May 2021 and continues the rise in seated diner estimates observed since the first reopening of pubs and restaurants in England on 12 April 2021.
In the week ending 24 May 2021, the seven-day average estimate of seated diners in London saw a sizable increase of 41 percentage points to 84% of its level in the equivalent week of 2019. Meanwhile, the equivalent figure in Manchester was at 190%, having increased 66 percentage points from the previous week.
Back to table of contents4. Business impacts and insights
Initial results from Wave 31 of the Business Insights and Conditions Survey (BICS) cover the reference period 3 to 16 May 2021, with a response rate of 21.3% (8,265 responses). The survey was live for the period 17 to 25 May 2021.
Figure 2: The proportion of the workforce of all UK businesses (excluding those permanently ceased trading) on furlough has decreased to 8%, the lowest level seen so far in 2021
Headline indicators from the Business Insights and Conditions Survey (BICS), 3 to 25 May 2021
Embed code
Notes:
Initial weighted results, Wave 31 of Office for National Statistics' (ONS') Business Insights and Conditions Survey (BICS).
A detailed description of the weighting methodology and the weights used for each variable is available in Business Insights and Conditions Survey (BICS).
Download this chart
Across all UK industries in Wave 31:
83% of businesses had been trading for more than the last two weeks
4% of businesses had started trading within the last two weeks after a pause in trading
3% of businesses had paused trading but intend to restart in the next two weeks (broadly unchanged from 5% in Wave 30)
6% of businesses had paused trading and do not intend to restart in the next two weeks (broadly unchanged from 8% in Wave 30)
4% of businesses had permanently ceased trading
| All Industries | |
|---|---|
| Turnover has increased by more than 50% | <1% |
| Turnover has increased between 20% and 50% | 4% |
| Turnover has increased by up to 20% | 9% |
| Turnover has not been affected | 44% |
| Turnover has decreased by up to 20% | 15% |
| Turnover has decreased between 20% and 50% | 11% |
| Turnover has decreased by more than 50% | 8% |
| Not sure | 10% |
Download this table Table 1: A third of businesses experienced a decrease in turnover in early May compared with what is normally expected at this time of year, the lowest proportion reported since the series began in June 2020
.xls .csvThe initial result of 8% of businesses' workforce on furlough leave in May 2021 equates to approximately 2.2 million people. This number is based on multiplying the BICS weighted furlough proportions by HM Revenue and Customs (HMRC) Coronavirus Job Retention Scheme (CJRS) official statistics eligible employments1 for only those industries covered by the BICS sample.
Notes for: Business impacts and insights
- An "employment" in the HMRC CJRS Official Statistics is defined as anyone who meets the scheme criteria set out within the published guidance, and data come from the whole population of HMRC CJRS claims (those applied) and Pay As You Earn (PAYE) Real Time Information systems (RTIs). The assessment of whether a person was employed on the qualifying dates is based on the methodology used for the joint HMRC and Office for National Statistics (ONS) statistics release, Earnings and employment from Pay As You Earn Real Time Information.
5. Online job adverts
These figures are experimental estimates of online job adverts provided by Adzuna, an online job search engine, by category and by UK country and English region. The number of job adverts over time is an indicator of the demand for labour. The Adzuna categories used do not correspond to Standard Industrial Classification (SIC) categories, so these values are not directly comparable with our Vacancy Survey.
Figure 3: On 21 May 2021, the volume of total online job adverts was at 118% of its February 2020 average, an increase of 4 percentage points from the previous week
Volume of online job adverts by category, index February 2020 = 100, 4 January 2019 to 21 May 2021, non-seasonally adjusted
Embed code
Notes:
- Further category breakdowns are included in the Online job advert estimates dataset and more details on the methodology can be found in Using Adzuna data to derive an indicator of weekly vacancies.
Download this chart
The volume of UK online job adverts on 21 May 2021 was at 118% of its February 2020 average level, an increase of 4 percentage points when compared with a week ago (14 May 2021).
Over this period, excluding the “unknown” category, the volume of online job adverts had increased in 26 of the 28 categories. The largest weekly increase was for "transport, logistics and warehouse", which rose by 21 percentage points to 275% of its February 2020 average level. This is the highest volume of online job adverts observed for this category since the beginning of the series in February 2018, and continues its strong upward trend, having risen by 139 percentage points since 5 March 2021.
The volume of online job adverts for “manufacturing” also saw a substantial increase of 14 percentage points from last week to 231% of its February 2020 average level on 21 May 2021. The volume of online job adverts for this category has risen steadily since the beginning of 2021, increasing by 122 percentage points since 8 January.
In “catering and hospitality”, the volume of online job adverts decreased by 2 percentage points from a week ago to 113% of its February 2020 average level on 21 May 2021. This follows a recent upward trend for this category, having risen by 55 percentage points since 9 April 2021, just before the first easing of hospitality restrictions when pubs and restaurants reopened in England.
Online job adverts by region
Figure 4: On 21 May 2021, the volume of online job adverts had increased in 10 out of the 12 UK countries and English regions when compared with a week ago
Volume of online job adverts by region, index February 2020 = 100, 4 January 2019 to 21 May 2021, non-seasonally adjusted
Embed code
Download this chart
On 21 May 2021, the volume of UK online job adverts had increased in 10 out of the 12 UK countries and English regions when compared with 14 May 2021. The East of England saw the largest weekly increase of 8 percentage points to 127% of its February 2020 average level on 21 May 2020. The North East, Yorkshire and The Humber, Wales, and Scotland also saw notable increases in online job adverts of 6 percentage points each. On 21 May 2021, the volume of online job adverts in these regions stood at 158%, 136%, 116% and 113% of their February 2020 average levels, respectively.
Northern Ireland saw the only weekly decrease in online job adverts, by 4 percentage points, to 145% of its February 2020 average level. Note that this decrease for Northern Ireland follows its substantial increase last week, which was a result of a rebound in online job adverts from a single source.
The volume of online job adverts remained unchanged in London when compared with a week ago, at 98% of its February 2020 average level. London also remains the only UK region where volumes of online job adverts are lower than their February 2020 average level.
Back to table of contents6. Vehicle flows around ports
These data are taken from locations on the Strategic Road Network (SRN). The SRN is made up of the motorways and major trunk roads in England managed by Highways England. It does not cover locally managed motorways or B roads. The data include detailed vehicle flows for important roads serving 13 selected major ports, within a 10-kilometre radius of each port location. The seasonally adjusted data time series for average 15-minute vehicle sensor counts and average speed data for sensors around English ports can be found in the experimental dataset.
It is important to note that these data are compiled using different methods and sensors than the Department for Transport's (DfT's) daily time series on road traffic in Great Britain. The DfT series are based on the automatic traffic counter sites used in the Quarterly Road Traffic National Statistics publication, which are stratified and weighted to be representative of national traffic.
More information on the methods, quality and economic analysis for these indicators can be found in Faster indicators of UK economic activity: road traffic data for England.
Figure 5: Average counts of vehicles around English ports have increased in February and March after a fall in January 2021
Average sensor count per 15-minute observation, roads on the SRN around ports in England, December 2018 to March 2021, seasonally adjusted
Source: Highways England webTRIS data
Download this chart Figure 5: Average counts of vehicles around English ports have increased in February and March after a fall in January 2021
Image .csv .xlsIn 2020, the breakdown of average sensor counts around English ports by vehicle category were:
greater than 11.66 metres (for example, larger rigid lorries and coaches, articulated lorries): around 10% of the average counts
6.6 metres to 11.66 metres (for example, rigid lorries, buses): around 6%
5.2 metres to 6.6 metres (for example, panel vans, minibuses): around 12%
less than 5.2 metres (for example, cars, motorcycles): around 71%
After a fall in January 2021, average sensor counts for most categories of vehicles returned to their December 2020 levels in March 2021. Vehicles over 11.66 metres were the exception, with their average sensor counts remaining 7 percentage points below that seen in December 2020. In March 2021, average counts of vehicles less than 5.2 metres saw the largest month-on-month increase from the previous month, increasing by 6 percentage points.
Data for individual ports, average sensor counts and average speeds are available in the accompanying dataset.
Back to table of contents7. UK spending on debit and credit cards
These data series are experimental faster indicators for estimating UK spending on credit and debit cards. They track the daily Clearing House Automated Payment System (CHAPS) payments made by credit and debit card payment processors to around 100 major UK retail corporates. These payments are the proceeds of recent credit and debit card transactions made by customers at their stores, both via physical and via online platforms.
More information on the indicator is provided in the accompanying methodology article.
Companies are allocated to one of four categories based on their primary business:
"staples" refers to companies that sell essential goods that households need to purchase, such as food and utilities
"work-related" refers to companies providing public transport or selling petrol
"delayable" refers to companies selling goods whose purchase could be delayed, such as clothing or furnishings
"social" refers to spending on travel and eating out
Figure 6: In the week to 20 May 2021, the aggregate CHAPS-based indicator of credit and debit card purchases was at 96% of its February 2020 average, up 31 percentage points since early January 2021
Index February 2020 = 100, a backward looking seven-day rolling average, 13 January 2020 to 20 May 2021, non-seasonally adjusted, nominal prices
Source: Office for National Statistics and Bank of England calculations
Notes:
- Users should note the daily payment data are the sum of card transactions processed up to the previous working day, so there is slight time lag when compared with real-life events on the chart.
- The vertical lines indicate notable events. In order, the events are: first national lockdown begins; some non-essential shops allowed to reopen; regional restrictions begin in England; Christmas period; lockdowns announced in England and Scotland; reopening of non-essential shops, and outdoor pubs and restaurants in England.
Download this chart Figure 6: In the week to 20 May 2021, the aggregate CHAPS-based indicator of credit and debit card purchases was at 96% of its February 2020 average, up 31 percentage points since early January 2021
Image .csv .xlsFigure 6 shows changes in the value of CHAPS payments received by large UK corporates from their credit and debit card processors, "merchant acquirers".
In the week to 20 May 2021, the CHAPS-based indicator of credit and debit card purchases in aggregate remained broadly similar to the previous week at 96% of its February 2020 average. "Delayable" spending fell by 3 percentage points and "staples" by 4 percentage points, whereas "social" spending increased by 2 percentage points and "work-related" by 3 percentage points. In the latest week, "staples" spending was above its February 2020 average level at 108%. Conversely, "delayable", "social" and "work-related" spending were at 94%, 84% and 99% of their February 2020 average levels, respectively. This latest week's data cover the period in which restrictions on social gathering and indoor hospitality eased across England, Wales, and most of Scotland on 17 May 2021.
Since the substantial fall in spending at the beginning of the year, the aggregate CHAPS-based indicator of debit and credit card purchases has increased gradually. In the week to 20 May 2021, its level was up by 31 percentage points from that seen on 7 January 2021, just after Christmas, and the re-introduction of national lockdowns. Of the four consumption categories, "work-related" spending has seen the largest increase over this period of 45 percentage points, with "delayable" spending also seeing a substantial increase of 41 percentage points over this period.
The full data time series available for data on UK spending on debit and credit cards can be found in the accompanying dataset.
Back to table of contents8. Retail footfall
National retail footfall
National footfall figures are supplied by Springboard, a provider of data on customer activity. It measures the following for overall UK retail footfall, as well as by high street, retail park, and shopping centre categories:
daily retail footfall as a percentage of its level on the same day of the equivalent week of 2019; for example, Saturday 22 May 2021 is compared with Saturday 18 May 2019
total weekly retail footfall as a percentage of its level in the equivalent week of 2019
the percentage change in weekly footfall compared with the previous week; for example, Week 20 of 2021 is compared with Week 19 of 2021
Springboard's weekly data are defined over a seven-day period running from Sunday to Saturday; Week 20 of 2021 therefore refers to the period Sunday 16 May 2021 to Saturday 22 May 2021
Figure 7: In the week to 22 May 2021, UK retail footfall was at 71% of its level in the equivalent week of 2019
Volume of overall daily retail footfall, percentage compared with the equivalent day of the equivalent week of 2019, 1 March 2020 to 22 May 2021

Source: Springboard and the Department for Business, Energy and Industrial Strategy
Notes:
- The vertical lines indicate notable events. In order, the events are; first national lockdowns begin; restrictions begin to ease across the UK; circuit-breaker lockdown in England; circuit breaker replaced with regional restrictions; Christmas; lockdown begins in England; "stay at home" rule ends in England; Easter; reopening of non-essential retail in England and Wales; reopening of non-essential retail in Scotland; reopening of non-essential retail in Northern Ireland.
- Prior to 3 January 2021, overall and regional daily footfall indices were generated by comparing footfall against its level on the same day of the equivalent week the year before. From this date onwards they were generated by comparing footfall against its level on the same day of the equivalent week in 2019. For a two-day period, from 1 January 2021 to 2 January 2021 daily indices were therefore generated using a 2021 versus 2020 comparison.
- Overall and regional retail footfall data for 18 April 2021 were calculated through linear interpolation to avoid comparison with Easter Sunday in 2019.
Download this image Figure 7: In the week to 22 May 2021, UK retail footfall was at 71% of its level in the equivalent week of 2019
.png (103.0 kB)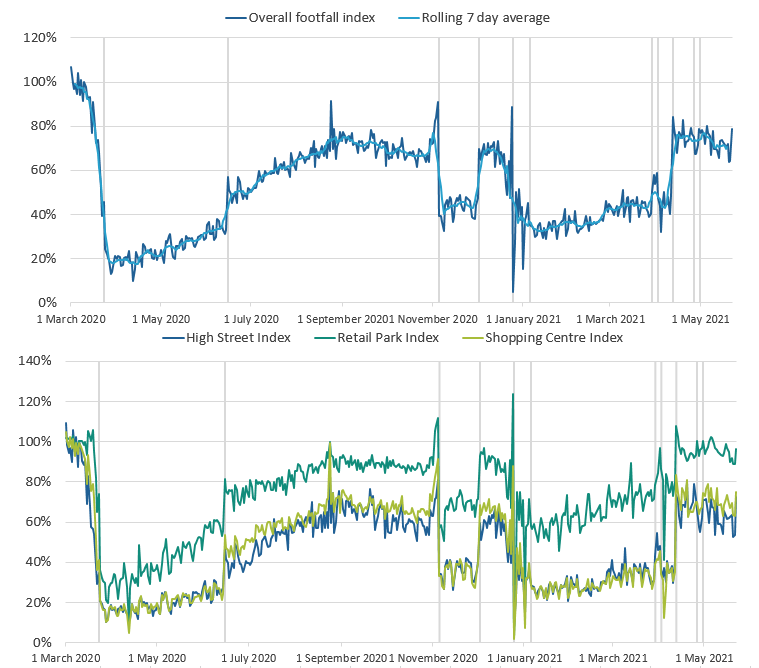
According to Springboard, overall retail footfall in the week to 22 May 2021 remained broadly unchanged from its level in the previous week at 71% of its level in the equivalent week of 2019.
The strongest weekly increase in retail footfall was at high streets where levels increased by 2% compared with the week before. In contrast, weekly footfall at retail parks fell by 2%. However, in the week to 22 May 2021, retail parks still had the strongest footfall relative to their pre-pandemic level when compared with other retail locations, at 93% of their level in the equivalent week of 2019.
After a strong rebound in April 2021, coinciding with the lifting of coronavirus (COVID-19) restrictions in England, Wales, Scotland and Northern Ireland, weekly retail footfall at high streets and shopping centres has levelled off. In the week to 22 May 2021, their weekly retail footfall figures were 62% and 70% of their levels in the equivalent week of 2019, respectively.
Regional retail footfall
Figure 8: In the week to 22 May 2021, retail footfall was strongest in the East of England when compared with other UK regions, at 77% of its level in the equivalent week of 2019
Volume of daily retail footfall, percentage of the level recorded on the same day of the equivalent week of 2019, UK regions, 1 March 2020 to 22 May 2021

Source: Springboard and the Department for Business, Energy and Industrial Strategy
Download this image Figure 8: In the week to 22 May 2021, retail footfall was strongest in the East of England when compared with other UK regions, at 77% of its level in the equivalent week of 2019
.PNG (111.3 kB)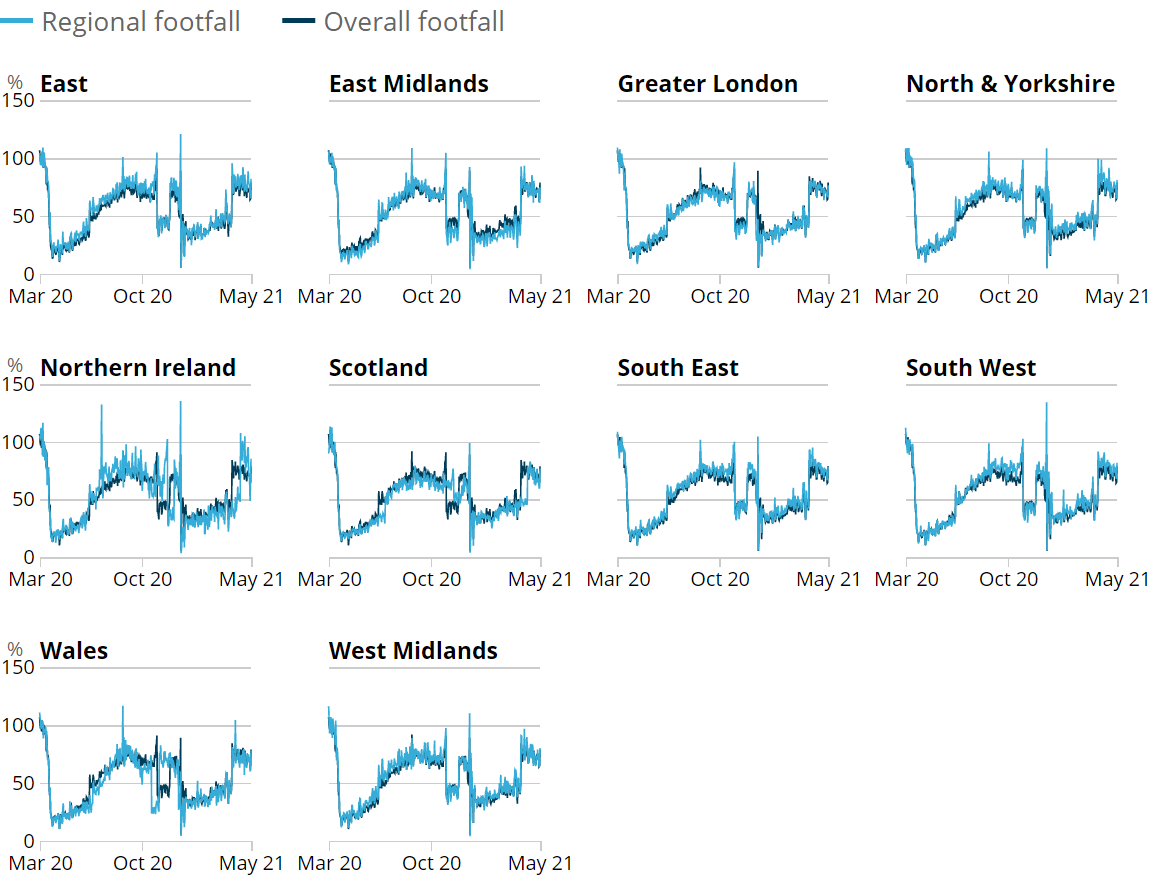
According to Springboard, in the week to 22 May 2021, retail footfall was strongest relative to its pre-pandemic levels in the East of England, the South West and the North and Yorkshire; their weekly retail footfall levels were 77%, 75% and 75% of the levels seen in the same week of 2019, respectively.
Week-on-week, the largest percentage increase in retail footfall was in Wales, where it rose by 4%. In contrast, footfall in Northern Ireland fell by 11% in the week to 22 May 2021.
Back to table of contents9. Ship visits
These shipping indicators are based on counts of all vessels, and cargo and tanker vessels. As discussed in Faster indicators of UK economic activity: shipping, we expect the shipping indicators to be related to the import and export of goods.
The coronavirus (COVID-19) pandemic first began to affect the level of shipping visits from the week ending 29 March 2020. For this reason, average ship visits in the latest week are compared with the equivalent week in 2019 rather than 2020.
Figure 9: There was an average of 365 daily ship visits in the week ending 23 May 2021, an increase of 4% from the previous week (350) but 6% lower than the equivalent week in 2019 (390)
Daily movements in shipping visits, UK, seasonally adjusted, 1 December 2019 to 23 May 2021
Source: exactEarth
Download this chart Figure 9: There was an average of 365 daily ship visits in the week ending 23 May 2021, an increase of 4% from the previous week (350) but 6% lower than the equivalent week in 2019 (390)
Image .csv .xls
Figure 10: There was an average of 110 cargo and tanker ship visits in the week ending 23 May 2021, an increase of 5% from the previous week (105) and 4% higher than the equivalent week in 2019 (106)
Daily movements in shipping visits, UK, seasonally adjusted, 1 December 2019 to 23 May 2021
Source: exactEarth
Notes:
- See the accompanying dataset for notable dates and weather events.
Download this chart Figure 10: There was an average of 110 cargo and tanker ship visits in the week ending 23 May 2021, an increase of 5% from the previous week (105) and 4% higher than the equivalent week in 2019 (106)
Image .csv .xls10. Road traffic in Great Britain
According to Department for Transport (DfT) non-seasonally adjusted road traffic data, the volume of all motor vehicle traffic on Monday 24 May 2021 was at 97% of the level seen on Monday of the first week of February 2020. This is broadly unchanged from last week (Monday 17 May 2021), but a 13 percentage point increase since 29 March 2021, when the “stay at home” restrictions ended in England.
Compared with the previous week, the volume of road traffic for light commercial vehicles and cars remained broadly similar at 111% and 92% of their levels seen on the same day of the first week of February 2020. Heavy goods vehicle traffic remained unchanged from last week at 109% of its level in the first week of February 2020.
Figure 11: The volume of motor vehicle traffic on Monday 24 May 2021 was at 97% of the level seen in the first week of February 2020, broadly unchanged from the previous week
Daily road traffic index: 100 = same traffic as the equivalent day of the week in the first week of February 2020, 1 March 2020 to 24 May 2021, non-seasonally adjusted
Embed code
Notes:
- The blue shaded areas refer to periods when restrictions across the UK were in effect. In order, these were: first national lockdown in the UK (23 March 2020) to easing of restrictions with non-essential shops reopening in England (15 June 2020); second lockdown in England (5 November 2020) to lockdown being replaced with three-tier system in England (2 December 2020); third lockdown announced in Scotland and England (4 January 2021) to “stay at home” restrictions ending in England 29 March 2021.
Download this chart
The daily DfT estimates are indexed to the first week of February 2020 and the comparison is with the same day of the week. The data provided are useful as an indication of traffic change rather than actual traffic volumes. More information on the methods, quality and economic analysis for these indicators can be found in the DfT methodology article.
Back to table of contents11. Data
UK spending on credit and debit cards
Dataset | Released 27 May 2021
Experimental indicator for monitoring UK retail purchases derived from the Bank of England's Clearing House Automated Payment System (CHAPS) data.
Shipping indicators
Dataset | Released 27 May 2021
Experimental weekly and daily ship visits dataset covering UK ports.
Traffic camera activity
Dataset | Released 27 May 2021
Experimental daily traffic camera counts data for busyness indices covering the UK.
Online job advert estimates
Dataset | Released 27 May 2021
Experimental job advert indices covering the UK online job market.
Company Incorporations and Voluntary Dissolutions
Dataset | Released 27 May 2021
The number of weekly Companies House Incorporations and Voluntary Dissolution applications accepted.
Online weekly price changes
Dataset | Released 27 May 2021
Experimental estimates of online price changes for a selection of food and drink products from several large UK retailers.
Vehicle flows around ports
Dataset | Released 27 May 2021
Monthly data showing vehicle flows around major ports in England. Contains average 15-minute sensor counts by size of vehicle, and average speeds.
12. Glossary
Faster indicator
A faster indicator provides insights into economic activity using close-to-real-time big data, administrative data sources, rapid response surveys or Experimental Statistics, which represent useful economic and social concepts.
Company incorporations
Incorporations are when a company is added to the Companies House register of limited companies. This can also include where an existing business applies to become a limited company, where it was not one before.
Voluntary dissolution applications
A voluntary dissolution application is when a company applies to begin dissolution proceedings. As such, they effectively chose to be removed from the Companies House register. For a company to be eligible to voluntarily dissolve, it should not have completed any trading activity for a period of three months.
Back to table of contents13. Measuring the data
UK coronavirus restrictions
A full overview of coronavirus (COVID-19) restrictions for each of the four UK constituent countries can be found here:
These restrictions should be considered when interpreting the data featured throughout this bulletin.
Back to table of contents14. Strengths and limitations
Information on the strengths and limitations of the indicators in this bulletin is available in the Coronavirus and the latest indicators of the UK economy and society methodology.
Back to table of contents