Table of contents
- Main points
- Latest indicators at a glance
- Retail footfall
- Shipping
- Road traffic in Great Britain
- UK flight data
- UK Spending on debit and credit cards
- Shelf availability in UK shops
- Online job adverts
- Self-isolation rates in the workforce by sector and for working age population by country
- Data
- Glossary
- Measuring the data
- Strength and limitations
- Related links
1. Main points
Many indicators in this release, particularly those related to transport and travel, were adversely affected in the latest period by extreme weather in parts of the UK; see the Met Office for more details.
In the week ending 20 February 2022, the seasonally adjusted average count of traffic camera activity in London for "pedestrians and cyclists" decreased by 17% from the previous week (Transport for London). See the accompanying dataset.
In the week to 19 February 2022, overall weekly retail footfall in the UK decreased by 4% from the previous week and was 74% of the level seen in the equivalent week of 2019; this decrease was principally driven by falling high street footfall (Springboard). Section 3.
There was an average of 243 daily ship visits in the week to 20 February 2022, an 18% decrease from the previous week; meanwhile, the average number of daily cargo and tanker ship visits decreased by 16% over the same period, to 79 (exactEarth). Section 4.
The volume of motor traffic on Monday 21 February 2022 fell by 3 percentage points from the previous week; this was driven by falls in all types of motor vehicles (Department for Transport). Section 5.
The seven-day average number of UK daily flights in the week to 20 February 2022 was broadly similar to the previous week and was 66% of the level seen in the equivalent week of 2020 (EUROCONTROL). Section 6.
The seven-day average estimate of UK seated diners decreased by 10 percentage points in the week to 21 February 2022, to 119% of the level in the equivalent week of 2019; this follows a 15-percentage point increase in the previous week, which coincided with Valentine's Day in 2022 (OpenTable).
The largest weekly increase in transactions at Pret A Manger stores in the week to 17 February 2022, was a 12-percentage point rise at London airport stores, to 82% of its January 2020 average level; the largest decrease meanwhile was in London suburban stores, which fell by 11 percentage points, to 117% (Pret A Manger).
In the week to 17 February 2022, the aggregate CHAPS-based indicator of credit and debit card purchases increased by 2% from the previous week, to 98% of its February 2020 average (Bank of England CHAPS data). Section 7.
The System Average Price (SAP) of gas decreased by 4% in the week to 20 February 2022, its third consecutive week-on-week fall (National Grid). See the accompanying dataset.
The percentage of businesses currently trading who reported that the prices of materials, goods or services bought in the last month had increased, was 39% in early February 2022, up from 33% in January 2022; in contrast, the percentage of businesses who reported that prices of materials, goods or services sold had increased remained stable, from 16% to 17%, over the same period (final results from Wave 50 of the Business Insights and Conditions Survey (BICS)).
Shelf availability of items between 18 and 21 February 2022 was lowest for "ibuprofen", with 19% of these items marked as "none" or "low"; shelf availability was highest for "beer", with 67% of this item recorded as "high" (Kantar Public). Section 8.
The total volume of online job adverts on 18 February 2022 remained broadly unchanged from the previous week, at 147% of its February 2020 pre-coronavirus (COVID-19) average level (Adzuna). Section 9.
There were 16,163 company incorporations in the week to 18 February 2022, a 4% decrease from the previous week (16,761) but 2% higher than the equivalent week of 2021 (15,846) (Companies House). See the accompanying dataset.
The percentage of the working-age population self-isolating because of coronavirus decreased in England in the week ending 12 February 2022 (Office for National Statistics - Coronavirus (COVID-19) Infection Survey). Section 10.
Results presented in this bulletin are experimental and may be subject to revision.
2. Latest indicators at a glance
Embed code
Notes:
- Users should note that the break in the available shipping data (from 14 to 19 June 2021) is when the data collection system changed.
- *Comparisons in OpenTable data are made now with the equivalent week in 2019 across the entire series. Comparisons from 1 January 2022 were previously made to the equivalent week in 2020.
- Users should note that, for the week ending 6 February 2022, there were a large number of Energy Performance Certificate (EPC) lodgements for existing dwellings in Yorkshire and The Humber from a housing association contract. Caution should be taken when interpreting these data.
3. Retail footfall
National retail footfall
National retail footfall figures are supplied by Springboard, a provider of data on customer activity. They measure the following for overall UK retail footfall, as well as by high street, retail park and shopping centre categories:
daily retail footfall as a percentage of its level on the same day of the equivalent week of 2019; for example, Saturday 19 February 2022 is compared with Saturday 16 February 2019
total weekly retail footfall as a percentage of its level in the equivalent week of 2019
the percentage change in weekly footfall compared with the previous week; for example, Week 7 of 2022 is compared with Week 6 of 2022
Springboard's weekly data are defined over a seven-day period running from Sunday to Saturday. Week 7 of 2022 therefore refers to the period Sunday 13 to Saturday 19 February 2022.
Because of data offsets between 2021 and previous years, footfall data from Springboard for the following days have been omitted: 22 to 23 December 2021, 25 to 26 December 2021, 29 December 2021 and 1 January 2022.
Users should note that all quoted figures have been rounded to the nearest integer.
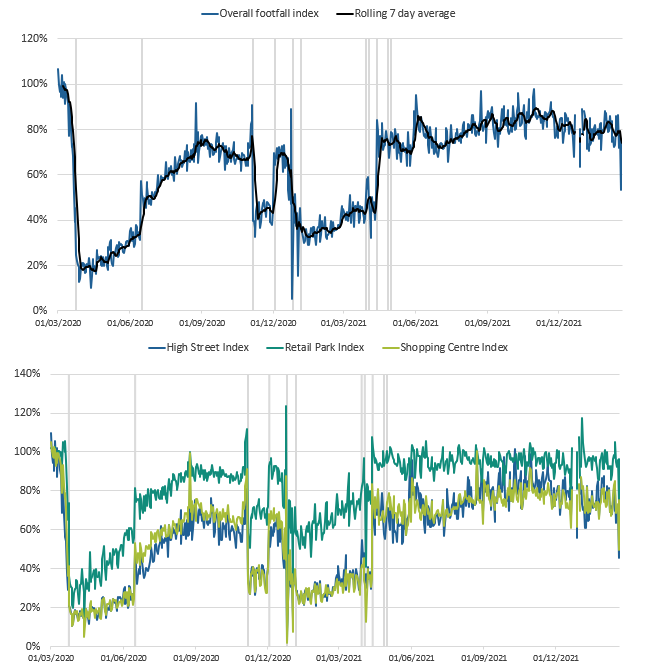
Figure 1: In the week to 19 February 2022, overall weekly retail footfall in the UK decreased by 4% and was 74% of the level seen in the equivalent week of 2019
Volume of daily retail footfall, percentage compared with the equivalent day of the equivalent week of 2019, 1 March 2020 to 19 February 2022, UK
Source: Springboard, Department for Business, Energy and Industrial Strategy
Notes:
- The vertical lines indicate notable events and coronavirus (COVID-19) restriction changes.
- Users should note that week-on-week changes in retail footfall volumes are outlined as percentages, rather than as percentage point changes. Percentage change figures quoted in the commentary will therefore not necessarily match the percentage point changes observed in the chart.
Download this image Figure 1: In the week to 19 February 2022, overall weekly retail footfall in the UK decreased by 4% and was 74% of the level seen in the equivalent week of 2019
.png (110.2 kB)
According to Springboard, in the UK in the week to 19 February 2022, the volume of overall weekly retail footfall:
in high streets decreased by 7% from the previous week and was 65% of the level seen in the equivalent week of 2019
in retail parks was unchanged from the previous week and was 94% of the level seen in the equivalent week of 2019
in shopping centres was unchanged from the previous week and was 72% of the level seen in the equivalent week of 2019
In the latest period retail footfall was affected by the adverse weather conditions throughout the UK. On Friday 18 February 2022, during Storm Eunice, overall retail footfall was 53% of the level seen in the equivalent day of 2019. This is the lowest single-day figure, relative to the equivalent day of 2019, since 11 April 2021 and the reopening of non-essential retail in England and Wales.
In the UK, on Friday 18 February 2022, the volume of retail footfall:
in high streets was 45% of the level seen in the equivalent day of 2019
in retail parks was 74% of the level seen in the equivalent day of 2019
in shopping centres was 50% of the level seen in the equivalent day of 2019
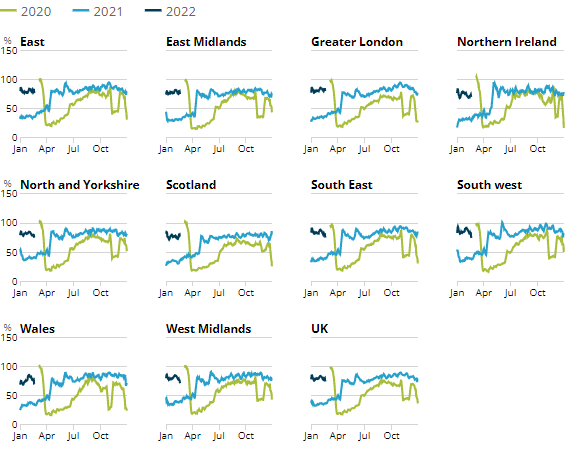
Figure 2: In the week to 19 February 2022, Greater London had the highest weekly levels of retail footfall compared with the equivalent week of 2019, at 80%
Volume of daily retail footfall, percentage of the level recorded on the same day of the equivalent week of 2019, seven-day rolling average, UK countries and English regions, 1 March 2020 to 19 February 2022
Source: Springboard, Department for Business, Energy and Industrial Strategy
Download this image Figure 2: In the week to 19 February 2022, Greater London had the highest weekly levels of retail footfall compared with the equivalent week of 2019, at 80%
.png (35.6 kB)
In the week to 19 February 2022, there were decreases in retail footfall in 8 out of the 10 English regions and UK countries. The largest weekly falls in retail footfall were in Wales and the South West, which fell by 10% and 8%, respectively, when compared with the previous week. These notable week-on-week decreases were driven by falling high street footfall.
These regions were subject to red weather warnings on Friday 18 February 2022 and further adverse weather conditions throughout the latest period, which could be a contributing factor in these falls. Please consult the Met Office website for more details.
Back to table of contents4. Shipping
A changeover in the systems used to collect these data has introduced a level shift in the data time series from 14 June 2021 onwards. Users should not make comparisons between data before and after this date. The data produced before the change, from 1 April 2019 to 13 June 2021, can still be compared within that period.
A full methodological review of our current method of data collection is under way and data may be subject to revision once this is complete. We will continue to update the accompanying dataset using the current method until the review is complete, which is likely to conclude in spring 2022.
Movements of ships in the latest period may have been affected by the extreme weather across the UK during 16 to 20 February 2022. See the Met Office for more details.
Figure 3: There was an average of 243 daily ship visits in the week to 20 February 2022, which was an 18% decrease from 296 in the previous week
Daily movements in shipping visits, UK, seasonally adjusted, 1 April 2019 to 20 February 2022, UK
Source: exactEarth
Download this chart Figure 3: There was an average of 243 daily ship visits in the week to 20 February 2022, which was an 18% decrease from 296 in the previous week
Image .csv .xls
Figure 4: The average number of daily cargo and tanker ship visits decreased by 16% in the week to 20 February 2022 to 79 visits
Daily movements in cargo shipping visits, seasonally adjusted, 1 April 2019 to 20 February 2022, UK
Source: exactEarth
Notes:
- The vertical line indicates the date when the data collection system changed. Users should not compare data before and after this date.
- See the accompanying dataset for notable dates and weather events.
- In the coming weeks, we will continue to review the seasonally adjusted estimates of shipping indicators data following its reintroduction with the discontinuity.
Download this chart Figure 4: The average number of daily cargo and tanker ship visits decreased by 16% in the week to 20 February 2022 to 79 visits
Image .csv .xls5. Road traffic in Great Britain
According to the Department for Transport (DfT) non-seasonally adjusted road traffic data, the volume of all motor vehicle traffic on Monday 21 February 2022 fell by 3 percentage points from the previous week (14 February 2022) to 91% of the level seen on the Monday of the first week in February 2020.
Traffic volumes for all types of motor vehicle fell from the previous week. Heavy goods vehicles and cars decreased by 4 and 3 percentage points to 100% and 87% of the level seen on the Monday of the first week in February 2020, respectively. Light commercial vehicles fell slightly by 1 percentage point to 107%.
These falls coincide with severe weather conditions throughout the UK in the latest period and warnings in place to discourage travel. Please consult the Met Office website for more details.
Figure 5: Traffic volumes for all vehicle types fell in the latest period following severe weather in some parts of Great Britain
Daily road traffic index: 100 = same traffic as the equivalent day of the week in the first week of February 2020, 1 March 2020 to 21 February 2022, non-seasonally adjusted, Great Britain
Embed code
Notes:
- The blue shaded areas refer to periods when restrictions across the UK were in effect.
Download the data
The daily DfT estimates are indexed to the first week of February 2020 and the comparison is with the same day of the week. The data provided are useful as an indication of traffic change rather than actual traffic volumes. More information on the methods, quality and economic analysis for these indicators can be found in the DfT methodology article.
Back to table of contents6. UK flight data
These data are daily flight figures from the European Organisation for the Safety of Air Navigation (EUROCONTROL). Daily flight numbers for the UK alongside other countries are available in EUROCONTROL's dashboard. EUROCONTROL is a pan-European, civil-military organisation dedicated to supporting European aviation. Its Aviation Intelligence and Performance Review Unit provides independent collection and validation of air navigation services performance-related data and intelligence gathering.
The flights data include international arrivals and departures to and from the UK (including crown dependencies) and domestic UK flights but exclude overflights (flights that pass over UK territory). They capture all flight movements that operate under Instrument Flight Rules (IFR), where the pilot uses instruments in the flight deck to control, guide and adjust the plane. This includes commercial flights carrying passengers and cargo as well as non-commercial flights such as private and military flights.
Data from EUROCONTROL do not include information on the volume of passengers or cargo carried on UK flights. Especially in the context of the coronavirus (COVID-19) pandemic, flights might not be operating at full capacity and therefore trends in passengers and cargo will differ from trends in flights presented here.
Figure 6: The seven-day average number of UK daily flights was broadly similar to the previous week and was 66% of the level seen in the equivalent week of 2020
Number of daily flights, non-seasonally adjusted, and seven-day moving average, 2 January 2019 to 20 February 2022, UK
Source: European Organisation for the Safety of Air Navigation (EUROCONTROL)
Download this chart Figure 6: The seven-day average number of UK daily flights was broadly similar to the previous week and was 66% of the level seen in the equivalent week of 2020
Image .csv .xlsFollowing large falls at the start of 2022, coinciding with seasonal norms and the spread of the Omicron coronavirus variant, the average number of UK daily flights in the week to 20 February 2022 was broadly similar to the previous week. Having increased by 17% in the previous week, it has remained at 66% of the level seen in the equivalent week of 2020.
The full data time series available for UK flights can be found in the accompanying dataset, which contains daily flight numbers and the rolling seven-day averages.
Back to table of contents7. UK Spending on debit and credit cards
Daily CHAPS-based indicator
These data series are experimental faster indicators for estimating UK spending on credit and debit cards. They track the daily CHAPS payments made by credit and debit card payment processors to around 100 major UK retail corporates. These payments are the proceeds of recent credit and debit card transactions made by customers at their stores, both though physical and online platforms. More information on the indicator is provided in the accompanying methodology article.
Companies are allocated to one of four categories based on their primary business:
"staples" refers to companies that sell essential goods that households need to purchase, such as food and utilities
"work-related" refers to companies providing public transport or selling petrol
"delayable" refers to companies selling goods whose purchase could be delayed, such as clothing or furnishings
"social" refers to spending on travel and eating out
Figure 7: The aggregate CHAPS-based indicator of credit and debit card purchases increased by 2% in the week to 17 February 2022 to 98% of its February 2020 average
A backward looking seven-day rolling average, 13 January 2020 to 17 February 2022, non-seasonally adjusted, nominal prices
Source: Office for National Statistics and Bank of England calculations
Notes:
- Users should note the daily payment data is the sum of card transactions processed up to the previous working day, so there is a slight time lag when compared with real-life events on the chart.
- The vertical lines indicate notable events and coronavirus (COVID-19) restriction changes.
- Percentage point difference is derived from current week and previous week index before rounding.
Download this chart Figure 7: The aggregate CHAPS-based indicator of credit and debit card purchases increased by 2% in the week to 17 February 2022 to 98% of its February 2020 average
Image .csv .xlsFigure 7 shows changes in the value of CHAPS payments received by large UK corporates from their credit and debit card processors, "merchant acquirers".
In the week to 17 February 2022, the CHAPS-based indicator of credit and debit card purchases increased by 2% from the previous week, to 98% of its February 2020 average level. The week to 17 February coincides with Storm Dudley but falls before the issuing of red weather warnings for Storm Eunice on 18 February 2022.
The spending categories recorded the following changes in the latest week:
- "delayable" increased by 4 percentage points
- "social" increased by 3 percentage points
- "work-related" increased by 2 percentage points
- "staple" was unchanged
"Work-related" and "staple" spending were above their February 2020 average levels at 115% and 107%, respectively. "Social" spending was at its February 2020 level. "Delayable" spending meanwhile was below its February 2020 average levels at 84%.
Back to table of contents8. Shelf availability in UK shops
Shelf availability research for shops across the UK has been undertaken by Kantar Public. Collectors gathered information on a range of items from up to three different stores across multiple locations. They recorded availability across four categories: "none", "low", "medium" or "high".
It is important to note these categories are subjective as they are recorded by individual collectors. The data were collected between 18 and 21 February 2022.
The next publication of these data, to be released on 10 March 2022, will be the last release for the current time. The Office for National Statistics (ONS) retains the option to restart these data if the need arises.
Figure 8: Shelf availability of items in the latest period was lowest for “ibuprofen” and “paracetamol”, with 19% and 18% of these items’ availability respectively marked as either “none or low”
Item availability in stores across 133 locations covering UK countries and English regions, between 18 and 21 February 2022
Source: Kantar Public
Notes:
- Shelf availability does not imply stock availability in warehouses or storage units and is simply the level of available products in a selected sample of shops at the time of data collection.
- In this period, 270 shops were visited and 5,658 observations were made.
- Categories in this chart have been rounded for illustrative purposes and may not sum to category total or 100.
Download this chart Figure 8: Shelf availability of items in the latest period was lowest for “ibuprofen” and “paracetamol”, with 19% and 18% of these items’ availability respectively marked as either “none or low”
Image .csv .xlsIn the most recent period (18 to 21 February 2022), the overall proportion of observations for all categories recorded as "high" was 52%; this was down two percentage points from the previous four-day period (4 to 7 February 2022). Observations for all items recorded as "none" or "low" was at 8%, unchanged from the previous period.
Across the four availability categories, the largest proportion of observations recorded as "high" was "beer" at 67%, followed by "frozen chips", "frozen vegetables" and "potatoes", at 62%, 61% and 61%, respectively. The items with the highest proportion of availability recorded as either "none" or "low" were "ibuprofen" and "paracetamol" at 19% and 18%, respectively.
Data for all categories are available in the accompanying dataset.
Back to table of contents9. Online job adverts
Job adverts by category
These figures are experimental estimates of online job adverts provided by Adzuna, an online job search engine, by category and by UK country and English region. The number of job adverts over time is an indicator of the demand for labour. The Adzuna categories used do not correspond to Standard Industrial Classification (SIC) categories, so these values are not directly comparable with the Office for National Statistics' (ONS) Vacancy Survey.
Figure 9: The total volume of online job adverts on 18 February 2022 remained broadly unchanged from the previous week, at 147% of its February 2020 pre-coronavirus average level
Volume of online job adverts by category, index: 100 = February 2020 average, 4 January 2019 to 18 February 2022, non-seasonally adjusted
Embed code
Notes:
- Further category breakdowns are included in the Online job advert estimates dataset and more details on the methodology can be found in Using Adzuna data to derive an indicator of weekly vacancies.
- Users should note that week-on-week changes in online job advert volumes are outlined as percentages, rather than as percentage point changes. Percentage change figures quoted in the commentary will therefore not necessarily match the percentage point changes observed in the charts and accompanying dataset.
Download the data
Of the 28 categories, 16 saw an increase in the number of online job adverts, while eight decreased and four remained unchanged when compared with the previous week. The largest weekly increases were in "healthcare and social care" and "scientific and quality assurance", which both rose by 7%. Meanwhile, the largest weekly decrease was in "domestic help", which fell by 11%.
The category with the highest level of online job adverts when compared with its February 2020 pre-coronavirus (COVID-19) average level continued to be "transport, logistics and warehouse" at 261%.
Job adverts by region
Figure 10: The largest increases in the volume of online job adverts were in the West Midlands and Yorkshire and The Humber, which increased by 3% when compared with the previous week
Volume of online job adverts by UK countries and English regions index: 100 = February 2020 average, 4 January 2019 to 18 February 2022, non-seasonally adjusted
Embed code
Download the data
The volume of online job adverts increased in 8 of 12 English regions and UK countries on 18 February 2022 when compared with the previous week. The largest increases were seen in the West Midlands and Yorkshire and The Humber, which both increased by 3%, but were offset by a similar fall in the London region.
Back to table of contents10. Self-isolation rates in the workforce by sector and for working age population by country
Data from the Coronavirus (COVID-19) Infection Survey (CIS) were used to provide modelled estimates of the proportion of the workforce self-isolating because of coronavirus by work sector and the proportion of the working age population self-isolating because of coronavirus by country.
In the week ending 12 February 2022, the percentage of people self-isolating because of coronavirus in all work sectors has decreased, but these changes may be because of chance. This follows an increase in self-isolation in "teaching and education", "social care" and "health-care" in the two weeks ending 29 January 2022.
Figure 11: The percentage of the working-age population self-isolating because of coronavirus decreased in England in the week ending 12 February 2022
Estimated percentage of the working-age population (aged 17 to 69 years) self-isolating because of coronavirus from 26 December 2021 to 12 February 2022, UK countries
Embed code
Notes:
- All results are provisional and subject to revision.
- These statistics refer to self-reported self-isolation occurring in working-age adults (aged 17 to 69 years), regardless of employment status, living in private households.
- During the period shown, self-isolation requirements were frequently updated with different changes taking place at different times across the UK countries.
Download the data
Figure 12: The sectors with the highest percentage of the workforce in self-isolation on 12 February 2022 were “food production, agriculture and farming” and “social care”, at 2.8% and 2.2% respectively
Estimated percentage of the workforce self-isolating because of coronavirus, by work sector, 19 December 2021 to 12 February 2022, UK
Embed code
Notes:
- All results are provisional and subject to revision.
- These statistics refer to self-reported self-isolation in working adults (aged 16 years and over) living in private households.
- In the “food production, agriculture and farming” work sector, there is a 95% confidence interval from 1.9% to 4.2%.
- In the “social care” work sector, there is a 95% confidence interval from 1.5% to 3.3%.
Download the data
More information on how these estimates were calculated is available in Coronavirus (COVID-19) Infection Survey (CIS) estimates of the UK workforce in self-isolation by sector, published on 14 February 2022.
A breakdown of the CIS data is available in the accompanying dataset.
Back to table of contents11. Data
Advance potential redundancies
Dataset | Released 24 February 2022
Weekly dataset showing the number of potential redundancies and employers proposing redundancies, submitted to Insolvency Service via HR1 forms.
Daily UK flights
Dataset | Released 24 February 2022
Experimental daily UK flight numbers and rolling seven-day average, including flights to, from, and within the UK.
Weekly shipping indicators
Dataset | Released 24 February 2022
Experimental weekly and daily ship visits dataset covering UK ports.
Traffic camera activity
Dataset | Released 24 February 2022
Experimental daily traffic camera counts data for busyness indices covering the UK.
UK spending on credit and debit cards
Dataset | Released 24 February 2022
Experimental indicator for monitoring UK retail purchases derived from the Bank of England's CHAPS data.
System Average Price (SAP) of gas
Dataset | Released 24 February 2022
Daily and rolling average System Average Price (SAP) of gas traded in the UK.
Users should note that this section lists a selection of the data available with this publication. For the full list of available datasets please see the accompanying dataset page.
Back to table of contents12. Glossary
Faster indicator
A faster indicator provides insights into economic activity using close-to-real-time big data, administrative data sources, rapid response surveys or Experimental Statistics, which represent useful economic and social concepts.
Company incorporations
Incorporations are when a company is added to the Companies House register of limited companies. This can also include where an existing business applies to become a limited company, where it was not one before.
Voluntary dissolution applications
A voluntary dissolution application is when a company applies to begin dissolution proceedings. As such, they effectively choose to be removed from the Companies House register. For a company to be eligible to voluntarily dissolve, it should not have completed any trading activity for a period of three months.
Compulsory dissolutions
When a company fails to file the required financial accounts and/or confirmation statements, if no contact is received by Companies House following a series of letters to the company and its officers, a first gazette notice is published in the Gazette, a notice of the Registrar's intention to dissolve the company.
Back to table of contents13. Measuring the data
UK coronavirus (COVID-19) restrictions
A full overview of coronavirus restrictions for each of the four UK constituent countries can be found here:
These restrictions should be considered when interpreting the data featured throughout this bulletin.
Back to table of contents14. Strength and limitations
Information on the strengths and limitations of the indicators in this bulletin is available in the Economic activity and social change in the UK, real-time indicators methodology.
The methodology for the advanced notifications of potential redundancies dataset can be found in the in the 3 February 2022 Economic activity and social change in the UK, real-time indicators publication. In the coming weeks there will be a full methodology paper published, which will be linked in this bulletin.
Back to table of contents