Table of contents
- Main points
- Latest indicators at a glance
- Retail footfall
- Shelf availability of items from UK shops
- Online job adverts
- UK flight data
- UK spending on debit and credit cards
- Transactions at Pret A Manger
- Shipping
- Road traffic in Great Britain
- Value-added tax returns
- Data
- Glossary
- Measuring the data
- Strengths and limitations
- Related links
1. Main points
The seven-day average estimate of UK seated diners fell by 48 percentage points in the week to 10 January 2022, to 88% of the level in the equivalent week of 2020; in London and Manchester seated diners fell by 23 and 57 percentage points over the same period, respectively (OpenTable).
In the week to 8 January 2022, overall retail footfall in the UK decreased by 6% and was 78% of the level seen in the equivalent week of 2019 (Springboard). Section 3.
Shelf availability of items between 7 and 10 January 2022 was lowest for "paracetamol", with 29% of this item marked as "none" or "low"; shelf availability was highest for "beer", with 82% of this item recorded as "high" (Kantar Public). Section 4.
The total volume of online job adverts on 7 January 2022 was at 117% of its February 2020 average level, a 3% decrease from the previous week; the highest level of job adverts relative to February 2020 continued to be in the "transport, logistics and warehouse" category, at 230% (Adzuna). Section 5.
In the week ending 9 January 2022, the seven-day average number of UK daily flights was 68% of the level seen in the equivalent week of 2020 (EUROCONTROL). Section 6.
In the week to 6 January 2022, the aggregate CHAPS-based indicator of credit and debit card purchases decreased by 4 percentage points from the previous week, to 82% of its February 2020 average (Bank of England CHAPS data). Section 7.
In late December 2021, approximately 3% of the workforce were estimated to be on sick leave or not working because of coronavirus (COVID-19) symptoms, self-isolation or quarantine, this is the highest the figure has been since comparable estimates began in June 2020; the other service activities industry, which includes hairdressing and other beauty treatments, reported the highest absence levels (7%) (final results from Wave 47 of Business Insights and Conditions Survey (BICS)).
Just over one-fifth (21%) of businesses reported increased cancellations from customers in the last month, with nearly half (44%) of businesses in the accommodation and food service activities industry reporting an increase (final results from Wave 47 of BICS).
Following an expected seasonal nationwide decrease in transactions at Pret A Manger stores over the Christmas period, transactions at stores in suburban London increased the most in the latest week (when compared with January 2020); transactions increased by 29 percentage points in the week to 6 January 2022, to 88% of the January 2020 average (Pret A Manger). Section 8.
There was an average of 248 daily ship visits in the week to 9 January 2022, which was a 26% increase from the previous week, while the average number of daily cargo and tanker ship visits increased by 33% in the same period (exactEarth). Section 9.
The volume of motor vehicle traffic on Monday 10 January 2022 was 87% of its level in the first week of February 2020; this follows large falls between Christmas and New Year in line with expected seasonal patterns (Department for Transport). Section 10.
In Quarter 4 (Oct to Dec) 2021, a net 3% of firms reported an increase in turnover at the total industry level when compared with Quarter 3 (July to Sept) 2021; this is the sixth successive quarter with net positive reported industry level turnover (HM Revenue and Customs VAT returns). Section 11.
In the week ending 9 January 2022, the seasonally adjusted average count of traffic camera activity for trucks in London and the North East increased by 29% and 21%, respectively (Transport for London, North East traffic cameras). See the accompanying dataset.
The system average price (SAP) of gas increased by 3% in the week to 9 January 2022 following a fall of 48% in the previous week; the seven-day rolling average gas price is at its lowest level since the week ending 14 November 2021 (National Grid). See the accompanying dataset.
There were 11,899 company incorporations in the week to 7 January 2022, 44% higher than the first week of January 2021 (8,248) and 62% higher than the first week of 2020 (7,366) (Companies House). See the accompanying dataset.
Results presented in this bulletin are experimental and may be subject to revision.
2. Latest indicators at a glance
Embed code
Notes:
Users should note that the large week-on-week increases follow expected seasonal patterns of reduced activity between Christmas and New Year.
For Energy Performance Certificates (EPCs), the latest change comparisons have been made with two weeks previous. This is due to a dramatic reduction in certifications between Christmas and New Year, in line with expected seasonal patterns.
Users should note that the break in the available shipping data (from 14 to 19 June 2021) is when the data collection system changed.
*Comparisons in OpenTable data are made to the equivalent week in 2019 until December 2021. From 1 January 2022 comparisons are made to the equivalent week in 2020. This is likely to change in the coming weeks and revert back to 2019 comparisons across the series.
3. Retail footfall
National retail footfall
National retail footfall figures are supplied by Springboard, a provider of data on customer activity. They measure the following for overall UK retail footfall, as well as by high street, retail park, and shopping centre categories:
daily retail footfall as a percentage of its level on the same day of the equivalent week of 2019; for example, Saturday 8 January 2022 is compared with Saturday 5 January 2019
total weekly retail footfall as a percentage of its level in the equivalent week of 2019
the percentage change in weekly footfall compared with the previous week; for example, Week 1 of 2022 is compared with Week 52 of 2021
Springboard's weekly data are defined over a seven-day period running from Sunday to Saturday. Because of data offsets between 2021 and previous years, footfall data from Springboard for the following days have been omitted: 22 to 23 December 2021, 25 to 26 December 2021, 29 December 2021 and 1 January 2022.
Week 1 of 2022 therefore refers to the period Sunday 2 January to Saturday 8 January 2022.
Users should note that all quoted figures have been rounded to the nearest integer.
Figure 1: In the week to 8 January 2022, overall retail footfall in the UK decreased by 6% and was 78% of the level seen in the equivalent week of 2019
Volume of overall daily retail footfall, percentage compared with the equivalent day of the equivalent week of 2019, 1 March 2020 to 8 January 2022, UK

Source: Springboard, The Department for Business, Energy and Industrial Strategy
Notes:
- The vertical lines indicate notable events and coronavirus (COVID-19) restriction changes.
- Users should note that week-on-week changes in retail footfall volumes are outlined as percentages, rather than as percentage point changes. Percentage change figures quoted in the commentary will therefore not necessarily match the percentage point changes observed in the chart.
Download this image Figure 1: In the week to 8 January 2022, overall retail footfall in the UK decreased by 6% and was 78% of the level seen in the equivalent week of 2019
.png (207.9 kB)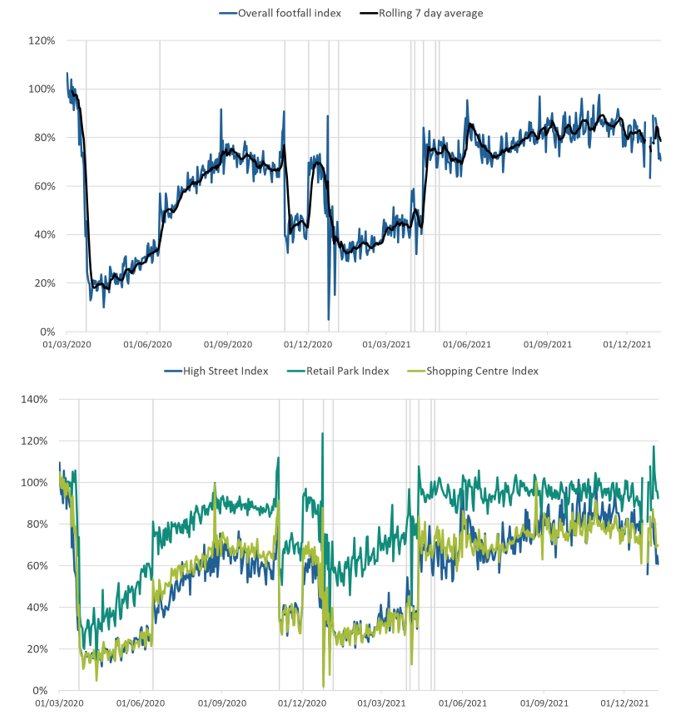
According to Springboard, in the UK in the week to 8 January 2022, the volume of overall retail footfall:
in high streets decreased by 11% from the previous week and was 69% of the level seen in the equivalent week of 2019
in retail parks increased by 3% from the previous week and was 100% of the level seen in the equivalent week of 2019
in shopping centres decreased by 4% from the previous week and was 76% of the level seen in the equivalent week of 2019
Regional retail footfall
Figure 2: In the week to 8 January 2022 the South West and South East of England had the highest levels of retail footfall compared with the equivalent week of 2019, both at 84%
Volume of daily retail footfall, percentage of the level recorded on the same day of the equivalent week of 2019, seven-day rolling average, UK countries and English regions, 1 March 2020 to 8 January 2022

Download this image Figure 2: In the week to 8 January 2022 the South West and South East of England had the highest levels of retail footfall compared with the equivalent week of 2019, both at 84%
.png (92.3 kB)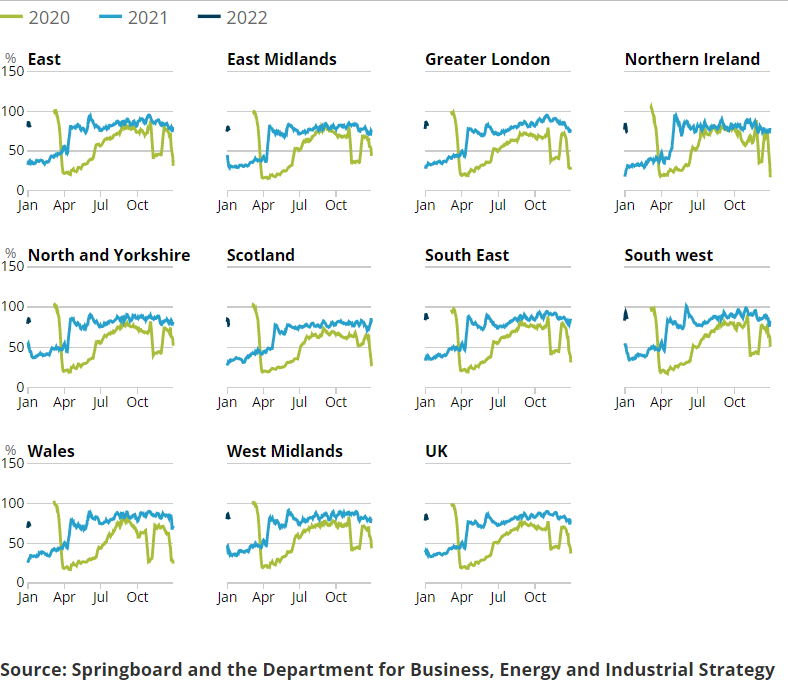
In the week to 8 January 2022, retail footfall saw week-on-week decreases in all 10 UK countries and English regions. The largest falls were in Northern Ireland and the West Midlands, decreasing from the previous week by 13% and 10%, respectively.
Back to table of contents4. Shelf availability of items from UK shops
Shelf availability research for shops across the UK has been undertaken by Kantar Public. Collectors gathered information on a range of items from up to three different stores across multiple locations. They recorded availability across four categories: "none", "low", "medium", or "high". It is important to note these categories are subjective as they are recorded by individual collectors. The data were collected between 7 and 10 January 2022. This series will be updated fortnightly.
Figure 3: Shelf availability of items in the latest period was lowest for “paracetamol” and “ibuprofen”, with 29% and 20% of these item’s availability marked as either “none” or “low”, respectively
Item availability in stores across 133 locations covering UK countries and English regions, between 7 and 10 January 2022
Source: Kantar Public
Notes:
- Shelf availability does not imply stock availability in warehouses or storage units and is simply the level of available products in a selected sample of shops at the time of data collection.
- In this period, 270 shops were visited and 5,659 observations were made.
- Categories in this chart have been rounded for illustrative purposes and may not sum to category total or 100.
Download this chart Figure 3: Shelf availability of items in the latest period was lowest for “paracetamol” and “ibuprofen”, with 29% and 20% of these item’s availability marked as either “none” or “low”, respectively
Image .csv .xlsIn the most recent period (7 to 10 January 2022), the overall proportion of observations for all categories recorded as "high" was 48%; this was down 4 percentage points from the previous four-day period (17 to 20 December 2021). Observations for all items recorded as "none" or "low" was at 10%, broadly similar to the previous period.
Across the four availability categories, the largest proportion of observations recorded as "high" was "beer" at 82%, followed by "potatoes" at 61%. The items with the highest proportion of availability recorded as either "none" or "low" were "paracetamol" and "ibuprofen" at 29% and 20%, respectively.
Data for all categories are available in the accompanying dataset.
Back to table of contents5. Online job adverts
Job adverts by category
These figures are experimental estimates of online job adverts provided by Adzuna, an online job search engine, by category and by UK country and English region. The number of job adverts over time is an indicator of the demand for labour. The Adzuna categories used do not correspond to Standard Industrial Classification (SIC) categories, so these values are not directly comparable with the Office for National Statistics’ (ONS) Vacancy Survey.
Figure 4: The total volume of online job adverts on 7 January 2022 decreased by 3% to 117% of its February 2020 pre-coronavirus average level
Volume of online job adverts by category, index: 100 = February 2020 average, 4 January 2019 to 7 January 2022, non-seasonally adjusted
Embed code
Notes:
- Further category breakdowns are included in the Online job advert estimates dataset and more details on the methodology can be found in Using Adzuna data to derive an indicator of weekly vacancies.
- Users should note that week-on-week changes in online job advert volumes are outlined as percentages, rather than as percentage point changes. Percentage change figures quoted in the commentary will therefore not necessarily match the percentage point changes observed in the charts and accompanying dataset.
Download the data
Of the 28 categories, 17 saw a decrease in the number of online job adverts, while 10 increased and one remained unchanged when compared with the previous week. The largest weekly decreases were in “travel and tourism”, “admin, clerical and secretarial” and “facilities and maintenance”, which fell by 20%, 19% and 18%, respectively. Meanwhile, the largest weekly increase was in “IT, computing and software”, which rose by 17%.
Despite seeing a decrease of 12% from the previous week, “transport, logistics and warehouse” continues to be the category with the highest level of online job adverts when compared with its February 2020 pre-coronavirus average level at 230%.
Job adverts by region
Figure 5: The only weekly increase on 7 January 2022 was in London, where the volume of online job adverts increased by 6% to 107% of its February 2020 pre-coronavirus average level
Volume of online job adverts by UK countries and English regions index: 100 = February 2020 average, 4 January 2019 to 7 January 2022, non-seasonally adjusted
Embed code
Download the data
The only weekly increase on 7 January 2022 was in London, where the volume of online job adverts increased by 6%. Meanwhile, the largest weekly decreases were in Wales, Scotland and the East Midlands, which fell by 12%, 11% and 10%, respectively. The volumes of online job adverts in all UK countries and English regions (12 in total) were above their February 2020 levels.
Back to table of contents6. UK flight data
These data are daily flight figures from the European Organisation for the Safety of Air Navigation (EUROCONTROL). Daily flight numbers for the UK alongside other countries are available in EUROCONTROL's dashboard. EUROCONTROL is a pan-European, civil-military organisation dedicated to supporting European aviation. Its Aviation Intelligence and Performance Review Unit provides independent collection and validation of air navigation services performance-related data and intelligence gathering.
The flights data include international arrivals and departures to and from the UK (including crown dependencies) and domestic UK flights, but exclude overflights (flights that pass over UK territory). They capture all flight movements that operate under Instrument Flight Rules (IFR), where the pilot uses instruments in the flight deck to control, guide and adjust the plane. This includes commercial flights carrying passengers and cargo as well as non-commercial flights such as private and military flights.
Data from EUROCONTROL do not include information on the volume of passengers or cargo carried on UK flights. Especially in the context of the coronavirus (COVID-19) pandemic, flights might not be operating at full capacity and therefore trends in passengers and cargo will differ from trends in flights presented here.
Figure 6: The seven-day average number of UK daily flights was 68% of the level seen in the equivalent week of 2020
Number of daily flights, non-seasonally adjusted, and seven-day moving average, 2 January 2019 to 9 January 2022, UK
Source: European Organisation for the Safety of Air Navigation (EUROCONTROL)
Notes:
- The fall in February 2020 coincides with Storm Ciara.
- The falls in December and January coincide with Christmas Eve, Christmas Day, New Year’s Eve and New Year’s Day.
Download this chart Figure 6: The seven-day average number of UK daily flights was 68% of the level seen in the equivalent week of 2020
Image .csv .xlsIn the latest week, the seven-day average number of UK daily flights was 3,329. This is almost triple that of the level on 17 May 2021, when international travel was allowed to resume, and the UK government implemented travel guidance.
You can find the full data time series available for UK flights in the accompanying dataset, which contains daily flight numbers and the rolling seven-day averages.
Back to table of contents7. UK spending on debit and credit cards
Daily CHAPS-based indicator
These data series are experimental faster indicators for estimating UK spending on credit and debit cards. They track the daily CHAPS payments made by credit and debit card payment processors to around 100 major UK retail corporates. These payments are the proceeds of recent credit and debit card transactions made by customers at their stores, both via physical and online platforms. More information on the indicator is provided in the accompanying methodology article.
Companies are allocated to one of four categories based on their primary business:
"staples" refers to companies that sell essential goods that households need to purchase, such as food and utilities
"work-related" refers to companies providing public transport or selling petrol
"delayable" refers to companies selling goods whose purchase could be delayed, such as clothing or furnishings
"social" refers to spending on travel and eating out
Figure 7: The aggregate CHAPS-based indicator of credit and debit card purchases decreased by 4 percentage points in the week to 6 January 2022 to 82% of its February 2020 average
Index February 2020 = 100, a backward looking seven-day rolling average, 13 January 2020 to 6 January 2022, non-seasonally adjusted, nominal prices
Source: ONS and Bank of England calculations
Notes:
- Users should note the daily payment data is the sum of card transactions processed up to the previous working day, so there is a slight time lag when compared with real-life events on the chart.
- The vertical lines indicate notable events and coronavirus (COVID-19) restriction changes.
- Percentage point difference is derived from current week and previous week index before rounding.
Download this chart Figure 7: The aggregate CHAPS-based indicator of credit and debit card purchases decreased by 4 percentage points in the week to 6 January 2022 to 82% of its February 2020 average
Image .csv .xlsFigure 7 shows changes in the value of CHAPS payments received by large UK corporates from their credit and debit card processors, "merchant acquirers".
In the week to 6 January 2022, the CHAPS-based indicator of credit and debit card purchases decreased by 4 percentage points from the previous week, to 82% of its February 2020 average level.
The spending categories recorded the following changes in the latest week:
- "social" increased by 10 percentage points
- "delayable" decreased by 16 percentage points
- "work-related" decreased by 4 percentage points
- "staple" decreased by 3 percentage points
These latest changes appear broadly consistent with a seasonal effect. In the latest week, "delayable", "social" and "work-related" spending were below their February 2020 average levels at 70%, 78% and 87%, respectively. "Staple" spending was broadly similar to its February 2020 level at 99%.
Monthly CHAPS-based indicator
In December 2021, the monthly CHAPS-based indicator of aggregate credit and debit card spending was at 115% of its February 2020 average level, 10 percentage points higher than November 2021. This is the highest the monthly CHAPS-based indicator has been since the series began in January 2020.
The monthly data time series is available in the accompanying dataset and includes methodological notes that users should bear in mind. The monthly CHAPS index is calculated by the Office for National Statistics (ONS), rather than being an additional series that is produced and validated by the Bank of England.
Back to table of contents8. Transactions at Pret A Manger
Pret A Manger is a sandwich and coffee shop franchise chain, operating around 400 stores across the UK. Its transactional data are presented as an index and show total weekly till transactions at Pret A Manger shops as a proportion of the average weekly level in the first four weeks of 2020 (between Friday 3 January and Thursday 30 January 2020). Because of this comparison across the data time series, users should expect an element of seasonality in the data.
More information on the areas featured is available in the Measuring the data section. These data are also made available every Tuesday via Bloomberg.
Figure 8: In the week ending 6 January 2022, transactions remained lowest compared with the January average in London City stores at 29% of the January 2020 average
Transactions in stores, index: 100 = January 2020 average, week ending 4 March 2021 to 6 January 2022, non-seasonally adjusted
Source: Pret A Manger
Notes:
- Dine-in services in England were suspended during the third national lockdown, which remained in place until Step 3 (17 May 2021) of England’s roadmap out of lockdown.
- Users should note not all store locations reopened as coronavirus (COVID-19) restrictions were eased.
- The index begins on 4 March 2021 as most stores were closed before this therefore the corresponding indices were mostly zero.
Download this chart Figure 8: In the week ending 6 January 2022, transactions remained lowest compared with the January average in London City stores at 29% of the January 2020 average
Image .csv .xlsAcross the UK, all regions saw notable reductions in transactions in the run-up to Christmas, with Manchester falling the furthest (31 percentage points in the week to 23 December 2021). Suburban London stores rebounded the quickest from this seasonal drop, with a 29 percentage point increase in the week to 6 January 2022, to 88% of the January 2020 average.
Figure 9: Following a notable increase before Christmas, transactions at stores in London airports decreased by 10 percentage points in the week to 6 January 2022 to 56% of the January 2020 average
Transactions in stores, index: 100 = January 2020 average, week ending 4 March 2021 to 6 January 2022, non-seasonally adjusted
Source: Pret A Manger
Download this chart Figure 9: Following a notable increase before Christmas, transactions at stores in London airports decreased by 10 percentage points in the week to 6 January 2022 to 56% of the January 2020 average
Image .csv .xlsOf the transport related locations, London Airports saw a 14 percentage point increase in the week to 23 December 2021, while London and regional stations both saw drops of 13 percentage points in the same period.
Back to table of contents9. Shipping
A changeover in the systems used to collect these data has introduced a level shift in the data time series from 14 June 2021 onwards. Users should not make comparisons between data before and after this date. The data produced prior to the change, for 1 April 2019 to 13 June 2021, can still be compared within that period.
A full methodological review of our current method of data collection is under way and data may be subject to revision once this is complete. We will continue to update the accompanying dataset using the current method until the review is complete, which is likely to conclude in Spring 2022.
Figure 10: There was an average of 248 daily ship visits in the week to 9 January 2022, a 26% increase from 197 visits the previous week
Daily movements in shipping visits, UK, seasonally adjusted, 1 April 2019 to 9 January 2022, UK
Source: exactEarth
Download this chart Figure 10: There was an average of 248 daily ship visits in the week to 9 January 2022, a 26% increase from 197 visits the previous week
Image .csv .xls
Figure 11: The average number of daily cargo and tanker ship visits increased by 33% in the week to 9 January 2022 to 84 visits
Daily movements in cargo shipping visits, seasonally adjusted, 1 April 2019 to 9 January 2022, UK
Source: exactEarth
Notes:
- The vertical line indicates the date when the data collection system changed. Users should not compare data before and after this date.
- See the accompanying dataset for notable dates and weather events.
- In the coming weeks, we will continue to review the seasonally adjusted estimates of shipping indicators data following its reintroduction with the discontinuity.
- The week on week increases follow expected seasonal patterns of reduced activity between Christmas and New Year.
Download this chart Figure 11: The average number of daily cargo and tanker ship visits increased by 33% in the week to 9 January 2022 to 84 visits
Image .csv .xls10. Road traffic in Great Britain
In the analysis below, week-on-three-week comparisons are made to avoid comparing against the lower level of motor vehicle traffic seen in the previous two Mondays because of the Christmas and New Year bank holidays. The latest week (Monday 10 January 2022) is compared with Monday 20 December 2021.
According to the Department for Transport (DfT) non-seasonally adjusted road traffic data, the volume of all motor vehicle traffic on Monday 10 January 2022 decreased by 7 percentage points from 20 December 2021 to 87% of the level seen on the Monday of the first week in February 2020.
Compared with 20 December 2021, traffic volumes for cars decreased by 8 percentage points to 82% of the level seen in the first week of February 2020. Heavy goods vehicles and light commercial vehicles decreased by 4 and 2 percentage points over the same period, respectively.
Figure 12: The volume of motor vehicle traffic on Monday 10 January was 87% of its level in the first week of February 2020
Daily road traffic index: 100 = same traffic as the equivalent day of the week in the first week of February 2020, 1 March 2020 to 10 January 2022, non-seasonally adjusted, Great Britain
Embed code
Notes:
- The blue shaded areas refer to periods when restrictions across the UK were in effect.
Download the data
The daily DfT estimates are indexed to the first week of February 2020 and the comparison is with the same day of the week. The data provided are useful as an indication of traffic change rather than actual traffic volumes. More information on the methods, quality and economic analysis for these indicators can be found in the DfT methodology article.
Back to table of contents11. Value-added tax returns
New reporters
The new reporters index measures the number of firms sending value-added tax (VAT) returns for the first time, which is related to the number of firm creations.
Figure 13: The seasonally adjusted number of new VAT reporters in December 2021 was 18,950; this is lower than both December 2020 (22,740) and December 2019 (21,230)
Number of new firm reporters, January 2015 to December 2021, seasonally adjusted and non-seasonally adjusted, UK
Source: Her Majesty’s Revenue and Customs (HMRC)
Download this chart Figure 13: The seasonally adjusted number of new VAT reporters in December 2021 was 18,950; this is lower than both December 2020 (22,740) and December 2019 (21,230)
Image .csv .xlsThe seasonally adjusted number of new VAT reporters in the UK was 18,950 in December 2021, 5% lower than in November 2021. This is 9% lower than the 2015 to 2019 longer-term average (20,896).
The number of new reporters in the production and construction industries saw monthly falls of 14% and 13%, respectively. However, the number of new VAT reporters in the production industry was 20% lower than in December 2020, while in the construction industry this figure was broadly similar to December 2020.
In the services industry, there were 14,940 new VAT reporters in December 2021, a 5% decrease from the 15,790 reported in November 2021. This latest figure is 17% lower than reported in December 2020.
The figures explained in this section refer to seasonally adjusted data. Non-seasonally adjusted data are available in the accompanying dataset.
Business turnover estimates
Turnover diffusion indices are an aggregate measure used to track whether most firms are reporting an increase or decrease in turnover in their VAT returns. They are calculated as the percentage of firms with increasing turnover minus the percentage with decreasing turnover.
The heatmap in Figure 14 is a visual way of showing the VAT diffusion indices based on the standard deviation from their historical 2008 to 2019 average. Larger deviations are more darkly coloured, with red representing a negative change, while teal represents a positive change when compared with the previous period.
Figure 14: In Quarter 4 (Oct to Dec) 2021, a net 3% of firms reported an increase in turnover at the total industry level when compared with Quarter 3 (July to Sept) 2021
Heatmap of business turnover estimates, UK, diffusion index standard deviation from the mean, up to Quarter 4 (Oct to Dec) 2021 and November 2021. New reporters, UK, up to December 2021
Embed code
Source: Her Majesty’s Revenue and Customs (HMRC)
Notes:
- Agri - Agriculture, forestry and fishing, All - All industries, SA - Seasonally adjusted, NSA - Not seasonally adjusted.
- More information is available in the methodology article.
Download the data
In Quarter 4, a net 4% of firms in both the production and services industry reported increasing quarter-on-quarter turnover. This is the sixth consecutive quarter where more firms have reported increasing turnover than decreasing turnover in the production industry.
A net 2% of firms in the agriculture industry reported increasing turnover in Quarter 4. Meanwhile, in the latest quarter in the construction industry more firms have reported decreasing rather than increasing turnover (net negative 2%).
The all-industry turnover estimate for November 2021 shows that in the past month, more firms had reported increasing rather than decreasing turnover (net 3%).
A net 2% of firms in the construction industry reported increasing turnover in November 2021. This is the first time in 13 months (since October 2020) where more firms have reported increasing turnover than decreasing turnover.
A net 4% and 1% of firms in the services and agricultural industries, respectively, reported increasing turnover in November 2021. In the production industry, a net 7% of firms reported increasing turnover in the last month.
The figures explained in this section refer to seasonally adjusted data. Non-seasonally adjusted data are available in the accompanying dataset.
Back to table of contents12. Data
Traffic camera activity
Dataset | Released 13 January 2022
Experimental daily traffic camera counts data for busyness indices covering the UK.
System Average Price (SAP) of gas
Dataset | Released 13 January 2022
Daily and rolling average System Average Price (SAP) of gas traded in the UK.
UK spending on credit and debit cards
Dataset | Released 13 January 2022
Experimental indicator for monitoring UK retail purchases derived from the Bank of England's CHAPS data.
Online job advert estimates
Dataset | Released 13 January 2022
Experimental job advert indices covering the UK online job market.
Value Added Tax (VAT)
Dataset | Released 13 January 2022
Value Added Tax (VAT) turnover and expenditure diffusion indexes and new VAT reporters using data from HM Revenue and Customs (HMRC) VAT returns.
Company incorporations, voluntary dissolutions and compulsory dissolutions
Dataset | Released 13 January 2022
Weekly dataset showing the number of Companies House incorporations and voluntary dissolutions accepted, and companies placed into compulsory dissolution.
Users should note that this section lists a selection of the data available with this publication. For the full list of available datasets please see the accompanying dataset page.
Back to table of contents13. Glossary
Faster indicator
A faster indicator provides insights into economic activity using close-to-real-time big data, administrative data sources, rapid response surveys or Experimental Statistics, which represent useful economic and social concepts.
Company incorporations
Incorporations are when a company is added to the Companies House register of limited companies. This can also include where an existing business applies to become a limited company, where it was not one before.
Voluntary dissolution applications
A voluntary dissolution application is when a company applies to begin dissolution proceedings. As such, they effectively choose to be removed from the Companies House register. For a company to be eligible to voluntarily dissolve, it should not have completed any trading activity for a period of three months.
Compulsory dissolutions
When a company fails to file the required financial accounts and/or confirmation statements, if no contact is received by Companies House following a series of letters to the company and its officers, a first gazette notice is published in the Gazette, a notice of the Registrar's intention to dissolve the company.
Diffusion index
The diffusion index tracks the growth in turnover and expenditure of firms. It is constructed to lie between negative 1 and 1. For example, if 65% of firms have increasing turnover, 30% have decreasing turnover and 5% turnover remains unchanged, then the diffusion index is 0.35.
New reporter
A new reporter is defined as a firm with a value-added tax (VAT) reference (that is, firm identification number), which has not previously reported its VAT returns. New reporters are published within one month of the end of the reporting period. The new reporting behaviour measure is classified by the month the data were received by HM Revenue and Customs (HMRC), known as the receipt date; this is not necessarily the same as the reference period (the period for which the VAT return is made).
Back to table of contents14. Measuring the data
UK coronavirus restrictions
A full overview of coronavirus (COVID-19) restrictions for each of the four UK constituent countries can be found here:
These restrictions should be considered when interpreting the data featured throughout this bulletin.
Back to table of contents15. Strengths and limitations
Information on the strengths and limitations of the indicators in this bulletin is available in the Economic activity and social change in the UK, real-time indicators methodology.
Back to table of contents