1. Introduction
Many different approaches have been used to measure loneliness. These include both loneliness multi-item and single-item measures. Some measures ask about loneliness directly while others ask about emotions associated with loneliness, from which loneliness is inferred. There are advantages and disadvantages associated with each.
We undertook a programme of scoping work and consultation with experts on existing approaches to loneliness measurement. From this, two preliminary measures (both a direct and an indirect measure of loneliness) were selected as meeting many criteria we required for the loneliness indicators. However, before a final recommendation on the tools to be used to measure loneliness could be made, cognitive and survey testing of our preliminary recommended measures of loneliness was conducted. This was carried out to understand how they work for people of different ages and backgrounds and how well they perform on different types of surveys. The main findings from the cognitive testing have been reported in Cognitive testing of loneliness questions and response options. The main aim of the survey testing covered here was to fill knowledge gaps, particularly in relation to:
how well our preliminary recommended measures worked for people of different ages
whether they gave us useful information about different aspects of loneliness and therefore merit being used together on the same survey
whether responses may be affected by the order in which the questions are being asked, for example, using the indirect measure of loneliness before or after the direct measure
how long the questions took to ask and answer
This chapter outlines:
the questions and surveys that were used for testing
the specific aims of the testing for each survey
the statistical analysis used
the main findings from testing
our conclusions and recommendations
The findings in this chapter were used to inform our recommended national indicators and the guidance for measuring loneliness in national surveys.
Back to table of contents2. Overview of the surveys used for testing
We undertook question testing on two surveys, the Opinions and Lifestyle Survey and the Good Childhood Index Survey.
The Opinions and Lifestyle Survey (OPN) is an omnibus survey conducted by Office for National Statistics (ONS). Data are collected over the phone for UK residents aged 16 years and over. The survey is conducted over eight months of the year, and data are available two months later. The survey achieves a sample size of approximately 1,100 respondents each month. Alongside a variety of demographic variables, such as age, employment status and living situation, the survey frequently includes questions commissioned by outside parties. This flexibility, combined with the rapid fieldwork and data delivery, means that the survey is commonly used for question testing.
The UCLA scale and a direct question on loneliness were included on the OPN in July and August 2018. Both had a three-item response scale.
Two different orders (direct measure asked before the indirect measure and direct question asked after the indirect measure) were tested in both months, by randomly splitting the sample and creating two independent groups.
The Good Childhood Index Survey is run ad hoc (usually every few months) by The Children’s Society, and was first conducted in 2010. The survey typically achieves a sample of approximately 2,000 households, and collects data on children aged 10 to 17 years. Questions are answered at home, through an online survey. The survey collects information on children’s well-being, which is used to build The Children’s Society’s Good Childhood Index, and includes questions targeted towards the theme of the annual Good Childhood Reports.
The Children’s Society agreed to test the recommended children’s loneliness questions on Wave 17 of the survey. The wording of the recommended loneliness questions was modified to be simpler for children to understand. Data were collected during May and June of 2018.
The loneliness questions selected for testing have also been included on the English Longitudinal Study for Ageing (ELSA) for several years and the direct measure of loneliness has been used on the Community Life Survey (CLS) since 2014.
The ELSA is a longitudinal survey carried out every two years in England on residents aged 50 years and over. The achieved sample size is typically between 7,000 and 9,000 respondents. The first wave of data was collected in 2002 to 2003, and eight waves of data have been collected to date. Wave 8 data was collected in 2016 to 2017 and published in 2018. ELSA collects information on a variety of topics, including demographic variables such as age and retirement status, aspects of physical and mental health, household structure and relationships with family and friends.
As part of their assessment, ELSA includes questions on people’s loneliness. Respondents are asked both the direct question of loneliness and the UCLA three-item scale, both with three response options (Hardly ever or never, Some of the time, Often). The loneliness questions are answered via a self-completion questionnaire.
The Community Life Survey (CLS) is a major survey of adults aged 16 years and over in England, held annually and designed to track measures that are important to understanding society and local communities. It asks questions that cover volunteering, views about the local area, community cohesion and participation, and subjective well-being.
The questions are asked either face-to face or are completed online. Respondents are asked the direct question of loneliness with five response options (Often/Always, Some of the time, Occasionally, Hardly ever or Never).
These two established surveys were used for comparability as well as the plausibility of using the combined (direct and indirect) measure of loneliness. This analysis focuses on establishing the reliability of the UCLA scale in relation to the direct measure of loneliness, for both adults and children, as well as analysing order effects and the effect of important demographic variables on loneliness.
Back to table of contents3. Questions and response options tested
Table 1 presents the measures and response categories tested for each survey.
| Measures | Items | Response categories | Survey |
|---|---|---|---|
| The 3-item UCLA Loneliness scale | 1. How often do you feel that you lack companionship? 2. How often do you feel left out? 3. How often do you feel isolated from others? | 1. Hardly ever or never, Some of the time, Often 2. Hardly ever or never, Some of the time, Often 3. Hardly ever or never, Some of the time, Often | ELSA OPN |
| The 3-item UCLA Loneliness scale for children | 1. How often do you feel that you have no one to talk to? 2. How often do you feel left out? 3. How often do you feel alone? | 1. Hardly ever or never, Some of the time, Often 2. Hardly ever or never, Some of the time, Often 3. Hardly ever or never, Some of the time, Often | Good Childhood Index |
| The direct measure of loneliness | How often do you feel lonely? | Hardly ever or never, Some of the time, Often | ELSA OPN Good Childhood Index |
| Often/ Always, Some of the time, Occasionally, Hardly ever, Never | CLS |
Download this table Table 1: Questions and response options used on the surveys
.xls .csv4. Aims of the survey testing
Overall, testing on the survey responses was aimed to check the reliability and validity of using the preliminary recommended loneliness measures on national surveys. Simply put, high reliability means that the questions are measuring the same concepts consistently, and high validity means that the question are measuring what we expect them to be measuring. The reliability and validity should yield similar estimates across all surveys. Each individual survey was used to answer specific research questions as described in this section.
English Longitudinal Study of Ageing
To assess the relatedness of the University of California, Los Angeles (UCLA) scale and the direct measure of loneliness over a time series.
To assess how consistent the reliability and validity is over time for the direct measure and the UCLA scale.
To assess any effects of long-term limiting illness and sex on responses to the direct measure of loneliness and the UCLA scale.
Community Life Survey
To assess the effect of important demographics on responses to the direct measure of loneliness.
To compare the effect of important demographics on the direct measure of loneliness with the findings from the Opinions and Lifestyle Survey (OPN) and the English Longitudinal Study for Ageing (ELSA).
Opinions and Lifestyle Survey
To assess the relatedness of the UCLA scale and the single-item question and to compare the findings with the established ELSA.
To assess the effect of key demographics on responses to the direct measure of loneliness and the UCLA scale, and to compare the findings with the established CLS.
To assess the effect of question ordering on responses to the direct measure of loneliness and the UCLA scale.
Good Childhood Index Survey
To assess the relatedness of the children’s UCLA scale and the direct measure of loneliness.
To assess the reliability of the adapted wording of the children's UCLA scale.
To explore any differences in responses to the questions in children when compared with adults’ responses on other surveys.
To assess effect of age and sex on responses to the children’s UCLA scale and the direct measure of loneliness.
5. Methodology
Missing data and weighting
“Missing data” refers to incidences when respondents have either refused to answer the questions on loneliness or have answered “don’t know”. When missing data was found, listwise deletion was used, which means the entire response was excluded from analysis if any single value from the University of California, Los Angeles (UCLA) scale or direct measure of loneliness was unanswered. This is because if, for example, a respondent had not answered the direct measure of loneliness but had answered the UCLA, the case could not be used in the analysis comparing the two.
Weights were included in the descriptive analysis to compensate for unequal selection probabilities and differential non-response. Weights were not used when statistical tests were run as the software used could not account for them correctly (for example, in the calculation of the degrees of freedom in a chi-Square test).
Presentation of the UCLA scores
In reporting the findings from the analysis, we used the UCLA questions for adults and children as intended by the developers of the scale – that is, by assigning a score to each response and creating a total score by summing the individual scores.
For example:
"Hardly ever or never" equals 1
"Some of the time" equals 2
"Often" equals 3
The lowest possible combined score on the loneliness scale is 3 (indicating less frequent loneliness) and the highest is 9 (indicating more frequent loneliness). There is no standard accepted score above which a person would be considered lonely, so no threshold for loneliness was used in interpreting the analyses.
Statistical tests
To check the reliability and validity of the proposed loneliness measures, we used a number of different statistical tests, which are detailed in this section.
A p-value of less than 0.05 was taken as significant, as is reported in the statistics in the following section. This means that the test is showing a statistically significant result, and association between two variables is greater than would be expected by chance.
Pearson’s chi square of association was used to see whether there was any association among selected variables. A chi-square test compares the observed frequencies with those you would expect to get by chance if there were no association. This test is used on categorical or ordinal data. Cramer’s V was used as a follow-up test, as it tells us the strength of the association and therefore which factors have the greatest influence and the strongest relationships. The X2 value is reported, as is standard when reporting the chi-square test, as well as the degrees of freedom, number of cases analysed (N) and the p value. For Cramer’s V, a coefficient is reported, which can be interpreted similarly to a correlation coefficient. The closer the coefficient is to 1.00, the stronger the relationship between the variables is. Direction or causality cannot be expressed using a chi square.
A Goodman-Kruskal correlation was used to check how well the UCLA scores were associated with the direct measure of loneliness. This particular correlation test was used because the data are ordinal, that is, the data represent categories that make sense in a certain order, as opposed to numbers on a scale. The correlation coefficient (G) has been reported in the findings; if the number is closer to 1.00 then the correlation is high and the variables are closely related, whereas if it is closer to 0.00 then there is little to no correlation.
Cronbach’s alpha was used to assess the internal reliability of the children’s UCLA scale. Internal reliability is the degree to which questions in a scale can be said to measure the same concept; in this case it was used to check whether each UCLA question is measuring the same concept. This test is commonly used, and it measures how closely related a set of responses are as a group. The alpha coefficient is reported, which once again can be interpreted similarly to a correlation coefficient: high internal reliability is denoted with an alpha much closer to 1.00.
Back to table of contents6. Main findings from the survey testing
English Longitudinal Study for Ageing
The analysis used waves 4 to 8 of the English Longitudinal Study for Ageing (ELSA) data, unless otherwise stated. When using the Opinions and Lifestyle Survey (OPN), a sub-sample of those aged 50 years and over was analysed to ensure it was comparable to ELSA. Descriptive statistics, such as the percentage of people who responded in a particular way, were run on wave 8 and cross-sectional weights were used. The latest methodology on the waves and weights (PDF, 382.8KB) is available. For details of the full OPN sample, please see Table 3.
Frequency of loneliness
Around two-thirds of respondents reported "Hardly ever or never" feeling lonely, that is, 69.0% of respondents on ELSA and 65.0% on OPN. The difference in those reporting often feeling lonely was even smaller when comparing the ELSA and OPN, at 6.8% and 6.3%, respectively (Figure 1). Respondents also reported similar scores in response to the UCLA scale (Figure 2).
The similarity between frequencies when comparing the OPN to the ELSA suggest that the OPN has measured the same concept of loneliness. The differences might be due to mode effects (the mode in which the survey is administered such as telephone or face-to-face interview). However, without more rigorous testing and analysis of the different modes used, it is difficult to say whether this definitively accounts for the differences in proportions reporting frequent and less frequent loneliness.
Figure 1: Reported frequency of loneliness for the direct measure
ELSA and OPN

Source: Office for National Statistics: English Longitudinal Study of Ageing (ELSA); Opinions and Lifestyle Survey (OPN)
Notes:
- ELSA data is from wave 8 (2016 to 2017).
- OPN data is July to August 2018.
- 95% confidence intervals are displayed on the chart.
Download this image Figure 1: Reported frequency of loneliness for the direct measure
.png (8.4 kB) .xlsx (11.4 kB)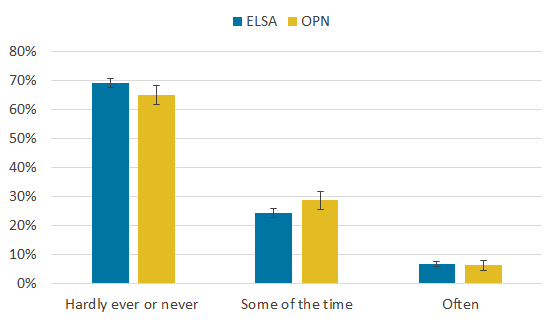
Figure 2: Reported frequency of loneliness on the UCLA scale for wave 8 of the English Longitudinal Study for Ageing and the Opinions and Lifestyle Survey
ELSA and OPN

Source: English Longitudinal Study of Ageing (2016-2017) and Opinions and Lifestyle Survey (2018)
Notes:
- ELSA data is from wave 8 (2016 to 2017).
- OPN data is July to August 2018.
- 95% confidence intervals are displayed on the chart.
Download this image Figure 2: Reported frequency of loneliness on the UCLA scale for wave 8 of the English Longitudinal Study for Ageing and the Opinions and Lifestyle Survey
.png (7.6 kB) .xlsx (10.6 kB)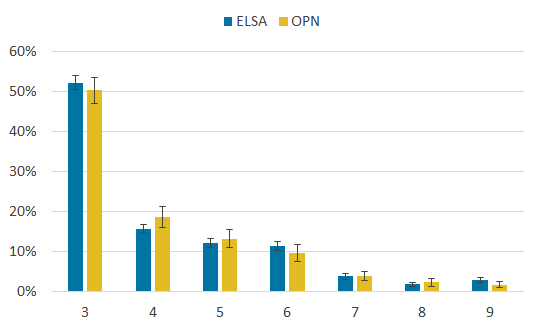
UCLA compared with direct measure of loneliness
For each wave of the ELSA data, both the UCLA and the responses to the direct measure of loneliness showed strongly significant positive correlations (G = 0.875-0.888, p<.000). This indicates that if a person scored highly in one measure, they also tended to score highly in the other (that is, if a person rated themselves as lonely on the UCLA items they would also rate themselves as lonely on the direct measure of loneliness).
Using ELSA data from wave 8, a Cronbach’s alpha test on the three questions comprising the UCLA scale showed high internal validity, with an alpha coefficient of 0.824.
These coefficients from the correlations and validity tests can be used as a “benchmark” for testing the OPN data. As the correlation scores for the ELSA ranged from 0.875 to 0.888, we would expect the OPN to have correlations in a similar region, and also for the internal consistency of the UCLA to have a similar alpha coefficient.
Demographics and loneliness
A chi-square test was used to see if sex and long-term illness or disability (independently) affected responses to the direct measure of loneliness and the UCLA scale, as has been found in previous testing. Sex was significantly associated with both items; females were more likely than males to say they often felt lonely compared with hardly ever or never feeling lonely (direct measure: X2 (2, N = 3117) = 48.388, p<.000, compared with UCLA: X2 (6, N = 3065) = 23.784, p<.005).
Reporting having a disability or long-term limiting illness was also significantly associated with different answers on the direct measure of loneliness and UCLA (direct measure: X2 (2, N = 3116) = 53.230, p<.000, compared with UCLA: X2 (6, N = 3064) = 73.195, p<.000); odds ratios suggest respondents are more likely to respond “Often” on the direct measure of loneliness if they report having a disability or long-term illness than if they do not.
Community Life Survey
In April 2018, we reported the factors most associated with loneliness in the article, Loneliness – What characteristics and circumstances are associated with feeling lonely?. The analysis was carried out using data from the 2016 to 2017 Community Life Survey (CLS) and identified a number of demographics associated with loneliness, such as sex, employment, marital status and age. These factors were also analysed here as part of the testing programme using OPN data to see if findings would be consistent. The analysis previously published on the CLS was carried out using a five-item response scale for the direct measure of loneliness (see Table 1). No analysis was possible for the UCLA scale as it was not used on the CLS survey. The statistical test used with the OPN data (a chi-square) was run using the CLS data to compare the results.
Demographics and loneliness
The variables tested were all found to have a significant relationship with the direct measure of loneliness, and are presented in Table 2. Some of the demographic variables presented on the CLS were not categorised in a similar way to the OPN or the questions were asked differently and therefore were not comparable. For example, employment had different categories on the CLS compared with OPN, in that the OPN did not have those defined as economically inactive.
The findings suggest that responses to the direct measure of loneliness are significantly associated with individual characteristics such as sex and age and show the same patterns of association across the two surveys. Although the effects sizes are small, tenure has the strongest relationship.
| Variable | Categories | Chi-square statistic | Effect size1 |
|---|---|---|---|
| Tenure | Owner Renter | X2 (4, N = 8997) = 338.527, p <0.000 | 0.194 |
| Marital status | Single Married/civil partnership Divorced/separated Widowed | X2 (12, N = 9781) = 813.782, p <0.000 | 0.167 |
| Health (self-reported) | Very good Good Fair Bad Very bad | X2 (16, N = 7336) = 545.705, p <0.000 | 0.136 |
| Sex | Male Female | X2 (4, N = 9969) = 173.457, p <0.000 | 0.132 |
| Age group | 16 to 24 25 to 34 35 to 44 45 to 54 55 to 64 65 to 74 75 and over | X2 (24, N = 9695) = 241.587, p <0.000 | 0.079 |
Download this table Table 2: Factors significantly associated with direct measures of loneliness on the Community Life Survey, 2016 to 2017
.xls .csvOpinions and Lifestyle Survey
Over the two months during which the questions were tested, the OPN combined sample size was 2,208 persons. The weighted demographic composition of the total sample is shown in Table 3.
| 16 to 24 | 25 to 44 | 45 to 54 | 55 to 64 | 65 to 74 | 75 and over | Total | |
|---|---|---|---|---|---|---|---|
| Male | 14.2% | 32.6% | 17.1% | 14.9% | 12.2% | 8.9% | 48.9% |
| Female | 13.6% | 31.0% | 17.0% | 14.9% | 12.6% | 11.0% | 51.1% |
| Total | 13.9% | 31.8% | 17.1% | 14.9% | 12.4% | 9.9% | 100.0% |
Download this table Table 3: Weighted counts and proportions by age and sex of the Opinions and Lifestyle Survey testing, July and August 2018
.xls .csvFrequency of loneliness
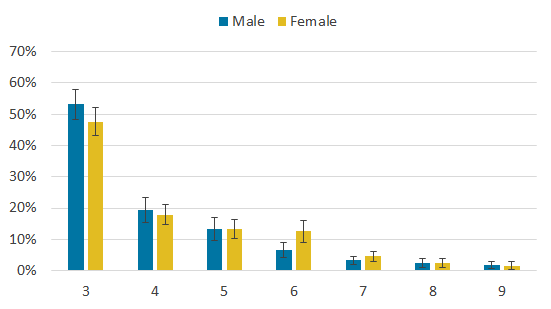
As shown in Figure 3, nearly two-thirds (65.0%) of respondents to the OPN survey reported that they hardly ever or never felt lonely in response to the direct question on loneliness.
This compares with half of respondents who had the lowest score on the UCLA scale (50.3%), meaning that they answered hardly ever or never to all three UCLA questions (Figure 4). This suggests that OPN respondents were more likely to report that they were never or hardly ever lonely when asked directly than when asked indirectly using the UCLA scale. This is also consistent with findings from other studies, such as ELSA.
Figure 3: Reported frequency of loneliness for the direct measure
OPN
Source: Office for National Statistics, Opinions and Lifestyle Survey (OPN)
Notes:
- July to August 2018.
- 95% confidence intervals are displayed on the chart.
Download this chart Figure 3: Reported frequency of loneliness for the direct measure
Image .csv .xls
Figure 4: Reported frequency of loneliness for each score of the UCLA
OPN
Source: Office for National Statistics, Opinions and Lifestyle Survey (OPN)
Notes:
- July to August 2018.
- 95% confidence intervals are displayed on the chart.
- UCLA refers to the University of California, Los Angeles measure of loneliness.
Download this chart Figure 4: Reported frequency of loneliness for each score of the UCLA
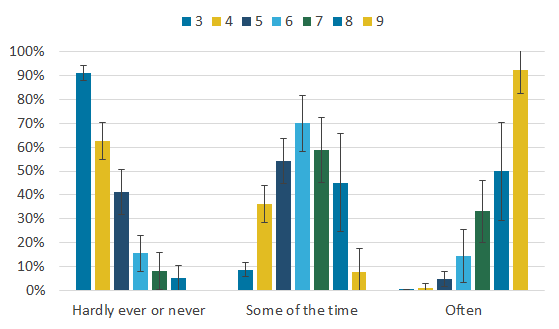
Image .csv .xlsAs would be expected, people who scored hardly ever or never on the direct measure of loneliness also scored lower on the UCLA scale, and the other way around, with those answering some of the time on the direct measure most frequently scoring 6 on the UCLA (Figure 5).
Figure 5: Reported frequency of loneliness for each score of the UCLA
OPN
Source: Office for National Statistics
Notes:
- July to August 2018.
- 95% confidence intervals are displayed on the chart.
- UCLA refers to the University of California, Los Angeles measure of loneliness.
Download this image Figure 5: Reported frequency of loneliness for each score of the UCLA
.png (14.0 kB) .xlsx (10.7 kB)
Direct question of loneliness compared with UCLA scale
There was a significant strong positive correlation between UCLA scores and the responses to the direct measure of loneliness (G=.844, p<.000). That is, if a person scored highly in one measure, they were likely to score highly in the other measure. This suggests that the measures are related and both are capturing aspects of loneliness. This result is similar to the correlation coefficients produced for each wave of the ELSA data. Although the measures are related and move in similar directions, people appear to under-report loneliness on the direct measure compared with the indirect measure (UCLA). This is shown by the fact that people more frequently reported that they were "Hardly ever or never" lonely to the direct question than reported having the lowest loneliness to the indirect question.
The UCLA scale items also had fairly high internal consistency, with a Cronbach’s alpha of 0.76, although this is lower than the alpha coefficient found using the ELSA data. Further investigation is needed to determine why the internal consistency of the UCLA scale is lower on the OPN than ELSA. Possible reasons are a difference in understanding of the UCLA by people of different ages, with the OPN sample having a wider age range than ELSA, or the fact that the ELSA is self-completed and the OPN is carried out via phone interview.
Demographics and loneliness
Chi-square tests were conducted on the OPN data to explore whether there were similar associations between loneliness and demographics, such as sex and age, as those found in the CLS analysis. A significant association was found between the direct measure of loneliness and sex, X2 (2, N = 2203) = 28.6, p<.000, and the association between UCLA and sex was also found to be significant, X2 (6, N = 2189) = 17.3, p<.05.
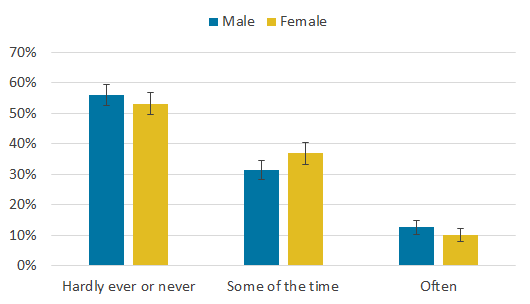
This indicates that there is a significant difference in males and females, on both the direct measure of loneliness and the UCLA scale. Women report higher levels of loneliness, which appears to be most sensitive on the middle categories (that is, “Some of the time” on the direct measure of loneliness and around score 6 on the UCLA scale), which is shown in Figures 6 and 7.
Figure 6: Reported frequency of loneliness for the direct measure, by sex
OPN

Source: Office for National Statistics, Opinions and Lifestyle Survey (OPN)
Notes:
- July to August 2018.
- 95% confidence intervals are displayed on the chart.
Download this image Figure 6: Reported frequency of loneliness for the direct measure, by sex
.png (8.5 kB) .xlsx (11.3 kB)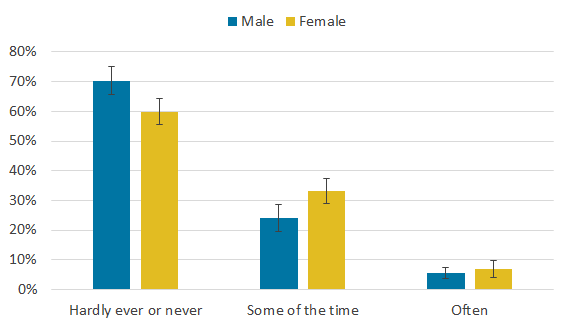
Figure 7: Reported frequency of loneliness on the UCLA scale, by sex
OPN
Source: Office for National Statistics, Opinions and Lifestyle Survey (OPN)
Notes:
- When using the UCLA scale, men and women reported no significant difference in levels of loneliness.
- UCLA refers to the University of California, Los Angeles measure of loneliness.
Download this image Figure 7: Reported frequency of loneliness on the UCLA scale, by sex
.png (7.1 kB) .xlsx (10.5 kB)
OPN data were also analysed to see if we would find the same significant associations with loneliness as identified using the CLS data (Table 4). It was not possible to replicate all the analysis reported for the CLS data due to differences in the questions asked on the surveys (see OPN section).
| Variable | Categories | Chi-square statistic | Effect size1 |
|---|---|---|---|
| Marital status | Single Married/civil partnership Divorced/separated Widowed | X2 (6, N = 2203) = 196.11, p<.000 | 0.211 |
| Health (self-reported) | Very good Good Fair Bad Very bad | X2 (8, N = 2196) = 125.37, p<.000 | 0.169 |
| Tenure | Owner Renter | X2 (2, N = 2159) = 49.95, p <.000 | 0.152 |
| Sex | Male Female | X2 (2, N = 2203) = 28.55, p<.000 | 0.114 |
| Age group | 16 to 24 25 to 34 35 to 44 45 to 54 55 to 64 65 to 74 75 and over | X2 (12, N = 2203) = 38.77, p<.005 | 0.089 |
Download this table Table 4: Factors significantly associated with the direct measure of loneliness, Opinions and Lifestyle Survey
.xls .csv
| Variable | Categories | Chi-square statistic | Effect size1 |
|---|---|---|---|
| Marital status | Single Married/civil partnership Divorced/separated Widowed | X2 (18, N = 2189) = 180.79, p<.000 | 0.166 |
| Health (self-reported) | Very good Good Fair Bad Very bad | X2 (24, N = 2185) = 186.73, p<.000 | 0.146 |
| Tenure | Owner Renter | X2 (6, N = 2146) = 97.66, p<.000 | 0.213 |
| Sex | Male Female | X2 (6, N = 2189) = 17.28, p<.01 | 0.089 |
| Age group | 16 to 24 25 to 34 35 to 44 45 to 54 55 to 64 65 to 74 75 and over | X2 (36, N = 2189) = 52.94, p<.05 | 0.063 |
Download this table Table 5: Factors significantly associated with the UCLA scale, Opinions and Lifestyle Survey
.xls .csvOrder effects
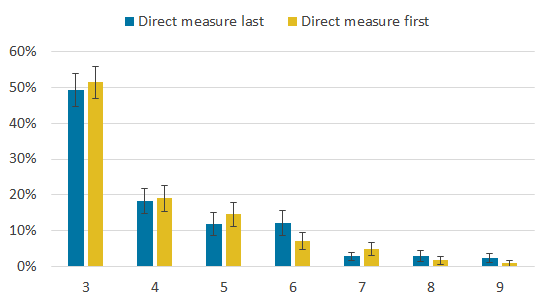
Chi-square tests of association were conducted to explore whether people responded differently to the questions depending the order in which they were presented. A significant association was found between UCLA and order (X2 (2, N = 2189) = 17.1, p<.01), however, no significant association was found between the direct measure of loneliness and question order (X2 (2, N = 2203) = 1.78, p=0.41). This suggests that the order in which the questions are presented to respondents affects their responses to the indirect questions on loneliness (the UCLA scale) but does not affect their responses to the direct question on loneliness.
Figure 8: Reported frequency of loneliness for each score of the UCLA, by order of questioning
OPN
Source: Office for National Statistics, Opinions and Lifestyle Survey (OPN)
Notes:
- July to August 2018.
- 95% confidence intervals are displayed on the chart.
- UCLA refers to the University of California, Los Angeles measure of loneliness.
Download this image Figure 8: Reported frequency of loneliness for each score of the UCLA, by order of questioning
.png (7.8 kB) .xlsx (10.5 kB)
Although the association between order and UCLA score was found to be significant, Figure 8 shows that order did not affect the UCLA uniformly. The difference in UCLA score was only seen in certain score ranges. In this case, respondents who scored 6 were most affected by order change. This indicates that those who experience very high or very low levels of loneliness are not affected by the difference between direct and indirect language, however, those who may experience more moderate degrees of loneliness will be impacted by order. In other words, the direct language of the single item appears to impact those who experience moderate degrees of loneliness, making them more likely to change their responses. Because of this, it is recommended that the direct measure of loneliness follows the UCLA, unless it is used alone; this is consistent with established surveys such as the ELSA.
Question debriefing with OPN interviewers
The OPN telephone interviewers were de-briefed about their experiences of asking the questions in a telephone interview. The following are main points raised by the interviewers:
many interviewers described a little apprehension about asking these questions before the testing had begun but were surprised at how easily and well they were received
the questions did not seem to cause upset among respondents
no one refused to answer the questions or stopped answering part way through
the questions did not take long to ask and answer (they estimated about two minutes in total including the preamble)
interviewers believed the questions were answered honestly, that respondents thought about their answer before answering, and they attributed this in part to the use of a word rather than numerical response scale
they thought a broadly worded introduction (not mentioning loneliness) should be recommended with the questions as this helps to inform respondents about what is coming and helps make the questions flow
they felt it was helpful that the loneliness questions followed the personal well-being questions on this survey, as it created a useful flow and suggested that putting the loneliness questions with health-related questions would also work well
Good Childhood Index Survey
The analysis carried out on the OPN was also run on the data available for children aged 10 to 15 years. As there has been comparatively less research into children’s loneliness using the direct measure of loneliness and the UCLA scale, we conducted more descriptive analysis on these data to establish a fuller picture of how children respond to these measures. The Children’s Society survey asks respondents their gender, while the other surveys analysed here have included the respondent’s sex. To aid comparisons, and because of small sample sizes for children identifying as transgender, the analysis here only includes those who identified as the same sex assigned at birth.
Frequency of loneliness
When asked how frequently they felt lonely using the direct question, 11.3% of children reported that they felt lonely often, while 54.6% of children reported that they hardly ever or never felt lonely (Figure 9). While adults seem to most frequently score 3 on the UCLA scale with a consistent decline in the proportion of respondents receiving each higher score, the pattern is a bit different for children. While they also most frequently score 3, there is another peak in the proportion of respondents scoring in the middle of the scale, as shown in Figure 10.
Figure 9: Reported frequency of loneliness for the direct measure
Good Childhood Index, ages 10 to 15
Source: The Children's Society, Good Childhood Index Survey
Notes:
- May to June 2018.
- 95% confidence intervals are displayed on the chart.
Download this chart Figure 9: Reported frequency of loneliness for the direct measure
Image .csv .xls
Figure 10: Reported frequency of loneliness for each score of the UCLA
Good Childhood Index, ages 10 to 15
Source: The Children's Society, Good Childhood Index Survey
Notes:
- May to June 2018.
- 95% confidence intervals are displayed on the chart.
- UCLA refers to the University of California, Los Angeles measure of loneliness.
Download this chart Figure 10: Reported frequency of loneliness for each score of the UCLA
Image .csv .xlsUCLA compared with direct question of loneliness
As found for the other surveys, there was a strong, positive relationship between answers to the direct measure of loneliness and the UCLA scores (G = 0.877, p < 0.00). It can therefore be concluded that the direct measure and the UCLA scale are strongly related in children as well as in adults. Finally, the Cronbach’s alpha test produced an alpha statistic of 0.846, indicating a high level of internal consistency within the adapted version on the UCLA scale for children.
Demographics and loneliness
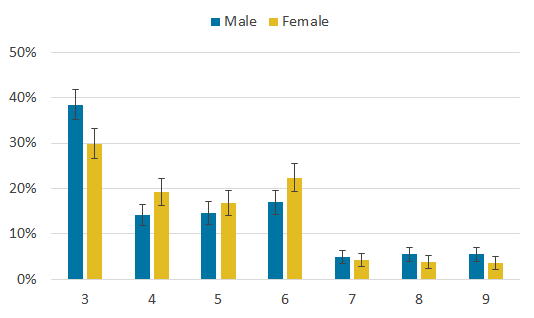
The relationship between the direct measure of loneliness and sex was assessed using a chi-square test of association. This found a significant association between sex and responses to the single-item question (= x2 (2, N=1538) = 7.2356, p<.05). The relationship between sex and the UCLA scale was assessed in the same manner, and again found a significant association (=x2 (6, N=1537) = 27.256, p <.000). Despite these significant results, further testing found that Cramer’s V was 0.069 for the direct measure of loneliness and 0.133 for the UCLA scale, indicating a very weak association between sex and responses.
Figures 11 and 12 show the responses to the direct question of loneliness and the UCLA scale by sex. Both the direct measure and the UCLA scale showed that girls were less likely to report extreme values than boys, with girls’ answers more likely to cluster around the middle scores of the direct question of loneliness and the UCLA scale.
Figure 11: Reported frequency of loneliness for the direct measure, by sex
Good Childhood Index, ages 10 to 15
Source: The Children's Society, Good Childhood Index Survey
Notes:
- May to June 2018.
- 95% confidence intervals are displayed on the chart.
Download this image Figure 11: Reported frequency of loneliness for the direct measure, by sex
.png (8.3 kB) .xlsx (10.4 kB)
Figure 12: Reported frequency of loneliness for each score of the UCLA, by sex
Good Childhood Index, ages 10 to 15
Source: The Children's Society, Good Childhood Index Survey
Notes:
- May to June 2018.
- 95% confidence intervals are displayed on the chart.
- UCLA refers to the University of California, Los Angeles measure of loneliness.
Download this image Figure 12: Reported frequency of loneliness for each score of the UCLA, by sex
.png (7.8 kB) .xlsx (10.5 kB)
Further chi-square tests were conducted to assess the relationship between age and both the direct question of loneliness and the UCLA scale. The test was conducted using age groups of 10 to 12 and 13 to 15 years. Testing found that age was significantly related to responses to the direct question of loneliness (= x2 (2, N=1538) = 12.964, p <.000). Cramer’s V was 0.092, indicating a very weak effect between age and responses to the direct question. A significant relationship was also identified between age and responses to the UCLA scale (= x2 (6, N=1537) = 38.988, p <.000, with a Cramer’s V coefficient of 0.159, indicating a weak association between age and the UCLA scale.
Figures 13 and 14 show the responses to the direct measure question and the UCLA scale by age group. Younger children (aged 10 to 12 years) were more likely than older children (aged 13 to 15 years) to report that they often felt lonely on the direct measure of loneliness, or to report a high UCLA score.
Figure 13: Reported frequency of loneliness for the direct measure, by age groups
Good Childhood Index

Source: The Children's Society, Good Childhood Index Survey
Download this image Figure 13: Reported frequency of loneliness for the direct measure, by age groups
.png (8.5 kB)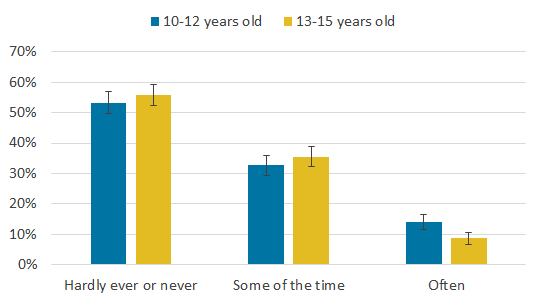
Figure 14: Reported frequency of loneliness for each score of the UCLA, by age groups
Good Childhood Index
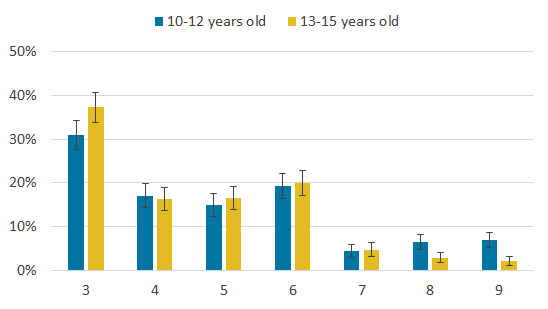
Source: The Children's Society, Good Childhood Index Survey
Notes:
- May to June 2018.
- 95% confidence intervals are displayed on the chart.
- UCLA refers to the University of California, Los Angeles measure of loneliness.
Download this image Figure 14: Reported frequency of loneliness for each score of the UCLA, by age groups
.png (8.1 kB) .xlsx (10.5 kB)
7. Conclusions
Many different approaches have been used to measure loneliness, including both multi-item scales and direct measures. There is also a variety of different approaches to survey administration are in use among the surveys that currently include the questions. Through our survey testing, we aimed to understand how our preliminary recommended measures of loneliness worked for people of different ages and backgrounds and how well they performed on different types of surveys.
Overall, when comparing responses to loneliness questions on surveys like ELSA, the Community Life Survey, and the Opinions Survey, the findings are consistent and relationships identified between loneliness and other factors are also similar. It is encouraging that the UCLA scale used on ELSA produces comparable findings when used on surveys covering a wider age range and performed well in tests of reliability and validity. The adapted version of the UCLA scale for use with children also performed well in similar testing. We suggest that this combination of indirect and direct measures of loneliness is therefore suitable for use on major studies.
There is a strong positive association between the UCLA scale and the direct measure of loneliness, with those who report feeling lonely on one often reporting feeling lonely on the other as well.
Assessment of the UCLA scale’s internal consistency shows that it is high across all surveys tested. This indicates that the questions within the UCLA scale are measuring the concept of loneliness and that it is a reliable measure of loneliness when used on young people and adults, as well as in its adapted version for children.
The importance of question order comes into play in cases where both measures are included. A significant order effect was found, with responses to the UCLA scale affected if preceded by the direct question of loneliness. The direct question is not sensitive to order effects with the UCLA scale.
Opinions and Lifestyle Survey (OPN) interviewers described a little apprehension about asking the loneliness questions before the testing had begun but were surprised at how easily and well the questions were received. The questions did not seem to cause upset among respondents. Also, the questions did not take long to ask and answer.
Recommendations based on the findings
We suggest the use of both direct and indirect measures of loneliness as the “gold standard” where possible. This enables us to measure responses on a scale that has been assessed as valid and reliable, as well as allowing the respondent to say for themselves whether they feel lonely, providing further insight into the subjective feeling of loneliness for different people. Also, there is variation in how people understand the term “loneliness” and some people might be reluctant to admit to loneliness, and this might be particularly true of certain groups. A multi-item measure that does not mention loneliness directly can be helpful to address these issues. The recommended measures are well-tested, and have a positive track record for performing well in general population surveys using different approaches to data collection.
Although the combination of a direct and an indirect measure provides a more holistic picture of loneliness, where it is not possible to use all four questions as survey space is a major constraint, we would recommend at a minimum the use of the direct question to measure prevalence of loneliness.
Question order is important for comparability between surveys, as findings seem to indicate that asking the direct question of loneliness first impacts responses to the UCLA, within mid-level categories. For this reason, it is recommended that the direct question of loneliness follows the UCLA questions. The three UCLA questions should be kept together and in the order in which they are presented in Table 1 to ensure comparability of the findings with other surveys.
An adapted version of the UCLA questions should be used for children. The findings in this section show that this version is as reliable and valid as the general version for adults, and measures feelings of loneliness in those aged 10 to 15 years well. More substantive findings on the understanding of the UCLA questions among children can be found in Cognitive testing of loneliness questions and response options.
Interviewers noted that specifically mentioning “loneliness” rather than “relationships” in the introduction could have an effect on respondents’ answers. Overall, it is recommended that the introduction or preamble should not mention loneliness and should introduce the topic as focusing on the participant’s relationships with others.
Back to table of contentsContact details for this Compendium
qualityoflife@ons.gov.uk
Telephone: +44 (0)1633 651830