Table of contents
- The proportion of people aged 65 and over: projected to rise to 20% or above of the total population in all but one region by 2024
- The changing balance between age groups: the 65 and over age group is projected to grow more than 5 times as fast as the working age population
- The changing composition of the oldest population age group: an increase in the share of the very old
- Life expectancy: higher for females, but grows faster for males
1. The proportion of people aged 65 and over: projected to rise to 20% or above of the total population in all but one region by 2024
Not all geographic areas will be equally affected by an increase in the number of people aged 65 and over. The region with the largest percentage of this age group is projected to be the South West where the proportion is projected to grow from 21.1% to 23.8% (Table 1.1). The South West is projected to account for nearly a third of all local authorities where more than a quarter of residents are aged 65 and over.
Table 1.1: Change in the proportion of people aged 65 and over in English regions between 2014 and 2024
| Proportion of age 65+ in 2014 (%) | Proportion of age 65+ in 2024 (%) | |
|---|---|---|
| England | 17.6 | 19.7 |
| South West | 21.1 | 23.8 |
| North East | 18.8 | 21.7 |
| East Midlands | 18.5 | 21.2 |
| East | 19 | 21.2 |
| South East | 18.6 | 21 |
| North West | 18 | 20.3 |
| Yorkshire and The Humber | 17.9 | 20.2 |
| West Midlands | 18 | 20 |
| London | 11.5 | 12.5 |
| Source: Office for National Statistics | ||
Download this table Table 1.1: Change in the proportion of people aged 65 and over in English regions between 2014 and 2024
.xls (27.1 kB)The only region with a significantly lower proportion of those 65 and over, London, is projected to grow by 1 percentage point, from 11.5 % to 12.5% by mid-2024. In relative terms, however, London is projected to be the fastest-growing region for this age group – 23.6% growth is projected over the 10-year period to mid-2024 (see Figure 1.1).
Map 1.1 shows the projected change in the percentage of population aged 65 and over in local authorities between 2014 and 2024. Coastal local authorities are projected to be most affected by an increase in the proportion of the oldest population group over the 10-year period. An interactive version of these maps shows both the proportion of the older population and rates of change projected for 10 years between 2014 and 2024.
Map 1.1: Proportion of the population aged 65 and over in 2014 and 2024, England

Source: Office for National Statistics
Download this image Map 1.1: Proportion of the population aged 65 and over in 2014 and 2024, England
.png (316.8 kB) .xls (42.0 kB)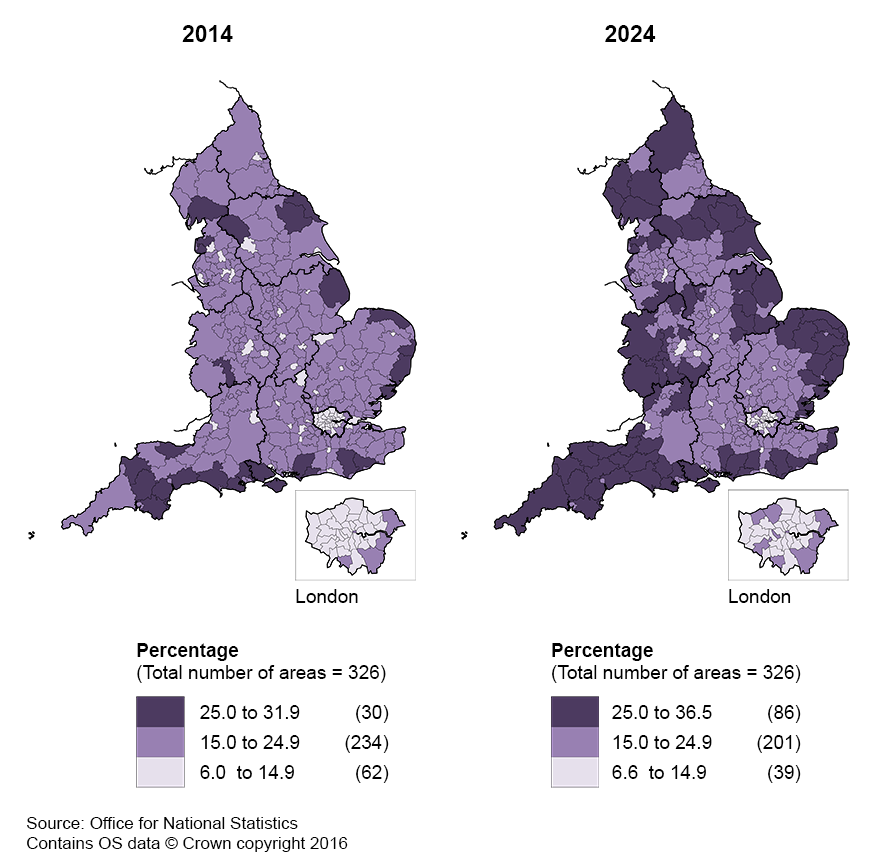
2. The changing balance between age groups: the 65 and over age group is projected to grow more than 5 times as fast as the working age population
On average the working age population group is projected to grow by 3.6% in England over the 10-year period to mid-2024. The 65 and over age group is projected to grow by 20.4% over the same period. A regional growth breakdown by age groups is available in Figure 1.1.
Figure 1.1: Percentage population change by age groups in English regions between 2014 and 2024
Source: Office for National Statistics
Download this chart Figure 1.1: Percentage population change by age groups in English regions between 2014 and 2024
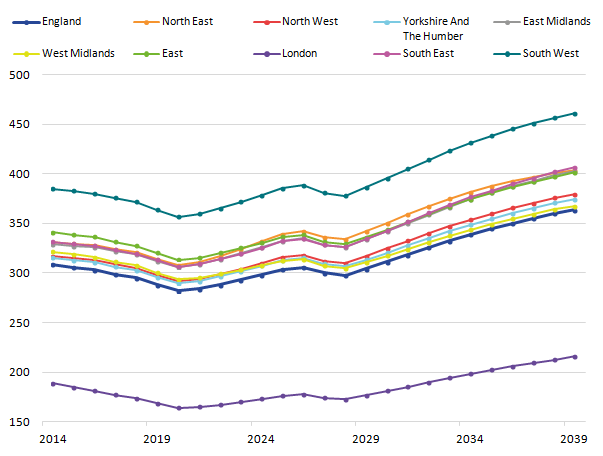
Image .csv .xlsA growth in the proportion of those aged 65 and over normally leads to an increase in the old-age dependency ratio1 (OADR) in the absence of mitigating policy factors. Under the Pensions Act 2014 the retirement age will gradually rise both for men and women2. This measure is projected to stabilise and even reverse the OADR from around 309 to 298 between 2014 and 2024. However, due to a rapid continuing growth of the population of pensionable age accompanied by a shrinking proportion of the working age population the old-age dependency ratio is projected to increase to 364 by 2039. Not all geographic regions will be affected to the same extent: the most affected is projected to be the South West, and the least affected London. The projected regional variation in the OADR is presented in Figure 1.2. A dataset detailing the projected OADR at the local authority level is available for download.
Figure 1.2: Projected change in old age dependency ratio by English regions, 2014 to 2039
Source: Office for National Statistics
Download this image Figure 1.2: Projected change in old age dependency ratio by English regions, 2014 to 2039
.png (29.1 kB) .xls (20.5 kB)
Notes for The changing balance between age groups:
The old-age dependency ratio is a measure of the number of pension age individuals per 1000 working age individuals.
Under the Pension Act 2014 the state pension age (SPA) will change from 65 years for men and 61 years for women to 65 years for both sexes between 2012 and 2018. Then between December 2018 and October 2020 SPA will change from 65 years to 66 both for men and women. Between 2026 and 2046, the state pension age will increase in two stages from 66 to 68 years for both sexes. The OADR calculations are informed by the increase in the state pension age and utilise Table of State Pension Age Factors Pensions Act 2014.
3. The changing composition of the oldest population age group: an increase in the share of the very old
Table 1.2 and Figure 1.3 summarise changes projected to occur within the oldest age population group: the middle three age groups are projected to remain more or less stable. It is the 65 to 69 age group and the 85+ age group that are subject to the greatest change: the former is projected to shrink by 8.6 percentage points and the latter is projected to expand its share by 6.5 percentage points over the next 25 years.
Table 1.2: Projected distribution within the oldest age group (65 and over) between 2014 and 2039, England
| 2014 (%) | 2024 (%) | 2039 (%) | |
|---|---|---|---|
| 65 to 69 | 31.2 | 26.1 | 22.6 |
| 70 to 74 | 22.9 | 22.9 | 22.7 |
| 75 to 79 | 18.7 | 21.9 | 19.9 |
| 80 to 84 | 13.8 | 14.3 | 14.9 |
| 85 and over | 13.4 | 14.8 | 19.9 |
| Total | 100 | 100 | 100 |
| Source: Office for National Statistics | |||
| Notes: | |||
| 1. Figures may not sum due to rounding. | |||
Download this table Table 1.2: Projected distribution within the oldest age group (65 and over) between 2014 and 2039, England
.xls (18.4 kB)
Figure 1.3: Projected increase in the share of people aged 85 and over within the oldest age group in England between 2014 and 2039
Source: Office for National Statistics
Notes:
- Figures may not sum due to rounding.
Download this chart Figure 1.3: Projected increase in the share of people aged 85 and over within the oldest age group in England between 2014 and 2039
Image .csv .xls4. Life expectancy: higher for females, but grows faster for males
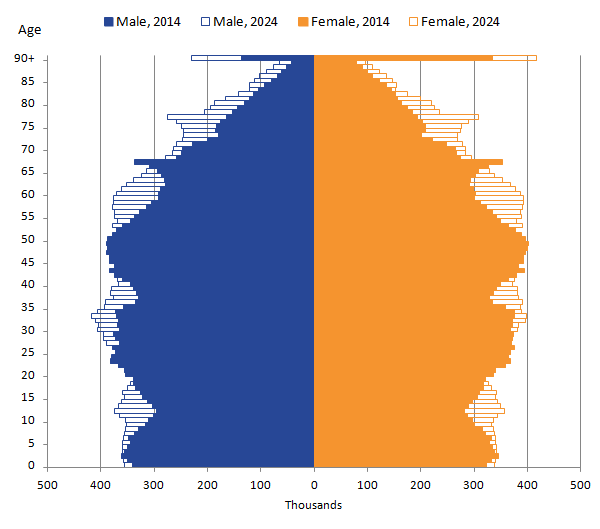
The sex distribution within the age group 65 and over is also projected to change over time. In this age group women tend to outnumber men due to a higher life expectancy. This is particularly visible for those 90 and over in Figure 1.4.
Figure 1.4: Projected change in population age and sex structure in England between 2014 and 2024
Source: Office for National Statistics
Download this image Figure 1.4: Projected change in population age and sex structure in England between 2014 and 2024
.png (13.9 kB) .xls (31.7 kB)
Although in absolute terms there will continue to be more women than men in the oldest age group over the projected period of 25 years, the older male population is projected to expand faster – by 64.4% to mid-2039, compared to 54.9% for females over the same period. This faster expansion is associated with increasing life expectancy of the older men. The annual growth rate is projected to be greater for the population of older males in the first years of projections with differences in growth rates narrowing down in subsequent years (Figure 1.5).