1. Introduction

National population projections by age and sex are produced for the UK and constituent countries every 2 years. These sets of projections are based on a review of the underlying assumptions regarding fertility, mortality and migration.

The primary purpose of the projections is to provide an estimate of future population which is used as a common framework for national planning in a number of different fields. The main focus of the 2014-based projections is on the next 25 years up to 2039, though longer-term projections to 2114 are also produced. Population projections become increasingly uncertain the further they are carried forward and particularly so for smaller geographical areas and age-sex breakdowns. In addition to the principal (main) projections, variant projections are also available, based on alternative assumptions of future fertility, mortality and migration. For more information on how our projections meet users’ needs along with information on their fitness for purpose, please see the report on quality and methodology (290.9 Kb Pdf) on our website.

The 2014-based projections replace the 2012-based projections published on 6 November 2013.

The projections were produced by the Office of National Statistics (ONS) on behalf of the National Statistician and the Registrars General of Scotland and Northern Ireland. The underlying assumptions were agreed in liaison with the devolved administrations – Welsh Government, National Records of Scotland (NRS) and Northern Ireland Statistics and Research Agency (NISRA) – following consultation with main users of projections in each country and advice from an expert academic advisory panel.

We have been responsible for the production of the official national population projections for the UK and its constituent countries since 31 January 2006. Prior to this, the responsibility lay with the Government Actuary’s Department (GAD).

This report contains background information for the 2014-based national population projections. Included are sections on:

  • defining the base population

  • the method of projections

  • the availability of projections

  • background on principal and variants projections

  • summary of the long-term assumptions of future levels of fertility, mortality and migration

  • changes to the state pension age

  • national population projections expert advisory panel

Back to table of contents

2. Base population

Definition

The projections are based on estimates of the resident population of the UK and its constituent countries at mid-2014. The population includes all usually resident persons, whatever their nationality. Members of HM Armed Forces in the UK are included, but members of HM Armed Forces and their families who are abroad are excluded. Members of foreign armed forces in the UK are included, with any accompanying dependants.

Base populations for individual countries

The projections for England and Wales are based on the mid-2014 population estimates that we published on 25 June 2015. The projections for Scotland are based on the mid-2014 population estimates published by NRS on 30 April 2015 and likewise the projections for Northern Ireland are based on the mid-2014 estimates published by NISRA on 4 June 2015. These estimates are based on the results from the 2011 Census.

In October 2015, National Records of Scotland (NRS) announced small errors in the mid-year population estimates for areas in Scotland. Whilst these errors do not affect the total population of Scotland, or other parts of the UK, they do have a small effect on the age and sex distribution of the population. The impact of these errors is much smaller than the uncertainty around the estimates due to sampling error from the Census. NRS will publish corrected MYEs in April 2016.

The 2014-based NPP are based on the original release of the Scottish MYE in April 2015 and thus do not reflect the correction to the MYE for Scotland used as the base population for the projection. The errors will also have a small effect on the projected age distribution of cross-border migration flows from Scotland to England and Wales. These effects are very small compared to other sources of uncertainty in the projections.

Estimates of the population aged 90 and over

Official mid-year population estimates produced by ONS, NRS and NISRA are prepared by individual age to the age of 89, with an upper age band for all those aged 90 and over. Estimates of the population aged 90 to 104 by single year of age and for the 105 and over age group are prepared using the Kannisto Thatcher survivor ratio method, with the results controlled to agree with the official estimates of all those aged 90 and over.

Back to table of contents

3. Method of projection

The projections are made for successive years running from one mid-year to the next. For each age the starting population, taking into account net migration less the number of deaths, produces the number in the population, one year older, at the end of the year. To this has to be added survivors of those born during the year. Age is defined as completed years at the last birthday.

Migration is assumed to occur evenly throughout the year. For computing purposes, this is equivalent to assuming that half the migrants in a given year at a given age migrate at the beginning of the year and half at the end of the year. The number of net migrants to be added to obtain the population aged x+1 at the end of the projection year therefore consists of half of those migrating during the year at age x and half of those migrating during the year at age x+1.

The number of deaths in a year is obtained by adding half of the net inward migrants at each age to the number in the population at the beginning of the year and applying the mortality rate qx. The mortality rates used in the projections represent the probabilities of death between one mid-year and the next, according to a person's age last birthday at the beginning of the period. The appropriate rate of "infant mortality", that is, the probability of a new-born child not surviving until the following mid-year is also given. This is about 85% of the full, first year of life infant mortality rate used in official statistics.

The number of births in the year is calculated by multiplying the average number of women at each single year of age during the year (taken as the mean of the populations at that age at the beginning and end of the year) by the fertility rate applicable to them during that year. The total number of births in a year is assumed to be divided between the sexes in the ratio of 105 males to 100 females, in line with recent experience. The number of infants aged 0 at the end of the year is calculated by taking the projected number of births, deducting the number of deaths found by applying the infant mortality rate and adding half the number of net migrants aged 0 last birthday.

The principal projections are computed for each of the constituent countries of the UK and the results are added together to produce projections for England and Wales, Great Britain and the UK.

The assumptions have been set using rates based on a consistent series of population estimates which reflects the results of the 2011 Census.

Back to table of contents

4. Available projections

For the 2014-based projections, principal projections data have been published up to 100 years ahead for the UK, Great Britain, England and Wales and each of the constituent countries.

Variant projections have been published up to 25 years ahead for the UK and each of the constituent countries. The low migration, high migration and zero net migration (natural change only) variants have also been published for Great Britain.

Data for each country or variant combination have been published in 2 summary tables and 1 zipped open data file.

Summary table 1 contains the total projected population for all years of the projections, the components of change and other summary statistics.

Summary table 2 contains the projected population in 5 year age groups for all years of the projection.

The XML open data files contain:

  • population by single year of age (0 to 104), age groups (105 to 109, 110 and over) and sex

  • fertility assumptions by single year of age (15 to 46)

  • mortality assumptions by single year of age (0 to 125) and sex

  • cross border rates for each country flow by single year of age (0 to 125) and sex

  • births by age of mother (15 to 46)

  • deaths by age (0 to 105 and over) and sex

  • in, out and net cross border migration by age (0 to 105 and over) and sex

  • in, out and net international migration by age (0 to 105 and over) and sex

  • in, out and net total migration by single year of age (0 to 105 and over) and sex

The long-term figures should be treated with great caution. Population projections become increasingly uncertain the further they are carried forward and particularly so for smaller geographic areas and age-sex breakdowns.

Variant projections beyond the published 25 years and for alternative national geographic levels are available on request.

Back to table of contents

5. Principal and variant projections

Background

The principal population projections provide a consistent starting point for all government planning which is affected by the numbers in the population. They are based on assumptions considered to be the best that could be made at the time they are adopted. However, due to the inherent uncertainty of demographic behaviour, any set of projections will inevitably be proved wrong, to a greater or lesser extent, as a forecast of future demographic events or population structure. To give users of the projections an indication of this uncertainty and to explore alternative scenarios, a number of variant population projections have also been produced, based on alternative assumptions of future fertility, mortality and migration.

Variants available from the 2014-based projections

In addition to the principal assumptions, high and low variant assumptions have been prepared for each of the 3 components of demographic change: fertility, life expectancy and migration. These variant assumptions are intended as plausible alternatives to the principal assumptions and do not represent upper or lower limits for future demographic behaviour.

Aside from the principal projection, 9 standard variant projections are presented here. These are the 6 possible "single component" variants (that is, varying only 1 component at a time from the principal assumptions); 2 ‘combination’ variants: those produce the largest or smallest total population size, and 1 special case scenario of zero net migration (also known as natural change only). Seven further variant projections will be released on 26 November 2015, see Tables 1.2 and 1.3.

The variants allow users to explore a range of different possible future demographic situations. For example, the high and low migration variants for the UK provide alternative plausible scenarios for long-term net international migration at 80,000 above and below the principal net migration assumption, respectively. The low variant therefore assumes net migration of 105,000 per year, while the high variant assumes net migration of 265,000 per year.

In addition to high and low variants for the fertility, mortality and migration assumptions, other scenarios include "no change", which assumes that fertility and mortality rates will remain constant at current levels and "zero net migration", which allows the effects of the projected trends in fertility and mortality to be examined independently of the effects of migration.

List of available variants

The 2014-based variant population projections are based on the categories of assumptions shown in Table 1.2.

From these categories of assumptions, the variant projections released on 29 October 2015 have been created as shown in Table 1.3.

The 2014-based projections for the UK projection have been calculated as the sum of the projections for the 4 individual countries (England, Wales, Scotland and Northern Ireland). Therefore, the projected population numbers, deaths at each age, and births at each age of mother for the UK are just the sum of those for the 4 individual countries. The "assumed" UK fertility and mortality rates are then "back-calculated" from these projected births, deaths and population numbers.

Previously some of the UK variant projections were "non-additive", that is, they were not calculated as the sum of those for the 4 individual countries. This change has been introduced partly as a result of the introduction of a new cross-border migration methodology and partly to meet a user requirement for variant projections for Great Britain.

Back to table of contents

6. Summary of long-term assumptions

The new principal projections are based on the long-term assumptions of future fertility, mortality and net migration (that is, immigrants minus emigrants) and are summarised in Table 1.4. These have been agreed in consultation with NISRA, NRS and the Welsh Government. Comparisons are given with the assumptions made for the previous 2012-based projections.

For the UK, the long-term assumption of average completed family size is 1.89 children per woman, the same as in the 2012-based projections. More information can be found in the fertility assumptions section of the release.

Assumptions on improvements in mortality are unchanged from the 2012-based projections. More information can be found in the mortality assumptions section of the release.

The new long-term assumption for net migration to the UK is +185,000 each year compared with +165,000 a year in the 2012-based projections. More information can be found in the migration assumptions section of the release.

Back to table of contents

7. Changing state pension age

Pensionable ages for men and women

Full details about the current and planned changes to state pension ages under the Pensions Acts of 1995, 2007, 2011 and 2014 can be found in Appendix C.

Between 2010 and 2020, state pension age will change from 65 years for men and 60 years for women, to 66 years for both sexes:

  • any woman born before 6 April 1950 will attain pensionable age when she reaches the age of 60

  • for women born between 6 April 1950 and 5 December 1953, the date that pensionable age will be attained can be found in changing the pension age table 1.5

  • for men and women born between 6 December 1953 and 5 October 1954, the date that pensionable age will be attained can be found in changing the pension age table 1.6

State Pension Age will then increase to 67 years for both men and women between 2026 and 2028:

  • any person born after 5 October 1954 but before 6 April 1960 will attain pensionable age when he or she reaches the age of 66

  • for persons born between 6 April 1960 and 5 March 1961 will reach their State Pension age at 66 years and the specified number of months that is shown in changing the pension age table 1.7

  • any person born after 5 March 1961 but before 6 April 1977 will attain pension age when he or she reaches the age of 67

  • for persons born between 6 April 1977 and 5 April 1978, the date that pensionable age will be attained can be found in changing the pension age table 1.8

  • any person born after 5 April 1978 will attain pensionable age when he or she attains the age of 68

Sources: Pensions Act 1995 Chapter 26 Part II Section 126 and Schedule 4; Pensions Act 2007 Chapter 22 Part I Section 13 and Schedule 3; Pensions Act 2011 Part 1 Section 1 and Schedule 1; Pensions Act 2014 Part 3 Section 26 and Section 27.

The data presented in this bulletin do not reflect proposed further changes to the state pension age published by the government. They propose bringing forward the increase to state pension age to 68 by the mid-2030s and 69 by the late 2040s. These proposed changes are not yet law and still require the approval of Parliament. Further information relating to these proposals can be found on the GOV.UK website.

Calculation of populations of working age and pensionable age for national population projections

Populations of working age and the pensionable age for national population projections are calculated in the following ways:

  • from 2014 to 2020, the number of women aged 60 to 65 who are of pensionable age is calculated using changing the pension age table 1.9

  • from 2014 to 2018, all men aged 60 to 64 are of working age and all men aged 65 to 70 are of pensionable age. From 2019 to 2020, the number of men aged 65 who are of pensionable age is calculated using changing the pension age table 1.10

  • similarly, from 2021 to 2025, all persons aged 66 and over are of pensionable age. From 2028 to 2043, all persons aged 66 are of working age and all persons aged 67 and over are of pensionable age. From 2026 to 2027, the number of men and women aged 66 who are of pensionable age is calculated using changing the pension age table 1.11

  • from 2046 onwards, all persons aged 68 and over are of pensionable age and all persons aged 67 are of working age. From 2044 to 2045, the number of men and women aged 67 who are of pensionable age is calculated using changing the pension age table 1.12

Back to table of contents

8. National Population Projections expert advisory panel

An expert academic panel advises ONS early on in the assumptions-setting process on current and emerging demographic trends and their possible implications for the national population projections. This panel met in 2015 to advise on the assumptions for 2014-based population projections.

The membership of the panel for the 2014-based national population projections was as follows:

  • Professor Ann Berrington, University of Southampton

  • Ben Corr, Greater London Authority

  • Professor Peter Goldblatt, University College, London

  • Professor Carol Jagger, Newcastle University

  • Doctor Nik Lomax, University of Leeds

  • Professor Mike Murphy, London School of Economics

  • Professor John Salt, University College London

  • Professor Ludi Simpson, University of Manchester

  • Doctor Chris Wilson, University of Oxford

Panel meeting

A note of the panel meeting held on 9 April 2015 is available in Appendix A.

Questionnaire

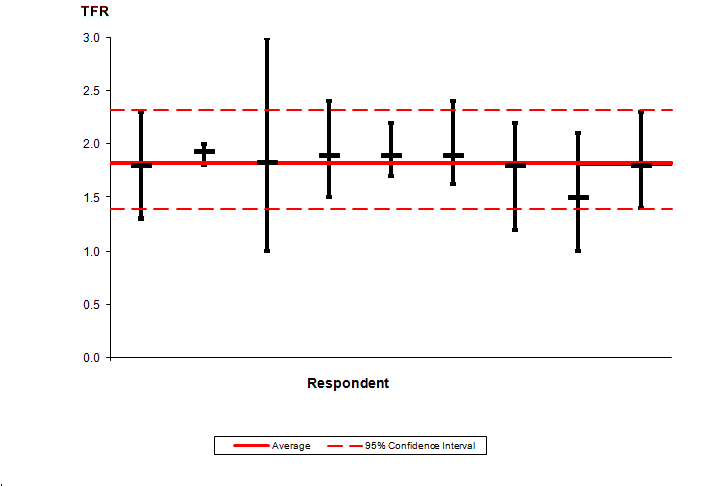
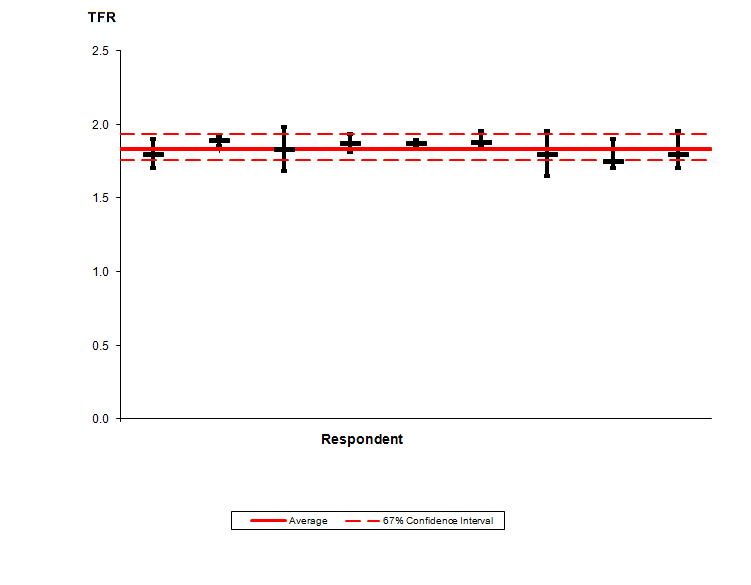
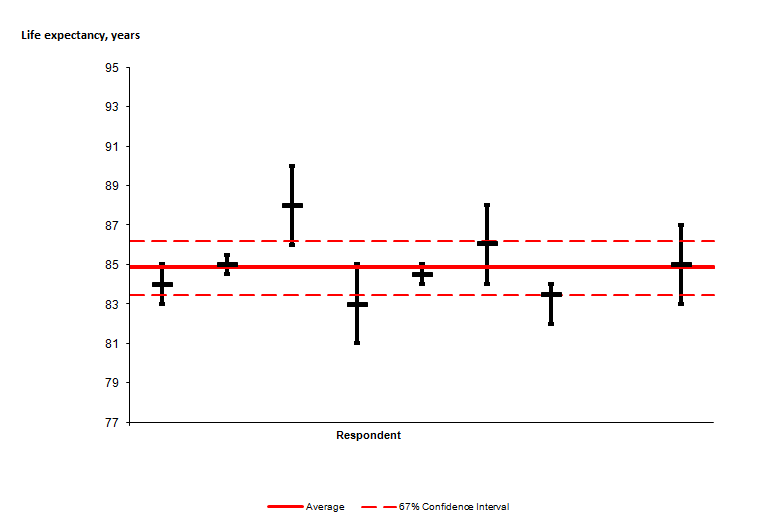
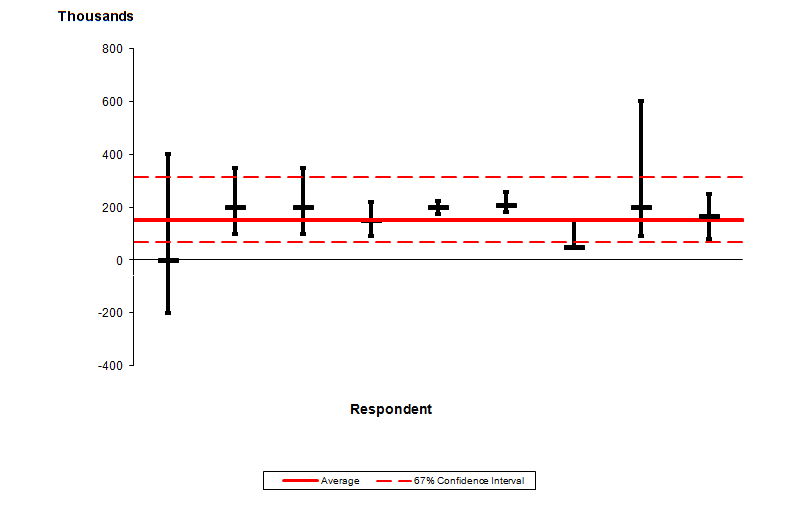
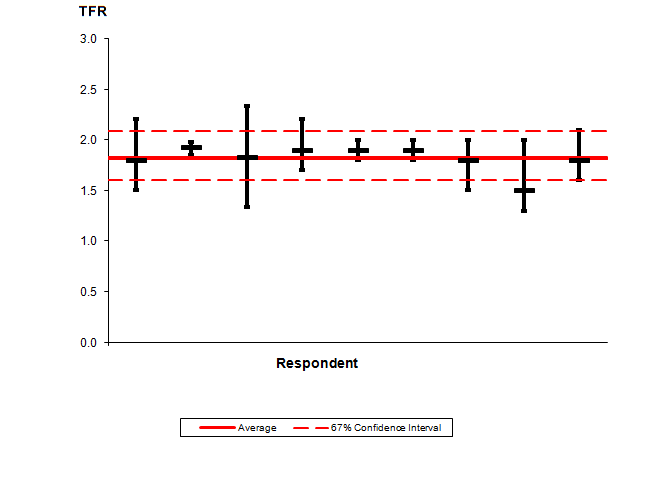
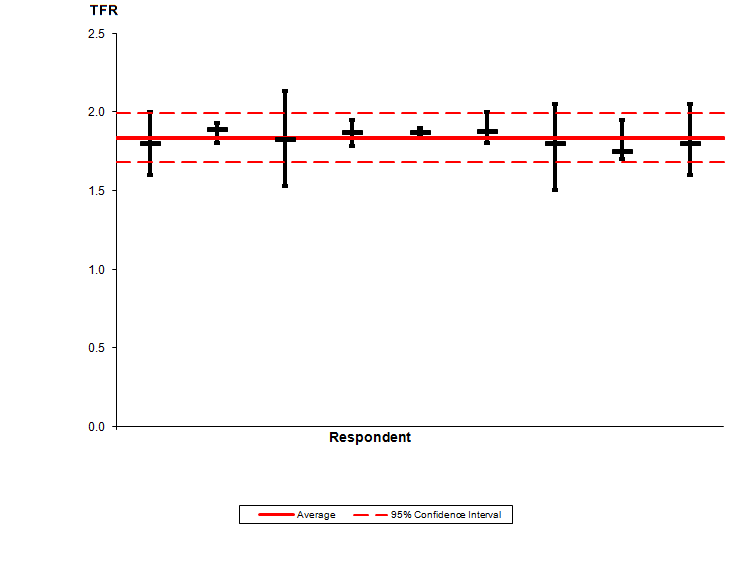
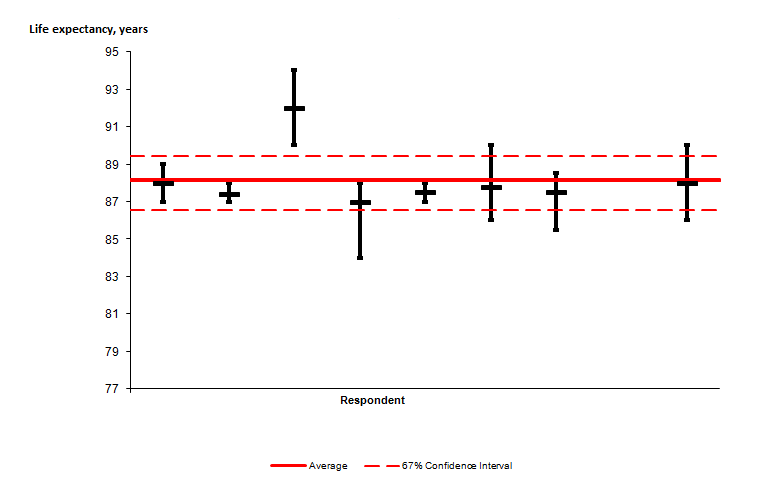
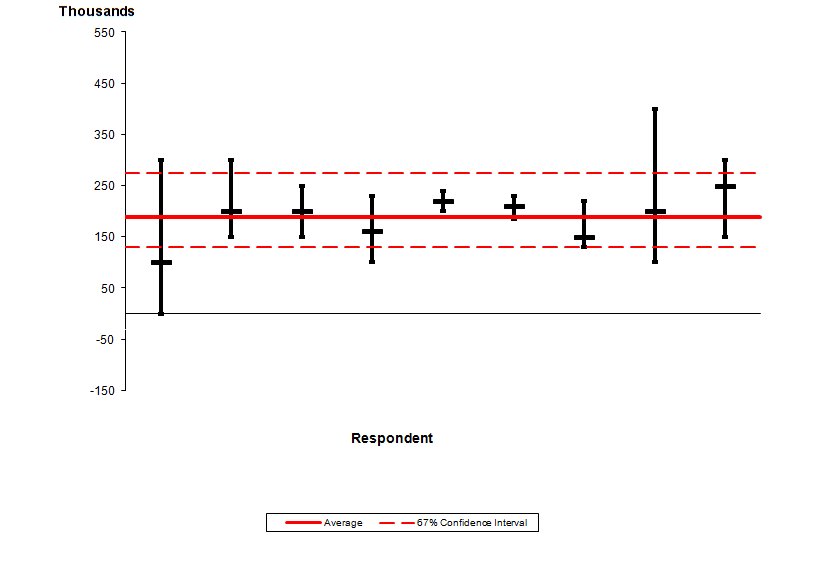
The panel completed a questionnaire where they were asked what they thought were the most likely future levels of fertility, life expectancy and migration. They were also asked for their views on the validity and importance of a wide range of arguments which might be thought likely to influence future trends. The questionnaire was originally devised by the International Institute for Applied Systems Analysis (IIASA) in Vienna and has been adapted by us for use in the UK. It is reviewed for each projection round to ensure that the experts’ views on current and emerging trends are collected.

Details of the panel’s views on the most likely levels of the total fertility rate, life expectancy at birth and total net migration to the UK (and associated 67% and 95% confidence intervals) in the years 2018 and 2038 can be found in Appendix B.

Back to table of contents

.Background notes

  1. Details of the policy governing the release of new data are available by visiting www.statisticsauthority.gov.uk/assessment/code-of-practice/index.html or from the Media Relations Office email: media.relations@ons.gov.uk

    These National Statistics are produced to high professional standards and released according to the arrangements approved by the UK Statistics Authority.

Back to table of contents

.Appendix A: Minutes of expert panel

2014-based National Population Projections (NPP)

Expert Advisory Panel Meeting

Room 060C, Skempton Building, Imperial College London, South Kensington Campus, London, SW7 2AZ

Thursday 9th April 2015, 10:30-15:00

Expert group

Prof. Ann Berrington, University of Southampton
Ben Corr, Greater London Authority
Prof. Peter Goldblatt, University College, London
Prof. Carol Jagger, Newcastle University
Dr Nik Lomax, University of Leeds
Prof. Mike Murphy, London School of Economics
Prof. John Salt, University College, London
Prof. Ludi Simpson, University of Manchester
Dr Chris Wilson, University of Oxford

ONS Population Statistics Division attendees

Oliver Dormon, Demographic Analysis Unit
Suzie Dunsmith, Population Projections Unit
Adrian Gallop, Demographic Analysis Unit and Government Actuary’s Department
Paula Guy, Population Projections Unit (Secretary)
Jay Lindop, Deputy Director Population Statistics Division (Chair)
Julie Mills, Demographic Analysis Unit

Observers

Kirsty Maclachlan, National Records Scotland (audio link)
Luke Main, National Records Scotland (audio link)
Jos Ijpelaar, Northern Ireland Statistics and Research Agency (audio link)
Paul Vickers, ONS (audio link)

Apologies:

None

1. Introduction

1.1 Jay welcomed everyone to the meeting and thanked members for agreeing to be part of the 2014-based NPP expert advisory panel. The main aim of the meeting is to have an informed discussion about the long-term assumptions for the forthcoming UK-level population projections.

1.2 The role of the expert panel is strictly advisory. It was emphasised that ONS was not seeking a consensus where none exists and wanted to hear the full range of views on the key assumptions. Though all opinions would be considered, the final decision on the assumptions to be adopted for the next set of projections rests with the NPP committee which includes representatives from ONS and the devolved administrations.

1.3 The 2014-based population projections are scheduled for publication in October/November 2015.

1.4 Jay explained that ONS would give introductory presentations on each of the three sets of assumptions – fertility, mortality and migration, after which the floor would be open for general discussion.

2. Fertility

Introduction

2.1 Oliver Dormon’s presentation began by reviewing the recent trends in period fertility including a comparison of the UK Total Fertility Rates (TFRs) with the TFRs for the 2010-based and 2012-based projections. Up to 2012 there had been a period of fairly stable TFRs so in the 2012-based projections this stability was assumed to continue into the future. However, there was an observed unexpected dip in the TFR in 2013 which was reflected in all 4 countries of the UK.

2.2 Oliver looked at the trends over time in the TFRs for the 4 constituent countries. The TFRs for England and Wales were very similar over this time period. Northern Ireland remained consistently higher than England and Wales, but has also been broadly stable since 2009. Scotland remained consistently below England and Wales, and has shown consistent decreases since the 2008 peak.

2.3 Trends in fertility rates for specific age groups were examined. It was noted that in 2013 there was a sharp decline in the age specific fertility rate (ASFR) for the 30-34 and younger age groups. The ASFR for those aged 35-39 was slightly lower in 2013 compared with 2012 but in the 40+ age group it was higher.

2.4 Oliver then presented the recent trends in cohort fertility. The completed family size (CFS) has declined gradually since the 1945 cohort. The most recent cohort to have completed fertility is the 1968 cohort who had 1.92 children on average, levels very similar to the 1965 cohort.

2.5 Looking at the fertility of the most recent cohorts relative to the 1968 cohort, Oliver explained that recent cohorts have experienced higher fertility in their teenage years but lower fertility in their early twenties than the 1968 cohort but they are partially catching up in their late twenties and thirties. The 1990 and 1995 cohorts have to date shown lower levels of fertility than the 1975-1985 cohorts but it remains to be seen whether this is due to postponement or if rates will remain at lower levels.

2.6 Oliver shared a graph focussing on the parity component of the TFR. This showed that there have been increases in births since 2001 of all orders. However first births have increased the most in terms of absolute contribution to the TFR. The graph also showed that the drop in the 2013 TFR was mainly due to a reduction in the number of first births.

2.7 Oliver summarised the key findings from the expert panel questionnaire responses. Experts’ UK TFR estimates for 2038 ranged from 1.5 to 1.93, with an average of 1.82. This is broadly in line with the latest figure of 1.83. It was noted that at the expert panel meeting prior to the 2012-based projections the experts’ average was 1.93. Based on the most recent data at that time, a TFR of 1.89 was adopted, an increase from the 1.85 TFR used in previous projections rounds. For 2018, there was a strong level of consensus with estimates ranging from 1.75 to 1.89, with an average of 1.83.

2.8 In terms of the experts’ responses to questions regarding the forces and impacts of fertility, the majority of experts agreed that changes in population composition and differential trends in population subgroups and changing bio-medical conditions would result in a rise in fertility. There was some disagreement regarding the impact that the trend in ideal family size and (the strength of) individual desires for children would have. The majority of experts agreed that changes in trends in patterns of education and work (including the proportion of time dedicated to the professional side of life) would result in a reduction in fertility. There was agreement that trends in income (including indirect income such as free childcare hours) and the changing nature and stability of partnerships, for example the rise of cohabiting parents, would have no overall impact.

Discussion

2.9 Panel members suggested that education enrolment or age at leaving education and whether this is set to continue might be a better predictor of future fertility.

2.10 In response to a question regarding to what extent the 2013 figure should be taken into account, there was general agreement that the data for one year cannot be considered a change in trend. Focus should be given to the longer term trend.

2.11 One member suggested that looking at trends since 1938 would be a better time frame as stability has been seen over that period. 30 years is a short time period. To consider variation a time period of relevance should be selected. Fertility was 1.8 in the 1930s and there has been below replacement fertility for 70 years.

2.12 Mention was made of the potential for anticipatory effects bringing forward births which is contrary to what is expected.

2.13 One member suggested that considering the UK as part of a suite of countries would result in more stable estimates, with different factors being taken into account for the 5 and 25 year estimates.

2.14 It was noted that the UN uses modelling for their projections, borrowing strength from neighbouring countries. Confidence intervals are produced automatically using this approach.

2.15 It was suggested that the focus should be on completed family size as these converge quite closely in comparison to the TFRs which are dependent on when people time their births. However, it was noted that the stability in completed family size hides a number of different trends such as childlessness for the higher educated being compensated by those of lower education. Comparability with other countries is not always possible. For instance, in Sweden those with higher education do catch up with their counterparts.

2.16 One member suggested there is benefit in choosing a figure for the future which is plausible rather than based on time series. Another expert would prefer an arithmetic calculation based on time series with expert input regarding what the relevant time series should be.

2.17 There was a discussion around whether the concept of cohorts is still relevant as mothers from overseas do not necessarily remain in the UK. Oliver confirmed that 26% of births are to non-UK born women and presented graphs showing a comparison of TFRs between UK and non-UK born women. It was noted that non-UK born women are not a heterogeneous group with some sub-groups having historically high fertility whilst others have low fertility rates. It was suggested that the year of entry to the UK should be taken into consideration.

2.18 There was a brief discussion around data quality. Oliver described the work undertaken by ONS regarding the misreporting of first births. Data from the Longitudinal Study was compared with registrations information. Analysis showed that 1 in 8 people were incorrectly reporting that this was not their first birth. There was also an implausible number of sixteen year olds reporting that they already have another child. Oliver has been working closely with the relevant registration organisations regarding how questions are asked and how answers are recorded. This will hopefully lead to an improvement in the quality of future years data.

2.19 There was a discussion regarding setting assumptions for the short and long term. It was noted that the two are separate with a different set of criteria to apply in the long term. There is an immediacy in the short term. Children born now will have an impact on future fertility rates. Environmental factors, immigration controls and the rates and characteristics of immigrants will all have an effect in the long term. Consideration needs to be given to what factors will change behaviours.

2.20 The regional variation in fertility rates was mentioned. It was noted that there was a drop in age specific fertility after the financial drop for Scotland, Spain, Italy and Greece. A similar trend was not observed in England. Scotland showed a distinct drop for those aged 20-34 but there was no explanation for this.

2.21 For the long term there was support for keeping the rates the same. The cohort of interest covers a stable period. If rates are changed there is a weight of responsibility which cannot hold. It was recognised that in the absence of a more sophisticated projections model, it is better to keep things simple and aim for plausibility.

2.22 Reference was made to a paper by David Coleman that notes there are various reasons as to why it is logical to have two children.

2.23 It was noted that there are aspects for which there is slightly more certainty. For instance, there is no reason to believe teenage pregnancies will increase. In the response to the questionnaire there was also consensus amongst the experts that births to women over 40 will continue to increase.

3. Mortality

Introduction

3.1 Julie Mills started the presentation by reviewing past trends in mortality. There was a slow increase in period life expectancy at birth for England and Wales at the end of the 19th century, followed by faster increases in the first half of the 20th century and a slow increase again from 1950 onwards.

3.2 The gap between male and female life expectancy at birth peaked at around 6 years in the late 1960s but figures have converged since then with life expectancy of birth in 2013 of 79.3 for males and 83.0 for females in England and Wales, a gap of 3.7 years.

3.3 Life expectancy at age 65 was relatively stable until the first half of the 20th century after which female life expectancy began to rise. Male life expectancy at age 65 is now increasing faster than for females, so the gender gap is closing. Julie explained that this is possibly due to differences in smoking patterns between males and females and the fact that men now undertake less physical work. In 2013 life expectancy at age 65 was 18.7 years for males and 21.1 years for females in England and Wales, a gap of 2.6 years. This compares with a gap of around 4 years in the 1970s and 80s.

3.4 Julie then compared life expectancy at birth internationally. Japan has the highest life expectancy at birth in the world at 86.6 years for females and amongst the highest for males at 80.2 years. This compares with figures for the UK of 78.9 years for males and 82.7 years for females. Four countries in total have exceeded 80 years for life expectancy at birth for males.

3.5 Moving onto looking at the major causes of mortality, Julie noted that the recent improvements have been driven by large falls in deaths from circulatory diseases since the early 1970s. Age standardised mortality rates for cancer are now higher than for circulatory diseases so will have a greater effect on future rates of mortality improvement.

3.6 Looking at the heat charts of mortality improvements, Julie highlighted the golden cohort. This cohort, born in the 1930s, has experienced higher improvement rates in every year than the surrounding cohorts for both males and females. However, Julie noted the emergence of potentially similar new cohorts with higher improvements born around the 1990s.

3.7 Adrian Gallop briefly described the methodology for the 2012-based assumptions as a four step process:

  • estimate current rates of mortality improvement by age and gender

  • set target rates of mortality improvement for the target year

  • make assumptions on method and speed of convergence of current improvement rates to target rates and how improvement rates change after the target year

  • apply successively to assumed base mortality rates

3.8 He then compared the assumed percentage changes in smoothed death rates between 2011 and 2012. Scotland (shown separately to the rest of the UK) was assumed to have lower levels of improvement at some ages.

3.9 Some potential drivers for future mortality change were described. These were:

  • changes in bio-medical technology

  • effectiveness of health care systems

  • behavioural changes related to health:

    • decline in smoking prevalence
    • lifestyles
    • obesity
  • emergence of new diseases (e.g. HIV, SARS)

  • re-emergence of old diseases (e.g. TB)

  • environmental change, disasters, wars

  • change in population composition; cohort effects, migrants

  • increasing resistance to antibiotics

3.10 The choice of the target rate of improvement was then addressed. Adrian noted that rates of improvement for the older ages are of most importance as these ages are where most deaths occur. Another factor to consider is that the standardised average rate of improvement for the age group 0 to 99 over the last 100 years was approximately 1.2% per annum and cohorts exhibiting the greatest improvement will be aged 100-110 in 25 years so would not contribute much to the overall rate of improvement in the target year. It was noted that there is continued debate as to whether future technical, medical and environmental changes will have greater or lesser impact than the past.

3.11 Adrian presented the UK percentage change in death rates between 2011 and 2012 by age attained in 2012 which clearly illustrated the higher improvement rates for the golden cohort. It was assumed that the 1930s cohort would continue to have higher improvement in the future.

3.12 Comparing actual and projected overall annual rates of mortality improvement for the UK over the same number of years, future rates over the next 49 and 79 years were broadly similar to those experienced over the past 49 and 79 years respectively. However, in the shorter term, there are some differences with an annual standardised rate of mortality improvement of 2.2% in the past compared to 1.8% projected for the future for males and 1.6% in the past compared to 1.9% in the future for females over the last/next 29 years.

3.13 Adrian then compared the ONS life expectancy projections with international comparators. ONS’ life expectancy projections have historically been more optimistic than figures produced by Eurostat and the UN. The UK generally projected higher improvements than those by comparator countries. Looking at the projected period expectations of life at birth for 2060 for a selection of developed countries, those for Canada, the Netherlands, Austria and New Zealand are higher expectation than that for the UK for males. For females, France, Japan, Austria and New Zealand have a higher expectation of life than the UK.

3.14 Julie summarised the questionnaire results. In terms of the six forces, the majority of responses were either small changes, up or down, or little or no change. Experts felt obesity levels are likely to remain at similar levels and will have little effect on mortality. The only large upwards changes anticipated are as a result of changes in medical technology.

3.15 In terms of the target rate of improvement, the general opinion was that this should vary by age and be the same for males and females. There was some agreement for a rate of 1.2%, but suggestions varied between 0.9% and 1.7%. Julie noted that if we had a 1.7% target rate for males and 1.5% for females in the 2012-based projections (and higher rates for the golden cohort) this would result in period life expectancy at birth in 2060 of 89.0 for men and 91.1 years for women, compared to 87.0 and 90.1 respectively with an improvement rate of 1.2%. Most felt that the golden cohort improvement will reduce in the next 5-25 years.

3.16 In terms of period life expectancy, the average of the experts’ opinions for the central estimate was 80.3 for males and 83.9 for females in 2018 and 84.9 for males and 88.2 for females in 2038 compared to 80.7 for males and 84.3 for females in 2018 and 84.2 and 87.5 in 2038 in the 2012-based projections.

Discussion

3.17 It was noted that users of projections are interested in the total number of births and deaths. The experts were keen to understand how sensitive the results are to cohort differences and changes in the assumptions. It was recognised that the numbers surviving into old age are key planning factors. Higher assumptions for death rates of those aged 85+ and 95+ would have a significant impact. Julie confirmed that a higher target rate for the golden cohort doesn’t have a large impact. Differences in period life expectancy at age 65 with or without the higher target rates of improvement are less than 0.2 years. Adrian confirmed that a change in the improvement rate from 1.2% to 1.0% results in a reduction in life expectancy at birth in 2038 of 0.3 years for males and 0.2 years for females, which is also a small effect.

3.18 It was noted that the retirement age might have an impact on mortality and life expectancy. There will be fewer people suffering debilitating injuries. It was also noted that rates differ geographically. For instance, former mining areas tend to experience more disadvantage in terms of mortality. A similar parallel was drawn with the rapid deindustrialisation of Glasgow.

3.19 One member noted that internationally assumptions are diverse and suggested there is value in understanding life expectancy and mortality change within a suite of other countries for the long term. This system might be a more stable basis for projecting. Changes such as surgical procedures are common across countries. Adrian confirmed that a lot of countries use an extrapolation method. Last time the range of countries projections for life expectancy at birth were lower than the UK whilst later projections are more in line with those in the UK 2012-based projections.

3.20 It was suggested it would be useful to know early age morbidity. Any life effects of illness might be important. Life expectancy at age 65 will depend on the health of a person in their earlier life. Even small effects at young ages might have leverage. It was noted that in part this would be counterbalanced by improvements in medical technologies e.g. statins. This will depend on the type of illness. Those with some illnesses might be more likely to develop other health problems. An illness such as diabetes is monitored which might result in other issues being identified early.

3.21 There was a discussion regarding life expectancy at different ages. It was noted that looking at the lexis diagrams, different conclusions can be drawn. Most ages are improving. Few ages are as low as 1.2%. One member queried what the impact would be of continuing with the current values of improvement. Adrian advised that ONS used to produce a projection using a constant mortality improvement assumption but this resulted in an unusual pattern of mortality rates by age.

3.22 ONS looks at the mortality and life expectancy figures and makes some further adjustments. The projections were extended to age 125 to reflect the projected increase of those at very high ages. It was noted that the probability of those surviving at age 115 will increase as there is a body of people moving up from a range of ages. Adrian made reference to a recent Public Health England report which looked into the levelling off of mortality improvement at older ages and considered whether this was a blip or long term trend.

3.23 There followed some discussion regarding the life expectancy of the very old. This included the potential for there to be a change in the medical decision to keep a person alive, a change in social attitudes towards this issue or the wishes of patients being taken into account. One member noted that an assisted dying law might have a significant effect, although another noted that in the Netherlands the impact has been small as any extension of life tends to be for a short timeframe.

3.24 The impact of antibiotic resistance was discussed. It was suggested that this would make a small difference to the very old. It could occur as an epidemic but in these instances the remaining population tends to be less vulnerable.

3.25 Adrian asked members if they felt that an improvement rate of 1.2% was too optimistic. It was acknowledged that there are many factors which might impact on improvement rates and we can’t hope to take these all on board. It was noted that the overall average has been constant for a long time and there needs to be good reason to deviate from this.

3.26 The continued ability of the NHS to treat patients was discussed. As an example one member noted that the life expectancy of those with diabetes has doubled but expressed doubt that this trend would continue due to the rise in the number of cases and the cost implications. Another member noted that affordability is counterbalanced. If the health of the elderly is not treated, social care services will need to be provided. Members suggested that improvements in life expectancy might be driven at age 60 and 70 or that more weight should be given to the early retirement years. Again it was noted that a rise in the statutory retirement age will have some effect.

3.27 In their response to the questionnaire, members responded that levels of obesity would stay the same and have no impact on life expectancy. It was noted that recent surveys have shown that more than 60% of the population are classified as overweight or obese. Life expectancy for those with diabetes is on the increase. One member mentioned that there are models to project obesity; Public Health England has done some work in this area. In the long term, obesity amongst children has been shown to level off.

3.28 Adrian noted that the mortality rates for the old ages are not really impacted by migration and are not tied to the migration assumptions. Factors impacting the life expectancy of the population are likely to be the same for migrants as those born here. It was also suggested that those who migrate are often the healthiest of their country.

3.29 Adrian said that the variant mortality projections assume target rates of 2.4% and 0% per annum in 2038 with higher rates for those born in the 1930s as for the principal projection. Adrian explained that users are encouraged to look at the high and low life expectancy variants to see how sensitive the projections are. These variants are not bounds. One member noted that for the principal figures, factors counterbalance. ONS might need to be more explicit as to the reasons behind the high and low values to justify these assumptions. There is nothing to suggest that the trajectory should be changed but more context should be added. It was noted that quantifying differences is harder than producing qualitative arguments in support of the variants.

3.30 One member noted that the UN probabilistic model might be easier to justify to the panel but not to users.

3.31 One member noted that deaths and population numbers matter more to users. Linking state pension age to life expectancy would provide interesting information about social class differentials. This will mean that future mortality projections would come under greater scrutiny.

4. Migration

Introduction

4.1 Suzie Dunsmith started her presentation by looking at the UK migration assumptions for the 2012-based National Population Projections and how this compared to historic trends and migration estimates. The long term UK principal migration assumption was set at 165,000 per annum, with high migration and low migration of +/- 60,000. In the first year of the principal projection, the figures were 17,500 below and in the second year 94,500 below the migration estimates subsequently published. The latest migration figure is for the year ending September 2014 which estimated a 298,000 net inflow to the UK.

4.2 UK net migration followed an upward trend from 1997, to a peak of 273,000 in 2007. It dropped from 2010 to 2011 and 2012 but rose again in 2013. Suzie noted that the net international migration figures were revised after the 2011 Census, but the corresponding in and outflows were not amended.

4.3 Approximately half of all immigration to the UK is from non-EU citizens, about two fifths is from EU citizens and the remaining immigration is made up of British citizens. The top five countries of previous residence are China, Spain, India, Australia and Poland. Work and study have been the main reasons for immigration in the recent past with work becoming a more popular reason to migrate than study.

4.4 In terms of UK emigration, about 40% is by British citizens, a third is from non-EU citizens and the remaining emigration is by EU citizens. The top five countries of next residence are Australia, USA, Spain, China and France, with the main reason for emigration being work-related.

4.5 Suzie summarised the main findings of the questionnaire in terms of the main drivers for migration.

4.6 Experts felt that political instability around the world would not have a big impact.

4.7 For environmental change, members anticipated little or no effect in the short term and no effect or a small/large upwards movement in the long term. It was felt that economic factors would impact more and inflows would be dependent on government policies. One member felt that the UK is more likely to be affected by growing aridity and associated effects in southern Europe. This would result in fewer British people wishing to emigrate there whilst there would be more people from southern Europe preferring to move north.

4.8 The responses to the impact of the changing global economy were more mixed with the majority of experts expecting a small upwards movement in migration over the next 5 years. In the long term, there was a spread of responses between a small downwards and large upwards movement. In the long term the relative attractiveness of the UK was questioned. It was felt that European economies might not be stronger than China, India, some African states and Brazil and the recovery in other European countries might reduce the pressure of migration to the UK. Over 25 years, it was felt that the use of advanced communication and other technologies will reduce the necessity for much of the project-based movement that currently takes place.

4.9 Other factors suggested by experts that might impact on migration included government policy, EU membership, the need for labour to support the elderly population, an increase in alternatives to a UK higher education and a reduction in the demand from other countries for UK emigrants.

4.10 Suzie reported on the analysis of the questionnaire responses. For the long term, the experts’ average central estimate for UK immigration was 530,000 with an average 95% confidence level of 309,000 to 750,000. This compares with the latest estimate of 526,000. For international emigration, the average central estimate was 383,000 with an average 95% confidence level of 256,000 to 531,000, compared to the latest estimate of 317,000. For net international migration the average central estimate was 153,000 with an average 95% confidence level of 0 to 377,000. Suzie noted that this was a lower figure than the last two expert panel meetings had suggested and compares with the latest estimate of 209,000 (year ending December 2013). Three experts thought it possible there could be negative UK net migration in the long term.

4.11 The central estimates for short term in, out and net migration were 535,000, 355,000 and 188,000 respectively. It was noted that the 95% confidence interval for one expert includes the potential for negative net migration in the short term.

Discussion

4.12 Members of the panel were invited to discuss the factors impacting on future migration.

4.13 One member felt the factors influencing migration are students, internationalisation and the economy of other countries e.g. the Eastern European economy improving. The politics of migration also have an impact. The government can control levels of migration and there is a likelihood that migration will reduce in the long term as services are not sustainable. The expert felt that although free movement will not stop, the drivers will diminish and in the long term forces will not continue at the same level.

4.14 It was suggested that social networks attract large numbers of migrants e.g. Indians. Polish migrants come to the UK for different reasons. Reference was made to Tony Champion’s work on onward migration which identified that some migrants go to Bristol for the good job prospects whereas Indians go to areas such as Birmingham to be with family.

4.15 Another expert noted that there are pull factors leading to circulatory migration. In future there will be a larger population requiring care services and consideration needs to be given to whether there are enough people to do these jobs. Short term employment contracts might be issued resulting in people from outside the UK coming for a short period of time. Consideration needs to be given to how public services might change, the skill levels of the UK-born population for high skilled roles and how difficult it might be to fill low skilled jobs.

4.16 It was noted that in the past there were low levels of productivity in the UK economy. For certain sectors, cheap labour came into the country and capital investment stopped. There is scope for some low level jobs to be filled by increased productivity and capital investment.

4.17 One expert highlighted the fact that the development of new IT methods that allow remote access will impact on migration. There is likely to be an increase in virtual, rather than physical, movement.

4.18 Environmental changes worldwide will have an impact on migration. There might be movements of populations e.g. in Africa.

4.19 One expert anticipated that in and out migration will remain high but that net migration will fluctuate over time with the economic cycle and that fluctuations will determine the long term trend. Economic factors are key in the short term and this expert does not believe that migration will drop drastically from now.

4.20 Another believes that in the long term there will be more movement for economic purposes but the UK will receive a smaller share of migrants as it will be competing against other countries. In the short term, the UK will keep outgrowing the EU with no expectation that will stop as long as the UK remains part of the EU.

4.21 It was noted that there is a global spread in the use of the English language e.g. Spain. There is a pool of people who want to go to English speaking countries. The whole world opens up to a common language.

4.22 One member suggested that a combination of economic self interest, social networks and existing flows explains variation globally. A proportion of migrants are accompanying dependants and this is a self sustaining process that will be secular. It was recognised that the larger the stock of migrants, the more attractive the location. It was noted that with the sponsorship system there was a cap on Tier 2 visas but the number of Tier 2 visas being extended has increased considerably. In the points based system people could previously come for 3 years, now it is 5 years. There have been many extensions, more being for dependants than principal applicants.

4.23 It was noted that the UN figures for the past 40-50 years show Europe and North America with growing net in migration. Africa, Asia and Latin America have increasing net out-migration. There is inequality economically in the world so the levels of net immigration will continue to diverge. The trends seem to suggest a growing gain to Europe including the UK.

4.24 There was acknowledgement that it is difficult to predict what will happen. Views are polarised and there is no consensus.

4.25 A point was made regarding the impact on aid structures. The minority of migrants will stay a long time. A bigger minority staying on impacts on the older population, with the proportion staying having a cumulative effect.

4.26 It was noted that for London and the South East, 40% of the rise in population of the 18-35 cohort is due to migration. A third of the population of England lives in London and the South East. As social and economic factors differ by region, it was suggested that migration assumption setting should be undertaken at a regional level. Suzie described modelling work undertaken by ONS to trial setting migration assumptions for London and the South East, separate to the rest of the UK. This work concluded that the migration assumptions were no different than if they had been set nationally.

4.27 It was noted that looking at recent trends by origin, there are pressures from Spain, Greece and Italy. The focus has tended to be on Eastern Europe. In the short term, the push from the rest of Europe is important. In terms of migration from China, the regulations regarding students are important.

4.28 Suzie described the changes that will be implemented in the 2014-based projections from using cross border migration rates, instead of flows, between countries of the UK. She also sought experts’ views on the option to apply an adjustment to the rates, similar to the method recently adopted by Statistics Canada, to ensure migration figures are responsive to the projected size of each of the UK countries.

4.29 Experts agreed that a migration adjustment should be applied. The cross border migration numbers are fairly stable. Applying the adjustment maintains this stability. It was also noted that an adjustment makes sense logically as growing areas become more attractive to migrants.

4.30 Suzie invited the views of members to setting the UK migration high and low variants additively rather the non-additively in the 2014-based projections. One expert agreed that it is mathematically necessary for this to happen so the overall error is the sum of the constituent countries. However, another member noted that by doing this the assumption is that migration is at its highest/lowest in all four countries simultaneously which is unlikely and would result in variants wider than expected.

4.31 There was some discussion regarding the number of immigrants that report their residence as being London on the IPS, but who subsequently move out of the capital. One member felt that in the projections methodology there is nothing that relates international migration with cross border moves and historic cross border rates would not fully capture these patterns. It was noted that these movements should be picked up through GP registrations, although that is dependent on individuals actively registering with a doctor. One member confirmed that there are new migrant ciphers on the NHSCR. Although it is not possible to determine when a migrant arrived, it can be used to identify the number from abroad who moved out of London.

4.32 Suzie asked the experts to consider whether the opposing forces would result in an increase or decrease to future international migration levels. One member suggested fitting a regression line to the upwards trend. Others believed that the high net figure has been observed for a relatively short timeframe and that a linear trend could not continue. Another noted that net migration is cyclical due to returning migrants.

4.33 It was suggested that the individual routes of entry (student, labour, asylum or family) could be considered. People move for different durations of time. Consideration also needs to be given to what is likely to happen in terms of family migration such as the need to speak English and the dependants of migrants. The political agenda places restrictions on family, working and student migrants.

4.34 Experts generally felt that levels of emigration will increase. The graph presented by Suzie showed that 40% of emigration from the UK is by British citizens and 60% is by those born overseas. It was noted that as the numbers born overseas increase, there will be a larger number of people to emigrate.

4.35 It was noted that the UK education system is becoming increasingly dependent on international students. Other countries are now seeking to attract students from overseas. For example, Kazakhstan is now offering courses in English and students from China are seeking lower fees.

5. AOB

5.1 Suzie outlined the next steps in the process:

  • minutes to be sent to the panel for checking and an anonymised version to be published with the release

  • teams to set assumptions

  • consultation with users

  • NPP Committee to agree long term and set short term assumptions

  • projections run

  • publication in October/November 2015

5.2 Jay thanked members for attending the meeting and for their valuable input and informative discussion.

Back to table of contents

.Appendix B: Analysis of the results of the NPP expert advisory group questionnaire

The National Population Projections (NPP) Expert Advisory Panel of 9 academic demographic experts met in April 2015. In an accompanying questionnaire, they were asked for their opinions on the likely future levels and trends in fertility, mortality and migration. This report summarises the main findings.

Fertility

The experts were asked for their views on UK fertility trends over the next 25 years.

Expert assessment of long-term UK fertility level

The experts were asked for their views on the most likely level of the total fertility rate (TFR) in 2038. Eight out of nine experts thought that the TFR would be between 1.80 and 1.93 in 2038, with one expert estimating a lower TFR of 1.50.

There was no consensus among the experts around exactly what the TFR would be in 2038, and all commented on the difficulty of predicting TFR into the future, given the range of conflicting forces.

The average TFR predicted for 2038 was 1.82, a similar level to the 2013 estimate, but substantially lower than the average experts’ predictions from previous projection rounds. This is also lower than the 2012-based projection of a TFR of 1.89 in 2038, which may imply that there is evidence for decreasing the long-term assumption. However it is worth noting that the membership of the panel changed between projection rounds, so it is unclear whether this increase is due to different experts making up the panel, or a change in the experts’ views.

On average, experts believed that there was a 67% chance of the TFR in 2038 lying between 1.60 and 2.09 and a 95% chance of it lying between 1.39 and 2.32, though these figures for the 95% confidence interval were affected by one expert’s very large confidence interval estimate. (Figures 1.1 and 1.2).

Expert assessment of UK fertility trends in the short-term

The advisory panel was asked to assess the likely trend in fertility up to 2018 with reasons and to estimate the likely TFR in 2018.

Likely short-term trends in fertility

In terms of likely trends in age-specific fertility rates up to 2018, all experts believed that age specific fertility rates (ASFRs) for women under 20 would stabilise or decrease further. There was no consensus on the likely short-term ASFR trend for women in their 20s but no expert felt it would change substantially. Experts believed that fertility would continue to increase, or stabilise, for women in their 30s. All experts agreed that there would be an increase in ASFR for women aged over 40.

Quantitative estimates for 2018

The 9 experts were asked to quantify the most likely level of the TFR in 2018, together with plausible ranges which would cover roughly 67 and 95% of possible values. Figures 1.3 and 1.4 show the predictions for 2018.

Estimated TFRs for 2018 ranged from 1.75 to 1.89. Four were between 1.85 and 1.90, and 3 experts predicted 1.80. Other experts’ estimates were 1.75 and 1.83. The mean was 1.83, a slightly lower prediction to the experts’ 2012 projection round average of 1.89 in the short term.

On average, experts believed that there was a 67% chance of the TFR lying between 1.75 and 1.93 in 2018 and a 95% chance of it lying between 1.68 and 2.00. This underlines the uncertainty inherent in estimating future fertility, even within a short timescale.

Underlying forces that may influence future fertility

The advisory panel was asked to consider 6 forces with the potential to affect fertility levels in the long-term (to 2038). By considering a range of arguments within each force they were asked to assess the overall likely impact on future family size. The experts emphasised that the effect of some forces were complex and sometimes conflicting.

“Changing bio-medical conditions, such as new or greater use of assisted reproductive technologies” was the force that had the greatest consensus amongst experts. The majority felt that this would have an increased impact on fertility, with others having the opinion that this would have little or no effect. One expert believed that the increase in fertility would be due to the increase in success in medical breakthroughs such as freezing eggs.

“Changes in population composition and differential trends in population subgroups, for example the fertility of non-UK born groups” was the force that experts felt would have the greatest impact on fertility, with all but one expressing a direction of impact. However, the effect of this was slightly conflicting with 6 experts of the opinion that this would have a small upwards effect, one a large upwards effect, one small downwards, and one with little or no impact. One expert commented that the driver of environmental change may result in more immigrants from poorer regions who have high fertility.

The force “Trends in patterns of education and work (including the proportion of time dedicated to the professional side of life)” also had a divided opinion with 5 experts believing that this would have a small downwards impact, 3 felt it would have little or no impact, and one a small upwards impact on fertility. One expert believed that the strongest driver on future fertility trends would be the relationship between women and work, and that the downward impact on fertility would be due to the desire for paid labour in order to avoid unpaid reproductive labour.

The 2 forces “Trend in ideal family size and (the strength of) individual desires for children” and “Trends in income (including indirect income such as free childcare hours)” had a divided opinion across the panel on the impact on fertility. Approximately half of the experts agreed that either force would have little or no effect. The remainder were divided between small upwards and downwards impacts. It was discussed that Government policies on family allowances and benefits levels would have an effect on fertility.

The final force, “Changing nature and stability of partnerships, for example the rise of cohabiting parents” were felt by the majority of experts to have little or no net impact on fertility rates. This does not mean that the forces would not have some effect, but that the effects they have will be minor, or will be conflicting.

In addition to the forces ONS asked the experts about, they were invited to supply any other forces they felt would be important in shaping future fertility. Government policies such as provision of paid paternity leave and increased subsidisation of childcare were believed to impact on fertility. In addition, policies regarding teenage sexual health, for example, abortion, provision of free contraception and wide availability of contraception (including emergency contraception) were further government-related forces. Housing shortages and rent prices, and environmental impacts (of climate change worldwide, connected to migration) were also felt to be factors that could affect UK fertility in the long-term, as well as the impact of same sex marriages and surrogacy.

Mortality

The experts were asked for their views on expectations of life at birth in the UK, and on a series of arguments that might be thought likely to influence mortality, either upwards or downwards.

The average response by the experts for period expectation of life at birth in 2038 was 84.9 years for males and 88.2 years for females. One expert did not respond to the question. These compare with the 2012-based projection for 2038 of 84.2 years for males and 87.4 years for females. There was some divergence of views with regard to life expectancy for both male and females between the experts, with 2 of the 5 estimates being outside the 67% confidence interval for the group average for males, and one estimate outside the confidence interval for females (Figure 1.5 and 1.6).

The majority of the panel was optimistic about future mortality improvements although they had differing views about period expectation of life at birth continuing to rise at the same rate as that seen over the last decade or so. Most were of the opinion that the rates of improvement in male mortality should be higher or maintained at 1.2% per year. One of the experts thought that the rates of improvement for males should be lower than 1.2%. The opinions were the same with regard to rates of improvement in female mortality.

The main force thought most likely to affect future mortality levels was changes in bio-medical technology. The majority opinion of the expert panel was that this force should have a small upwards influence on life expectancy, with 3 experts reporting a large upward influence for this force.

The experts generally felt that environmental change, disasters and war would have little or no influence on life expectancy. They were also of the opinion that changes in population composition and differential trends in population sub-groups would have little impact. The majority of the panel thought that the level of obesity in the UK will remain at a similar level over the next 25 years.

Migration

The experts were asked about their views on the levels of international migration to and from the UK in 2018 and 2038 (that is, 5 years and 25 years into the future from the 2013 estimates, which were the latest available at the time).

Experts' views on migration in the long-term

With respect to immigration to the UK, 4 experts thought that the level in 2038 would be lower than the average of 2009 to 2013 estimates (that is, between 350,000 and 500,000 per year), 3 experts thought that the level would be higher (between 590,000 and 600,000 per year), and one thought it would be significantly higher (700,000 per year). One expert did not respond to the question. The average response for the expected level of annual immigration to the UK in 2038 was 530,000, with an average 67% confidence interval of 369,000 to 643,000.

With respect to emigration from the UK, 6 experts thought that the level in 2038 would be roughly similar to the average of 2009 to 2013 estimates (that is, between 300,000 and 400,000 per year), whilst 2 thought it would be higher (between 450,000 and 500,000 per year). One expert did not respond to the question. The average response for the expected level of annual emigration in 2038 was 383,000, with an average 67% confidence interval of 293,000 to 471,000.

The average annual net migration derived from the experts’ responses for 2038 was a net inflow of +153,000 per year (with an average 67% confidence interval of 69,000 to 315,000). This is a smaller figure than the 2012-based long-term assumption for net migration to the UK of +165,000 per year. Net international migration to the UK derived from the experts’ assessment of likely levels of immigration and emigration in 2038 are shown in Figure 1.7, together with associated 67% confidence intervals.

The experts were also asked to consider 3 overall forces with the potential to affect levels of net migration to the UK in the long-term and assess the importance and likely impact of each force upon future migration:

  • the continuing instability of Syria, Ukraine, and other regions

  • environmental change

  • the relative attractiveness of the UK in a changing global economy

The majority of experts considered the first force to have an upwards impact on total net migration, with 4 experts stating this would have a small upwards effect, 2 a large upwards effect, and 3 little or no effect on total net migration. Forces 2 and 3 were perceived to have less of a large influence. Five experts considered the environmental change force to have little or no effect, 3 a small upwards effect, and one a large upwards impact on total net migration. There was most disagreement with the third force, where 3 experts felt this would result in a small upwards impact, one a large upwards, 2 a small downwards impact, and the remainder little or no impact on total net migration. Other forces identified by the experts were UK government policies (including employment and border controls), EU regulations and membership and education trends.

Experts’ views on migration in the short-term

With respect to immigration to the UK, 8 experts thought that the level in 2018 would be roughly similar to that estimated for 2013 (that is, between 500,000 and 600,000 per year). One expert did not respond to the question. The average response for the expected level of annual immigration to the UK in 2018 was 535,000, with an average 67% confidence interval of 437,000 to 609,000.

With respect to emigration from the UK, 8 experts thought that the level in 2018 would be roughly similar to that estimated for 2013 (that is, between 300,000 and 400,000 per year). One expert did not respond to the question. The average response for the expected level of annual emigration from the UK in 2018 was 355,000, with an average 67% confidence interval of 303,000 to 393,000.

The average annual net migration derived from the experts’ responses for 2018 was a net inflow of +188,000 per year (with an average 67% confidence interval of 129,000 to 274,000). This is somewhat higher than the corresponding experts’ average for 2038 (+153,000 per year). Net international migration to the UK derived from the experts’ assessment of likely levels of immigration and emigration in 2018 are shown in Figure 1.8, together with associated 67% confidence intervals.

Back to table of contents

.Appendix C: Changes to state pension age

Back to table of contents

Contact details for this Compendium

Andrew Nash
pop.info@ons.gov.uk
Telephone: +44 (0) 1329 44 4661