Table of contents
- Main points
- Things you need to know
- Super Output Area population estimates
- Clinical commissioning group population estimates – National Statistics
- Westminster Parliamentary constituency population estimates – Experimental Statistics
- Electoral Ward population estimates – Experimental Statistics
- National Park population estimates – Experimental Statistics
- Small area population estimates for other UK countries
- Where can I find other information?
- Quality and Methodology
- Background notes
1. Main points
In mid-2015, there were 34,753 lower layer Super Output Areas (LSOAs) in England and Wales with a mean population of 1,666 and 7,201 middle layer Super Output Areas (MSOAs) with a mean population of 8,039. The LSOA with the highest median age in mid-2015 was Eastbourne 012B at 71.2 years, with 15.1 years being the lowest in Salford 016E.
There were 209 clinical commissioning groups (CCGs) in England with a mean population size of 262,136 in mid-2015. The CCG with the largest proportion of the population aged 65 and over was NHS North Norfolk at 28.9% and the CCG with the largest proportion of the population aged 0 to 15 was NHS Bradford City at 27.9%.
The 573 Westminster Parliamentary constituencies in England and Wales had a mean population of 101,022 in mid-2015. On average English constituencies tend to have larger populations than Welsh constituencies (means of 102,789 and 77,477 respectively).
In mid-2015, the 8,363 electoral wards in England and Wales had a mean population of 6,922, although population sizes ranged from 150 in St. Martin’s ward in the Isles of Scilly to 42,536 in Central ward in Sheffield.
The populations of National Parks have a higher proportion of older people than England and Wales as a whole. In mid-2015, it was estimated that 27.4% of the population of National Parks were aged 65 years or over compared with 17.9% of the population of England and Wales.
Back to table of contents2. Things you need to know
This bulletin includes estimates for lower and middle layer Super Output Areas (LSOAs and MSOAs), Westminster Parliamentary constituencies, electoral wards and National Parks in England and Wales and clinical commissioning groups (CCGs) in England.
There are 2 broad types of small area population estimates, both of which are included in this release.
The main products are the estimates for Super Output Areas (SOAs), which are based on the 2011 Census and rolled forward annually using a ratio change methodology. This approach uses the change in the population recorded in the GP Patient Register as an indicator of the change in the true population. Estimates for LSOAs by broad ages and MSOAs by 5 year age groups (quinary age) hold National Statistics status. Estimates at a greater level of disaggregation by age including quinary age for LSOAs and single year of age for both SOAs are supporting information only. More information can be found in Small Area Population Estimates: Summary of methodology review and research update.
The remainder of small area population estimates products relate to a range of different geographic areas and are derived directly from the SOA figures. Firstly, estimates for lower layer Super Output Areas (LSOAs) are broken down to Output Area (OA) level using an apportionment approach. These OA estimates are then aggregated to produce estimates for electoral wards and Westminster Parliamentary constituencies on a best-fit basis. Estimates for National Parks are also calculated from the OA level data. Electoral wards, Westminster Parliamentary constituencies and National Parks all hold Experimental Statistics status. Estimates for health geographies are aggregated directly from LSOAs and hold National Statistics status.
Small area population estimates are used by both central government departments and local authorities for a range of purposes, including planning and monitoring of services and as denominators for the calculation of various rates and indicators. The Quality and Methodology Information document has further information on the quality and use of these statistics.
Population estimates for LSOAs and MSOAs are often used for research and analysis as, unlike other small area geographies, such as electoral wards, they are specifically designed for statistical purposes. Electoral ward population estimates are of particular interest to local government organisations. Parliamentary Constituency estimates are of importance to Parliamentary organisations, researchers and MPs. Population estimates for health geographies are widely used within the health sector and information on National Parks is valuable to both local government and the various National Park authorities.
The mid-2015 small area population estimates covered by this bulletin are fully consistent with population estimates for higher levels of geography including local authorities, regions and the national total for England and Wales. A full description of the methods used to calculate all small area population estimates is available in the methodology guide published on our website.
In some local authorities, the number of people included in the patient register data in 2015 has increased or decreased in a large number of LSOAs and MSOAs compared with 2014 data, which may be due to changes in administrative practices or may reflect genuine population change. The process of constraining LSOA and MSOA estimates to previously published local authority population estimates means that this pattern is not automatically reflected in the mid-year estimates.
Mid-year population estimates for 2015 for England and Wales, regions within England and local authorities within England and Wales were published on 23 June 2016. The estimates refer to the usually resident population on 30 June of the reference year and are published annually. In mid-2015, the population of England and Wales was 57,885,413, an increase of 0.8% since mid-2014 and 8.0% over the 10 years since mid-2005.
The population increase of 476,800 since mid-2014 was driven by net international migration of 313,200 and natural change (births minus deaths) of 165,100 and offset slightly by internal migration of minus 7,600. Other changes of 6,000 made up the remaining increase. The population of England and Wales is ageing. Ageing of the population refers to both the increase in the average (median) age of the population and the increase in the number and proportion of older people in the population. The proportion of the population in England and Wales aged 65 and over at mid-2015 was 17.9%, compared with 16.0% at mid-2005. Changes in the population of England and Wales are reflected in the changes at small area levels outlined throughout this bulletin.
Back to table of contents3. Super Output Area population estimates
- National Statistics for lower layer Super Output Areas (LSOAs) by broad ages and middle layer Super Output Areas (MSOAs) by 5 year age groups (quinary ages)
- supporting information for estimates at a greater level of disaggregation by age, including quinary age for LSOAs and single year of age for both SOAs
Super Output Areas (SOAs) are statistical geographies designed to improve the reporting of small area statistics. They are built from groups of census Output Areas, are generally of a consistent population size and are not subject to boundary changes between censuses. Where possible they are formed from groups of socially similar households and align with local features such as roads and railway lines. The comparability and stability of the geography, which cannot be provided by other small area administrative geographies such as wards or parishes, is one of the main benefits to users of these statistics.
Figure 1 shows the annual population change was less than 1% in 38.9% of LSOAs and less than 5% in 92.6% of LSOAs. Figure 1 also shows the annual population change was less than 1% in 56.8% of MSOAs and less than 5% in 97.2% of MSOAs. This compares with the annual change of 0.8% for England and Wales.
Figure 1: Distribution of LSOA and MSOAs by population change, England and Wales, mid-2014 to mid-2015
Source: Office for National Statistics
Download this chart Figure 1: Distribution of LSOA and MSOAs by population change, England and Wales, mid-2014 to mid-2015
Image .csv .xlsAge distribution
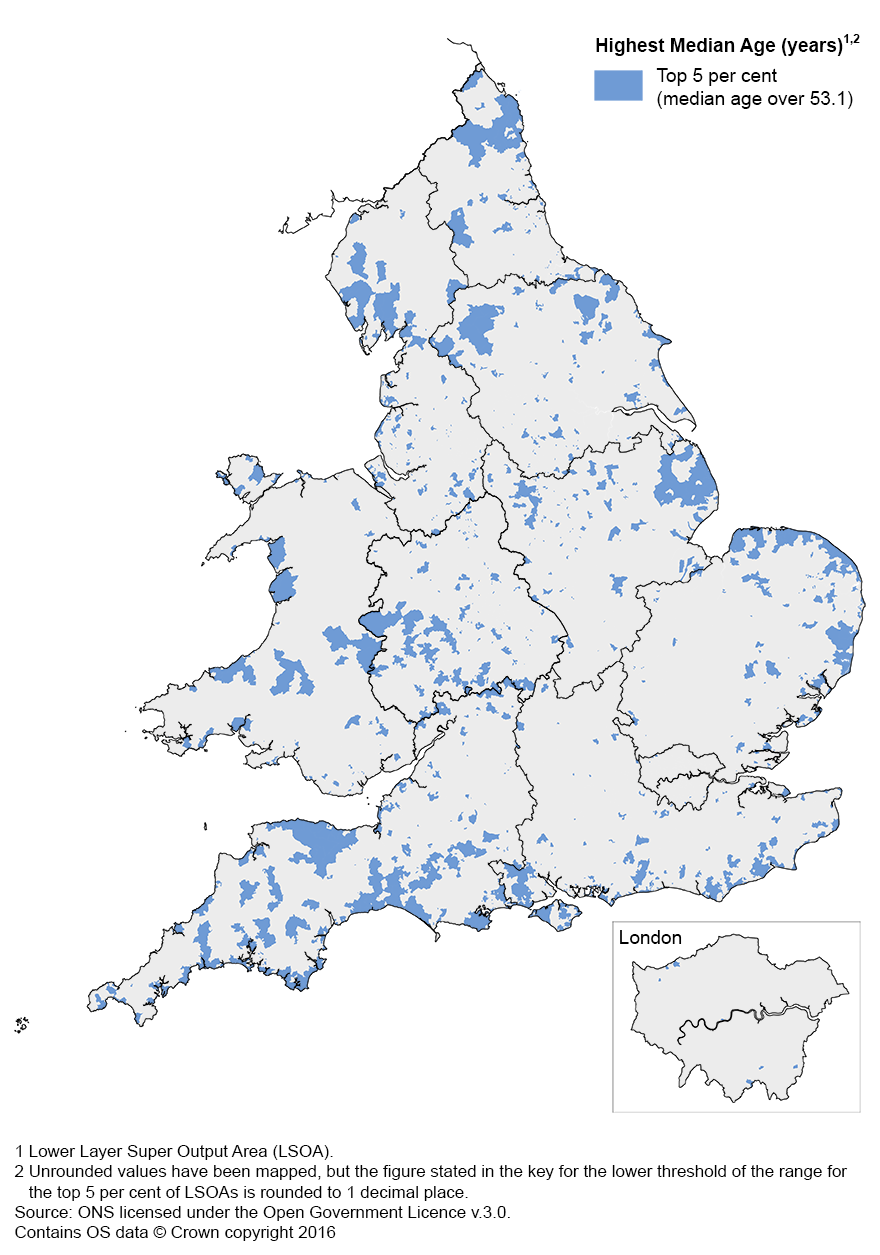
The median age of the population of England and Wales in mid-2015 was 39.9 years. The median age for LSOAs within England and Wales varies widely between different areas. In mid-2015, the highest median age was 71.2 in Eastbourne 012B.
Figure 2 shows that populations with the highest median age are concentrated around the coastal regions, the National Parks and the South West.
Figure 2: Highest median age (top 5 per cent of areas), by LSOA, England and Wales, mid-2015
Source: Office for National Statistics
Download this image Figure 2: Highest median age (top 5 per cent of areas), by LSOA, England and Wales, mid-2015
.png (395.6 kB)
4. Clinical commissioning group population estimates – National Statistics
Clinical commissioning groups (CCGs) are responsible for deciding how NHS funds are spent in their local area. They were introduced, for England only, by the Health and Social Care Act 2012 as part of a new structure for NHS organisation, which came into force on 1 April 2013. The 209 CCGs come under the 4 regional teams of London, Midlands and East, North and South. This change was part of its Organisational Change Programme 2014 to 2015 which came into effect in April 2015 England’s 27 area teams were integrated into the single tier of the regional teams. The data tables included in this release also provide population estimates for these higher health geography areas.
CCGs replaced the former health geography areas, known as Primary Care Organisations (PCOs). Following a formal consultation we discontinued the production of population estimates for PCOs.
The mid-2015 CCG population estimates, referred to in this bulletin, are direct aggregations of mid-2015 lower layer Super Output Area (LSOA) estimates. They are consistent with population estimates for higher levels of geography, including local authorities and the national total for England. These estimates are classified as National Statistics.
At mid-2015, the mean population of CCGs was 262,136 with population sizes ranging from 66,854 in NHS Corby to 890,596 in NHS Northern, Eastern and Western Devon.
Annual population change
Of the 10 CCGs with the largest percentage increases in population between mid-2014 and mid-2015, London had 7. The CCG with the largest percentage increase in population was NHS Central London (Westminster) at 4.1%.
In total, 11 CCGs had a population decrease between mid-2014 and mid-2015, with the greatest decrease being 0.7% in NHS Blackpool.
Age distribution
The age distribution of the resident population in a CCG is likely to impact on both the overall level of demand for health services and the type of health services required. Areas with a large percentage of older people in their population are likely to have different demands on health services than those with a predominantly younger population.
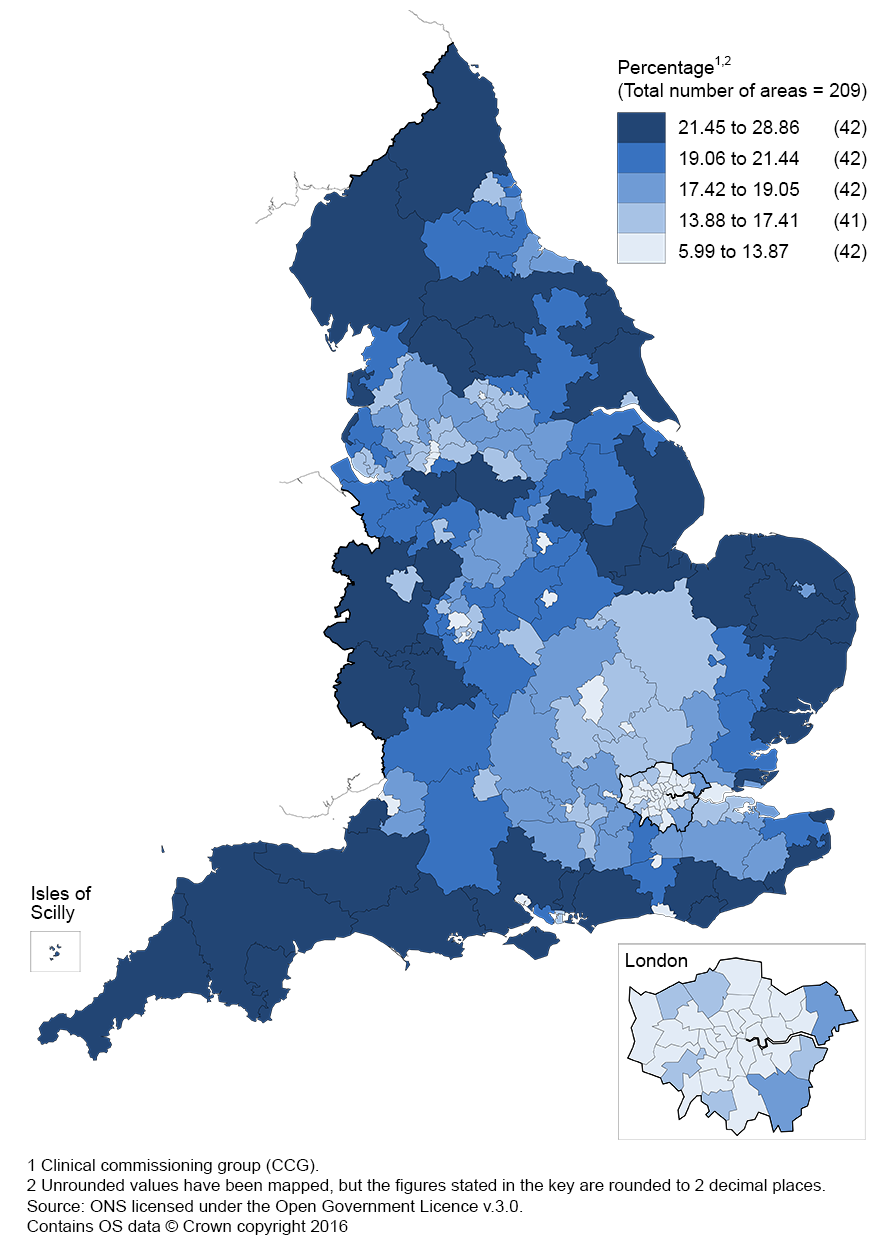
In mid-2015, of the population of England, 17.7% were aged 65 or over. By comparison, 28.9% of the population in NHS North Norfolk were aged 65 or over, closely followed by NHS Eastbourne, Hailsham and Seaford (26.7%). Figure 3 shows the percentage of the population aged 65 or over by CCG.
Figure 3: Percentage of population aged 65 or over, by CCG, England, mid-2015
Source: Office for National Statistics
Download this image Figure 3: Percentage of population aged 65 or over, by CCG, England, mid-2015
.png (386.7 kB)
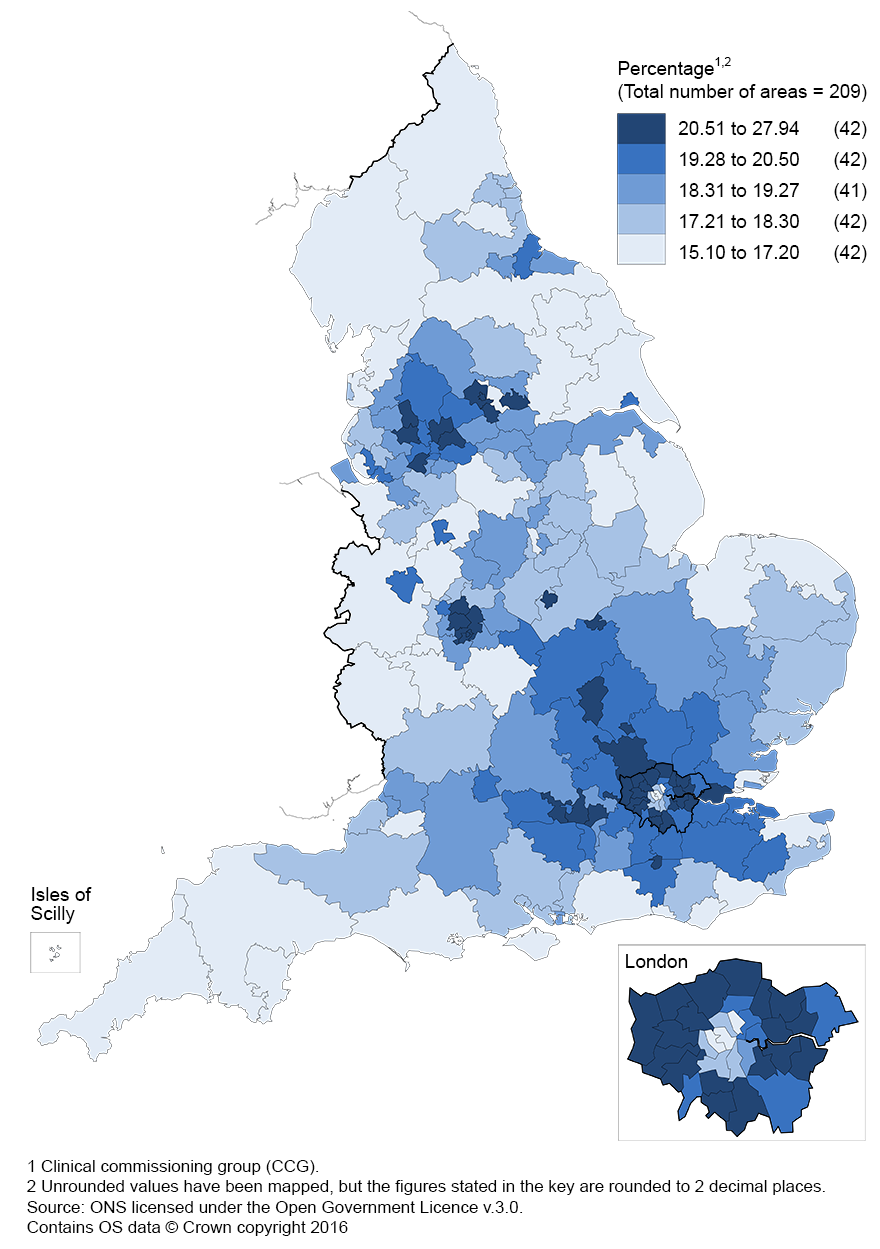
The percentage of the population who are children may also impact on requirements for health service provision. In mid-2015, of the population of England, 19% were aged 0 to 15. By comparison, 27.9% of the population in NHS Bradford City were aged 0 to 15, closely followed by NHS Barking and Dagenham (27.2%). Figure 4 shows the percentage of the population aged 0 to 15 by CCG.
Figure 4: Percentage of population aged 0 to 15, by CCG, England, mid-2015
Source: Office for National Statistics
Download this image Figure 4: Percentage of population aged 0 to 15, by CCG, England, mid-2015
.png (401.5 kB)
As shown in Figure 5, the large majority of CCGs (93.8%, including 3 new CCGs) had an annual population change of less than 2%, with 147 (70.3%) increasing or decreasing by less than 1% in the year to mid-2015.
Figure 5: Distribution of CCGs by population change, England, mid-2014 to mid-2015
Source: Office for National Statistics
Download this chart Figure 5: Distribution of CCGs by population change, England, mid-2014 to mid-2015
Image .csv .xls5. Westminster Parliamentary constituency population estimates – Experimental Statistics
Westminster Parliamentary constituencies are the areas used to elect Members of Parliament (MPs) to the House of Commons, the primary legislative chamber of the UK. The current boundaries were introduced for the May 2010 General Election and include 533 constituencies in England and 40 in Wales. Parliamentary constituency estimates are classified as Experimental Statistics.
At mid-2015, the mean population of Parliamentary constituencies in England and Wales was 101,022 with population sizes ranging from 58,618 in Aberconwy to 174,534 in West Ham. On average, English constituencies have larger populations than Welsh constituencies with mean populations of 102,789 and 77,477, respectively.
Annual population change
Figure 6: Percentage change in population, by Westminster parliamentary constituency, England and Wales, mid-2014 to mid-2015

Source: Office for National Statistics
Download this image Figure 6: Percentage change in population, by Westminster parliamentary constituency, England and Wales, mid-2014 to mid-2015
.png (592.0 kB)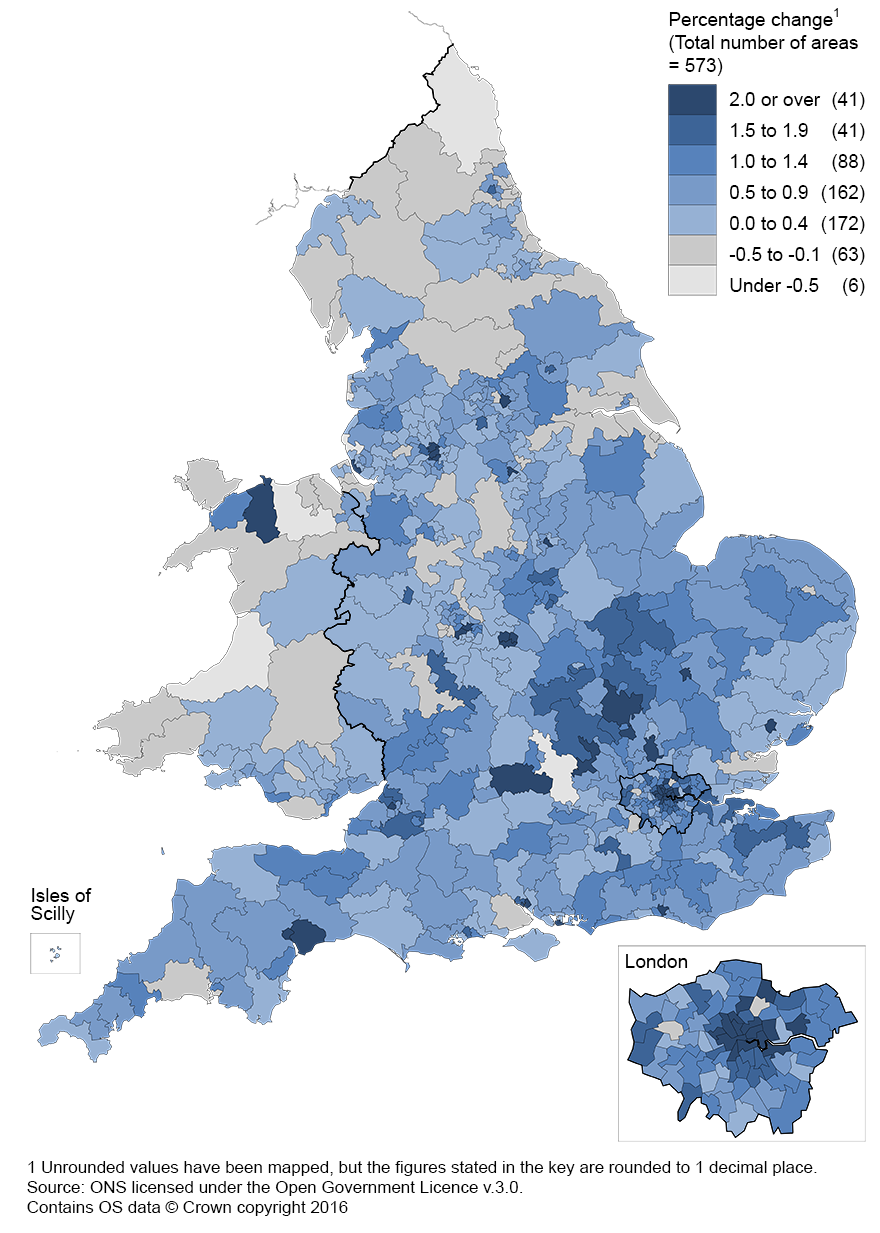
Parliamentary constituencies with the greatest increases in population over the 1 year period tend to be concentrated in London, the South East of England and city areas in the Midlands and north of England. The area with the greatest increase was West Ham constituency in London at 4.9%, while the area with the greatest increase outside of London was Liverpool, Riverside at 3.7%.
Population decreases at Parliamentary constituency level occur across the country, but are generally concentrated in the north of England and Wales, with the largest decrease (2.5%) in Clwyd West constituency.
Parliamentary constituencies are classified into 2 broad types of area: borough constituencies, which are defined as predominantly urban areas and county constituencies, which are partly or mostly rural areas. The designation of a constituency as either borough or county is made by the relevant Boundary Commission. Overall, 55% of constituencies are classified as county constituencies and 45% are classified as borough constituencies.
Voting age
In England and Wales in mid-2015, there were 45,579,669 persons aged 18 and over, making up 78.7% of the total usual resident population. In mid-2015, at Parliamentary constituency level, the percentage of the population aged 18 and over ranged from 66% in Birmingham, Hodge Hill to 87% in Liverpool, Riverside.
The population of voting age in a parliamentary constituency is not the same as the population who are entitled to vote, as it includes people who are not eligible to vote. For example, European Union citizens (excluding British Citizens; and Irish, Cypriot and Maltese citizens who are qualifying Commonwealth citizens) are not entitled to vote in Westminster Parliamentary elections, but are included in the population estimates if they are resident in the UK for 12 months or more.
Electoral statistics, providing counts of the number of persons registered to vote in each Parliamentary constituency, are available on our website.
Back to table of contents6. Electoral Ward population estimates – Experimental Statistics
Electoral wards are an important building block of UK administrative geography. They are the spatial units used to elect local government councilors in metropolitan and non-metropolitan districts, unitary authorities and London boroughs in England and unitary authorities in Wales. In some unitary authorities in England they are legally termed as “electoral divisions”, however, they are frequently referred to as wards and are referenced as such throughout this article. The 5 parishes of the Isles of Scilly are also treated as electoral wards for statistical purposes.
Electoral wards are subject to annual updates and boundary changes that make comparisons over longer periods more difficult. Mid-2015 population estimates are provided for 8,363 electoral wards in England and Wales as at 31 December 2015, excluding the 18 wards that do not meet the minimum population requirements for data confidentiality (40 resident households and 100 resident people in the 2011 Census). Electoral Ward estimates are classified as Experimental Statistics.
At mid-2015, the mean population of wards in England and Wales was 6,922. However, population sizes vary widely across the country ranging from 150 in St. Martin’s ward in the Isles of Scilly to 42,536 in Central ward in Sheffield. On average, wards in England have larger populations than those in Wales with mean populations of 7,294 and 3,637, respectively.
Annual population change
Figure 7 shows that the majority of wards (79.5%) had an annual population change of less than 2%, whereas 4,482 (53.6%) wards had a population change of less than 1% in the year to mid-2015. There were 269 wards which had an annual population change of more than 5% over the same period.
Figure 7 - Distribution of electoral wards by percentage change in total population estimate, mid-2014 to mid-2015
Source: Office for National Statistics
Download this chart Figure 7 - Distribution of electoral wards by percentage change in total population estimate, mid-2014 to mid-2015
Image .csv .xls7. National Park population estimates – Experimental Statistics
National Parks are designated areas of protected countryside aimed at conserving the natural beauty, wildlife and cultural heritage of the area. Each National Park has a National Park Authority (NPA) responsible for conservation, planning, recreation management and fostering the social and economic well-being of local communities.
The Broads does not have a National Park designation, but is included in this set of statistics, as it is part of the National Parks family. The Broads has similar responsibilities to NPAs, but with additional powers relating to navigation. In total there are 13 National Parks in England and Wales (including the Broads).
Figure 8: National Parks in England and Wales
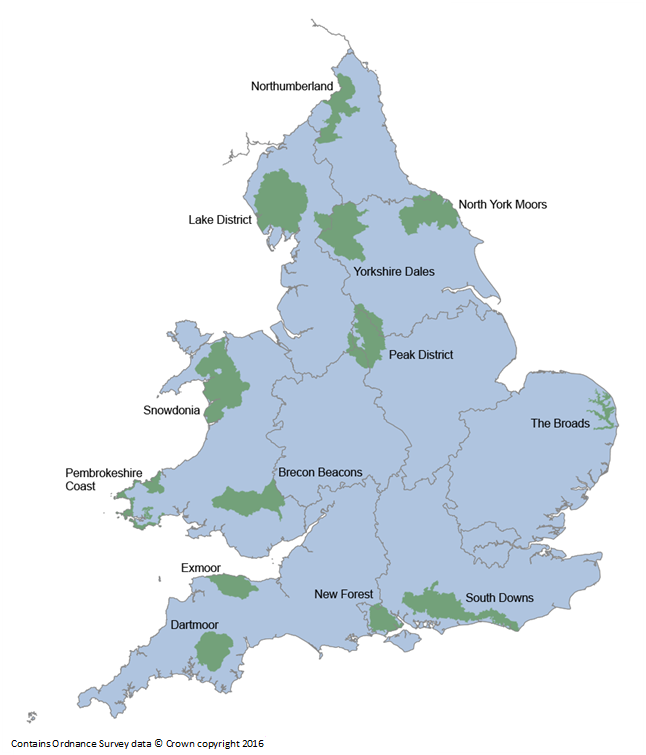
Source: Office for National Statistics
Download this image Figure 8: National Parks in England and Wales
.png (143.9 kB)
In mid-2015 the mean population size of National Parks in England and Wales was approximately 31,100. However, National Park population totals vary greatly, as shown in Figure 9. The most populous National Park, the South Downs, has 115,049 people compared with only 1,951 in Northumberland National Park. National Parks estimates are classified as Experimental Statistics.
Figure 9: National Park population estimates, England and Wales, mid-2015
Source: Office for National Statistics
Download this chart Figure 9: National Park population estimates, England and Wales, mid-2015
Image .csv .xlsAge distribution
National Parks have an older age structure than the wider population of England and Wales. In mid-2015, the median age for National Parks within England and Wales varied from 48.0 in the South Downs to 56.1 in Exmoor. In contrast, the median age for England and Wales as a whole was 39.9.
Figure 10 shows the percentage of the population of each National Park aged 65 and over, a figure which provides a reasonable proxy for the size of the population who are of retirement age. It shows that all 13 National Parks have a larger population aged 65 and over than England and Wales as a whole. In mid-2015, of the population of England and Wales, 17.9% were aged 65 and over, compared with 22.5% in Northumberland National Park and 33.4% in Exmoor and 32.7% in The Broads.
Figure 10: Percentage of National Park populations aged 65 and over, England and Wales, mid-2015
Source: Office for National Statistics
Download this chart Figure 10: Percentage of National Park populations aged 65 and over, England and Wales, mid-2015
Image .csv .xlsNational Parks' population density
Population density, that is. the number of people living per square kilometre, can be used to highlight how sparsely populated National Parks are in comparison with more urban population settlements.
In mid-2015, the population density of England and Wales was 383 persons per square kilometre. Northumberland National Park is the most sparsely populated area with a population density of 2 persons per square kilometre and the South Downs is the most densely populated area with 70 persons per square kilometre.
Table 1: National Parks population density, England and Wales, mid-2015
| Rank | National Park | Population Density |
| 1 | South Downs | 70 |
| 2 | New Forest | 63 |
| 3 | Pembrokeshire Coast | 39 |
| 4 | Dartmoor | 36 |
| 5 | Peak District | 26 |
| 6 | Brecon Beacons | 25 |
| 7 | The Broads Authority | 22 |
| 8 | Lake District | 18 |
| 9 | North York Moors | 16 |
| 10 | Exmoor | 15 |
| 11 | Snowdonia | 12 |
| 12 | Yorkshire Dales | 11 |
| 13 | Northumberland | 2 |
| 14 | England and Wales | 383 |
| Source: Office for National Statistics | ||
Download this table Table 1: National Parks population density, England and Wales, mid-2015
.xls (26.1 kB)8. Small area population estimates for other UK countries
Population estimates are produced for similar small areas in both Scotland and Northern Ireland, however, they are not produced using the same methodology as for small area population estimates in England and Wales.
National Records of Scotland (NRS) produce population estimates for Scottish data zones, which are slightly smaller areas than LSOAs, designed to contain approximately 500 to 1,000 household residents. NRS use a cohort component based method to produce estimates for data zones, further information on this methodology and the latest estimates (for mid-2015) are available from their website.
The Scottish data zones are used to produce population estimates for a range of other geographies including Westminster Parliamentary constituencies in Scotland, Scottish Parliamentary constituencies and Nomenclature of Units for Territorial Statistics (the statistical geography used by the European Union). These figures are available from the Special Area Population Estimates section of the NRS website.
The Northern Ireland Statistics and Research Agency (NISRA) publish population estimates for Super Output Areas in Northern Ireland. These are of similar size to English and Welsh LSOAs, with an average population of 2,100. NISRA uses a mixed methodology based on both cohort component and ratio change approaches. Further information and the latest estimates published for mid-2015 are available from the NISRA website. Population estimates for wards, Neighbourhood Renewal Areas and Census Small Areas in Northern Ireland are also available.
A paper, Small Area Population Estimates across the UK which provides a broad description of the different methodologies used to produce small area population estimates in each constituent country of the UK, is also available on the NISRA website.
Back to table of contents9. Where can I find other information?
This statistical bulletin is part of our Annual Small Area Population Estimates: mid-2015. The publication includes:
- population estimates for lower and middle layer Super Output Areas (LSOAs and MSOAs) in England and Wales: estimates for LSOAs by broad ages and MSOAs by 5 year age groups (quinary age) hold National Statistics status - estimates at a greater level of disaggregation by age including quinary age for LSOAs and single year of age for both SOAs are supporting information only - more information can be found in Small Area Population Estimates: Summary of methodology review and research update.
- population estimates for electoral wards, Westminster Parliamentary constituencies and National Parks in England and Wales – these products are classified as Experimental Statistics
- population estimates for health geographies in England (clinical commissioning groups (CCGs), NHS Region Geography and NHS Commissioning Regions) – these products are also classified as National Statistics
These estimates are consistent with the results of the 2011 Census and are provided for the latest official geographic boundaries in place at the reference date.
Back to table of contents10. Quality and Methodology
The Small area population estimates Quality and Methodology Information document contains important information on:
- the strengths and limitations of the data
- the quality of the output: including the accuracy of the data and how it compares with related data
- uses and users
- how the output was created
Quality Management Information details a range of information about the background, quality, methods and quality assurance of the small area population estimates; this includes additional information on concepts, strengths and limitations, user needs and links to further advice about the output.
A methodology note on production of small area population estimates details the data sources and methodology applied to producing the England and Wales small area population estimates.
The report Small Area Population Estimates (SAPE) Evaluation: Report on Accuracy Compared to Results of the 2011 Census presents research that evaluates the accuracy of the Small Area Population Estimates to inform their broad variety of users. The report also fulfils the commitment to analysis planned after the 2011 Census.
Back to table of contents