Table of contents
- Executive Summary
- Introduction and scope
- Background
- Explaining the differences in what the IPS and APS tell us about non-EU migration
- Explaining the differences in what the IPS and APS tell us about EU migration
- Adjusting migration estimates to take account of uncertain intentions – what does this show?
- Next steps
- Annex A – Impact of survey biases, weighting and changes in occupancy
- Annex B – Preliminary adjustment: non-EU migrants
- Annex C – The impact of communal establishments on how we account for deaths in this analysis
- Annex D – International Passenger Survey: length of stay
- Annex E – Preliminary adjustment: EU migrants
1. Executive Summary
Our research has clearly shown that no single source of data can fully reflect the complexity of migration. However, when we look at all available sources together it provides a much clearer picture.
This report provides the latest update on our work to transform the way we produce population and migration statistics, to better meet the needs of our users. It sets out how we can draw on the combined strengths of survey and administrative sources to provide a better understanding of international migration. Our latest research builds on the progress report published in June 2019, which investigated the divergent patterns in what the International Passenger Survey (IPS) and the Annual Population Survey (APS) tell us about migration. It also draws on our previous research reports, which utilised administrative data to provide additional insights on aspects of migration.
Bringing these research findings and the available data sources together, we make preliminary adjustments to our previously published headline measures of migration to provide our best possible assessment of trends over time. These preliminary adjustments will also be reflected in the latest estimates in the Migration Statistics Quarterly Report, published tomorrow (22 August 2019).
Main points from our research
Understanding migration survey sources
When we look over an extended time period (2005 to 2018), there is a divergence in what the International Passenger Survey (IPS) and Annual Population Survey (APS) tell us about long-term international migration in the UK. Our progress report showed that, while for overall international migration the long-term trends are similar, the yearly change in the EU-born population (as measured by the APS) tends to be larger than EU net migration (as measured by the IPS) – whilst the opposite is true for non-EU migration. As we said previously, caution should also be taken when using the APS to measure migration since changes in population between two points in time show the net effect of all population changes, rather than just migration, and are subject to relatively large levels of uncertainty.
Definitional and survey differences – including coverage of communal establishments and deaths – only explains part of this divergence. While patterns are similar in both surveys for many country groups, our research found divergences between the sources in EU migration driven primarily by different patterns for the central and eastern European (EU8) countries and divergences for non-EU migration driven primarily by different patterns for Asian countries.
The most likely cause of the remaining divergence is the impact of certain groups having a higher degree of uncertainty in their intentions to move to and from the UK. This makes it more challenging to measure migration using traditional methods such as the IPS, where our estimates are dependent on the information people give us about how long they intend to move to and from the UK for. Evidence from the Survey of Graduating International Students (SoGIS) showed that students tend to have a high degree of uncertainty about what they will do after completing their studies. Similarly, we have found that respondents to the IPS from the EU8 who indicate they intend to stay over three months are twice as likely to be uncertain about exactly how long they intend to stay compared with all individuals who intend to stay three months or longer. In addition, our previous research into circular (repeated) travel patterns showed the complexity of the journeys people make into and out of the UK, which may also contribute to the differences between sources.
Using all available sources to make the best possible assessment of migration
To get the best overview of trends in migration, we need to look at all available data sources. To help address the impact of uncertain intentions for non-EU students at the end of their studies and for EU8 nationals moving to the UK, we apply preliminary adjustments to our IPS estimates based on data from the Home Office and Department for Work and Pensions – which tell us about people’s actual behaviour. Our approach to these adjustments builds on our previous research, including our 2016 report exploring the relationship between IPS estimates and National Insurance number registrations, our 2017 report using Home Office data to build a better understanding of international student migration and our 2018 report comparing IPS-estimates with Home Office data for non-EU migration. We consider the overall impact on net migration estimates, including for EU and non-EU migration separately.
Overall, we find these preliminary adjustments only have a small impact on UK net migration and the trends we see over time are largely unchanged (Figure 1), giving us confidence in our previous headline estimates. For example, in the year ending March 2016 – where we have adjusted data for both inflow and outflow – net migration is around 1% higher than our published estimate. This is because the adjustments to the EU and non-EU figures broadly cancel each other out in the overall adjusted net migration estimates. Following 2016, where we have applied a preliminary adjustment to non-EU only, our best assessment of net migration is that migration is still adding to the UK population but this may be slightly lower than our published estimates.
Figure 1: Long-Term International Migration, UK, with preliminary adjustment, year ending June 2009 to year ending December 2018
Source: Office for National Statistics – Long-Term International Migration
Notes:
- The dotted lines are preliminary estimates to adjust for uncertain intentions for EU8 citizens immigrating and non-EU former students emigrating. Preliminary adjustments for EU8 citizens have been applied from year ending June 2009 to year ending March 2016; for non-EU students have been applied from year ending December 2012 to year ending December 2018; and for net migration year ending March 2012 to year ending December 2018.
- The 2011 Census adjustments have always been applied to net migration.
Download this chart Figure 1: Long-Term International Migration, UK, with preliminary adjustment, year ending June 2009 to year ending December 2018
Image .csv .xls
EU migration
For EU migration, we have made a preliminary adjustment up to March 2016, which draws on the strengths of what the Department for Work and Pensions data tell us about immigration from EU8 countries. At this early stage in our understanding, our research indicated that we should apply an adjustment to immigration estimates before 2016, to reflect migrants’ uncertain intentions on their likely length of stay in the UK. From 2016, we begin to see different relationships across our available sources, including the IPS and APS, suggesting that the impact of uncertain intentions on the IPS has potentially changed and may now be influencing both immigration and emigration. We also see from that point the trend in net migration from EU8 countries falling, whereas previously it had been increasing or stable. These different emerging patterns mean that without further data, particularly for emigration, we do not have enough evidence on which to base an adjustment after that point. Therefore, our best assessment of EU net migration since 2016 is that it is still adding to the population, although other sources suggest that the IPS may be a slight overestimate.
Our adjusted EU net migration estimates show a very similar trend over time but are consistently higher than the unadjusted estimates (Figure 2), indicating that we may have been underestimating net migration from the EU. In the year ending March 2016 – the latest point at which we have adjusted data available – EU net migration is around 16% higher than our published estimate.
Figure 2: EU Long-Term International Migration, UK, with preliminary adjustment, year ending June 2009 to year ending December 2018
Source: Office for National Statistics – Long-Term International Migration
Notes:
- The dotted lines are preliminary estimates to adjust for uncertain intentions for EU8 citizens immigrating. These preliminary adjustments have been applied from year ending June 2009 to year ending March 2016.
- The 2011 Census adjustments have always been applied to net migration.
Download this chart Figure 2: EU Long-Term International Migration, UK, with preliminary adjustment, year ending June 2009 to year ending December 2018
Image .csv .xls
Non-EU migration
- For non-EU migration, we have applied a preliminary adjustment up to 2018, drawing on the strengths of what Home Office data tell us about emigration of non-EU students. Our adjusted non-EU net migration estimates also show a very similar trend but are consistently lower than unadjusted estimates (Figure 3), indicating that we may have been overestimating net migration from outside the EU. In the year ending March 2016, net migration is around 13% lower than our published estimate. In the year ending December 2018, this is around 8% lower.
Figure 3: Non-EU long-term international migration, UK, with preliminary adjustment, year ending June 2009 to year ending December 2018
Source: Office for National Statistics – Long-Term International Migration
Notes:
- The dotted lines are preliminary estimates to adjust for uncertain intentions for non-EU former students emigrating. These preliminary adjustments have been applied from year ending December 2012 to year ending December 2018.
Download this chart Figure 3: Non-EU long-term international migration, UK, with preliminary adjustment, year ending June 2009 to year ending December 2018
Image .csv .xls
Next steps
This work has shown the importance of our transformation programme in providing the best possible assessment of international migration based on all available sources.
As new data sources become available, we will build on our research so far and continue to develop our approach for adjusting the IPS estimates to take account of uncertain intentions. This includes strengthening our understanding of changes to patterns since 2016. Working across the Government Statistical Service (GSS), we will investigate whether there are other available administrative data sources that provide further evidence to refine our preliminary adjustments.
As set out in our transformation overview, we will continue to publish the findings from our research on an iterative basis and look to embed these in our regular Migration Statistics Quarterly Report (MSQR) to provide the best possible assessment of the latest trends in migration.
Whilst we go through this transformation journey, we have sought to re-classify our migration statistics as "Experimental Statistics" in line with Office for Statistics Regulation guidance. Re-classifying to Experimental Statistics supports this period of development and innovation and will be reflected in the latest MSQR published tomorrow (22 August 2019).
We expect our current work programme to be complete by this time next year when we will seek re-designation to National Statistics status.
Back to table of contents2. Introduction and scope
This report provides the latest update on our work to transform the way we produce population and migration statistics, to better meet the needs of our users. It sets out the conclusions of our research into the coherence of migration data sources, including the International Passenger Survey (IPS) and Annual Population Survey (APS), and follows on from our June 2019 progress report.
We begin by setting out the background to this work (see Section 3), including what our previous research told us about the differences between what the IPS and the APS tell us about migration and how this varies for non-EU and EU groups.
We then summarise the findings of our latest research, which explores these differences in more detail and the possible reasons for them. Section 4 and 5 set out our findings for non-EU migration and EU migration respectively, including our understanding of how uncertainty in people’s intentions to move to or from the UK may impact on our IPS-based migration estimates. We also discuss our analysis of migration patterns using administrative data from the Home Office and Department for Work and Pensions (DWP).
Section 6 goes on to discuss how, taking all the evidence from available data sources, we have developed preliminary adjustments that we can apply to our IPS-based migration estimates. These help us to take account of uncertain intentions for non-EU students and migrants from EU8 countries.
We also know that, as new data sources become available, we can continue to refine our adjustment approach in future. Section 7 summarises our next steps and how we will continue to publish the findings from our research as we make further developments.
Alongside this report, we have also updated our transformation overview, which provides further background on our population and migration statistics transformation journey alongside links to previously published articles.
Back to table of contents3. Background
Understanding the differences between migration data sources has been an important part of our research over the last few years to better understand UK migration. This section sets out the broader context for our research and summarises the main findings from our previous reports on this topic.
In December 2016, we published an article explaining the definitional differences between the different data sources that measure international migration to and from the UK. The Office for National Statistics (ONS) produces several series of statistics on international migration:
those that provide information on the flow (or movement) of international migrants – the International Passenger Survey (IPS), which collects data about how long respondents say they intend to be in or out of the UK
those that estimate the stock (or resident population) of non-UK born people or nationals living in the UK – the Annual Population Survey (APS), which collects data from UK households
In August 2017 and July 2018, we published research using Home Office administrative data to build a better understanding of international student migration and how our overall IPS-based international migration estimates compared with what Home Office data told us about people’s travel patterns. The 2018 report included the findings of an initial review into our current “switcher” methodology, which aims to adjust our IPS-based estimates of international migration to take account of the fact that people’s actual behaviour may not match their intentions, as recorded by the IPS.
All of our research using administrative data told us that people’s lives are complex and that no single source of information can fully reflect this complexity. However, when we look at all the sources together it provides a much clearer picture.
We provided an update on this research and our overall population and migration transformation journey in January 2019, where we asked users for feedback on our approach towards putting administrative data at the core of our statistics in future. We followed this with a workplan in February 2019 covering more detail on our plans to investigate and better understand the reasons for the differences between migration data sources.
In May 2019, we held a workshop with main stakeholders to discuss our initial findings and gather their views on the work so far and the next steps to take. This workshop helped us shape the research ahead of our June 2019 progress report in which we reported the following main findings:
our exploration of the definitional differences between the sources suggest that they do contribute to the divergent patterns we can see but that they are not sizeable enough to fully explain them
there are many country groups for which the change in the APS stocks and Long-Term International Migration (LTIM) net migration are showing similar patterns and the small differences seen are likely to be due to definitional and survey design differences; however, for a few groups there are larger differences that require further investigation
within EU migration the divergence between the two sources is driven primarily by those from central and eastern European (EU8) countries, where the annual change in the APS stocks is much higher than LTIM net migration as estimated by the IPS
within non-EU migration the divergence between the two sources is driven primarily by those from Asia where the annual change in the APS stocks is much lower than LTIM net migration as estimated by the IPS
In theory, the change in the number of non-UK born people living in the UK from year-to-year should be close to the net flow of non-UK born people into the UK. However, while both the IPS and APS have value, they are not directly comparable in this way as they have fundamental coverage and sampling differences. They are designed to measure different aspects of migration, in different ways, based on different types of data, and neither has complete coverage.
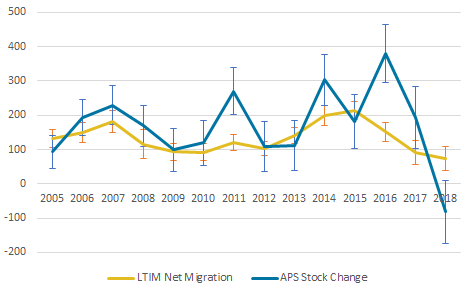
Our June report showed that when comparing the annual change in stocks as reported by the APS and the LTIM net flows for the non-UK population over an extended time period (2005 to 2018) there is a discrepancy in the two series (Figures 4 and 5). The annual changes in non-UK APS stocks show a highly variable pattern when compared with the more stable LTIM net migration.
For EU migrants, whilst in most years the yearly change in the APS stocks is higher than LTIM net migration, in 2018 the pattern is different. For non-EU migrants, in most years the yearly change in the APS stocks is lower than LTIM net migration.
Figure 4: Comparison of LTIM net migration estimates and the annual change in the APS estimates of the population, EU-born population, 2005 to 2018
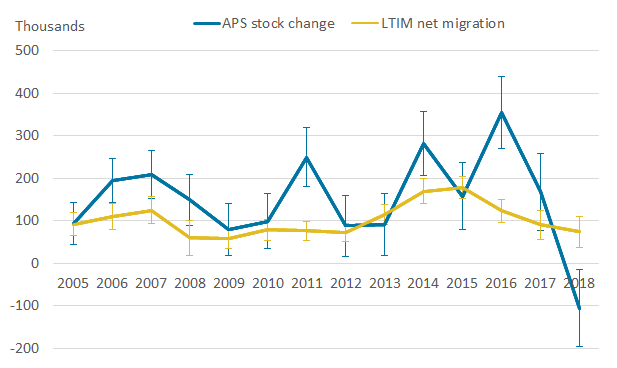
Source: Office for National Statistics – International Passenger Survey, Annual Population Survey
Notes:
- For 2018 LTIM migration, nationality has been used instead of country of birth as a proxy, country of birth data are not due to be published until November 2019.
- 2018 data are provisional.
Download this image Figure 4: Comparison of LTIM net migration estimates and the annual change in the APS estimates of the population, EU-born population, 2005 to 2018
.png (15.1 kB) .xls (65.0 kB)
Figure 5: Comparison of LTIM net migration estimates and the annual change in the APS estimates of the population, non-EU born population, 2005 to 2018

Source: Office for National Statistics – International Passenger Survey, Annual Population Survey
Notes:
- For 2018 LTIM migration, nationality has been used instead of country of birth as a proxy, country of birth data are not due to be published until November 2019.
- 2018 data are provisional.
Download this image Figure 5: Comparison of LTIM net migration estimates and the annual change in the APS estimates of the population, non-EU born population, 2005 to 2018
.png (17.8 kB) .xls (66.0 kB)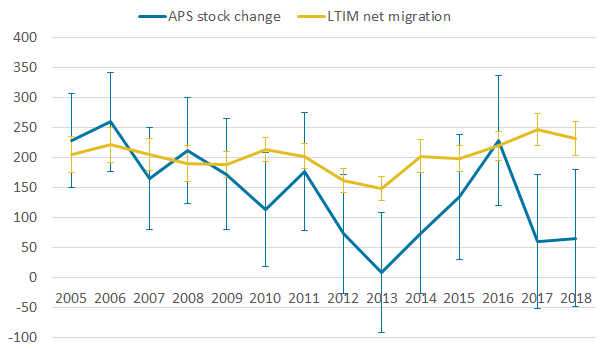
Over time, the year-on-year differences between the two sources accumulate meaning the cumulative long-term differences gradually increase. Figure 6 shows between 2005 and 2018, the cumulative change in the APS stocks for EU migrants is much higher than LTIM net migration and for non-EU migrants the cumulative change in the APS stocks are much lower than LTIM net migration.
Some of these differences will be explained by the different definitions used in the two sources and the way each survey collects the data. However, while there are several areas of survey methodology that may impact differentially on different country of birth groups, our research suggests that none of these impact in a systematic way that would cause the differences we observe between the IPS and the APS. Annex A provides further detail on our exploration of the impact of the survey methodology.
Figure 6: Cumulative APS stock change and LTIM net migration, non-UK country of birth, 2005 to 2018
Source: Office for National Statistics – International Passenger Survey, Annual Population Survey
Notes:
- For 2018 LTIM migration, nationality has been used instead of country of birth as a proxy, country of birth data are not due to be published until November 2019.
- 2018 data are provisional.
Download this chart Figure 6: Cumulative APS stock change and LTIM net migration, non-UK country of birth, 2005 to 2018
Image .csv .xls4. Explaining the differences in what the IPS and APS tell us about non-EU migration
This section covers our latest research into non-EU migration, exploring comparisons between the International Passenger Survey (IPS) and Annual Population Survey (APS) and what may be causing the differences between what they tell us about international migration. This includes the impact of adjusting for definitional differences, alongside assessing what we know from our previous research into these sources and from administrative data collected by other government departments.
How do definitional differences between the surveys impact on non-EU estimates?
The yearly change in the APS stocks do not account for the deaths of non-UK born migrants. In 2018, around 30,000 non-EU born people died, so to make the yearly change in the APS stocks comparable with IPS net migration, the APS estimates will need to be adjusted to account for these deaths (Table 1).
| Country of birth | Year | |||||||||||
|---|---|---|---|---|---|---|---|---|---|---|---|---|
| 2007 | 2008 | 2009 | 2010 | 2011 | 2012 | 2013 | 2014 | 2015 | 2016 | 2017 | 2018 | |
| Non-EU | 22,706 | 23,775 | 23,610 | 24,024 | 23,831 | 25,493 | 26,145 | 27,006 | 29,326 | 29,662 | 30,605 | 31,771 |
Download this table Table 1: Deaths registered in England, Wales, Scotland and Northern Ireland, 2007 to 2018 by non-EU country of birth
.xls .csvFigure 7 shows a comparison between Long-Term International Migration (LTIM) and the net change in the APS after it has been adjusted for these deaths. This shows that the cumulative gap in 2018 was around 550,000 after adjustment compared with around 870,000 before adjustment. So, while this clearly does not explain the full extent of the cumulative gap over time, it does have an impact.
Figure 7: Comparison of cumulative LTIM net migration estimates and annual differences in APS estimates of the population with adjusted deaths, non-EU born population, 2005 to 2018
Source: Office for National Statistics – International Passenger Survey, Annual Population Survey
Notes:
- For 2018 LTIM migration, nationality has been used instead of country of birth as a proxy, country of birth data are not due to be published until November 2019.
- 2018 data are provisional.
- The APS annual differences have had deaths added.
Download this chart Figure 7: Comparison of cumulative LTIM net migration estimates and annual differences in APS estimates of the population with adjusted deaths, non-EU born population, 2005 to 2018
Image .csv .xlsNon-EU students in the UK may live in halls of residence that are not covered by the APS. However, students are included in the estimate of net migration from LTIM. An increase in the number of students in halls of residence will impact on the cumulative net migration figure but will not impact on the APS net change. Therefore, this adjustment would further close the gap between the two sources.
Table 2 shows how non-EU student numbers in halls of residence have changed since 2011. In 2017 to 2018 there were over 46,000 more non-EU students in halls of residence than in 2011 to 2012.
| 2011 to 2012 | 2012 to 2013 | 2013 to 2014 | 2014 to 2015 | 2015 to 2016 | 2016 to 2017 | 2017 to 2018 | Increase from 2011 to 2012 to 2017 to 2018 | |
|---|---|---|---|---|---|---|---|---|
| Non-EU | 111,445 | 124,910 | 136,090 | 138,360 | 139,520 | 144,755 | 157,850 | 46,405 |
Download this table Table 2: Number of places in communal establishments by country of domicile, Higher Education Statistics Agency (HESA)
.xls .csvAdjusting the cumulative comparison between the IPS and APS for both deaths and students in halls of residence leaves a cumulative gap of around 500,000, which is unexplained.
Understanding non-EU migration data in the APS
To help understand how the APS picks up the non-EU born population it is helpful to do some further comparisons between the IPS and APS.
Comparing the IPS inflow estimates with those in the APS who said they arrived in the previous year shows that for non-EU migrants the two series were showing similar patterns up to 2012, although the APS was lower than the IPS (Figure 8).
Since 2012, the two series were more variable, with the APS being higher than the IPS in 2013, 2015 and 2016. The APS inflow estimates would be expected to be lower than the IPS estimates due to students in communal establishments who would not be captured by the APS.
Figure 8: IPS inflow and APS inflow for those who arrived in the previous year, non-EU born population, 2007 to 2018
Source: Office for National Statistics – International Passenger Survey, Annual Population Survey
Notes:
- For 2018 LTIM migration, nationality has been used instead of country of birth as a proxy, country of birth data are not due to be published until November 2019.
- 2018 data are provisional.
- APS inflow estimates are based on previous year of arrival.
Download this chart Figure 8: IPS inflow and APS inflow for those who arrived in the previous year, non-EU born population, 2007 to 2018
Image .csv .xlsThe APS asks respondents for their latest year of arrival. We can look at how the cohort that arrived in a particular year changed over time. In theory, in each survey year, each year of inflow cohort should decrease as people subsequently leave. Looking at the non-EU cohort the pattern is as would be expected, where in each survey year the cohort decreases (Figure 9).
For example, for the cohort that arrived in 2010 we would expect the number remaining in the UK to gradually fall over time as they leave. If they left (say in 2013) and then later returned (say in 2016) they would join the 2016 cohort as this would be their latest year of arrival.
Figure 9: APS population of the UK by year of latest arrival, total non-EU born population, 2008 to 2018
Source: Office for National Statistics – Annual Population Survey
Download this chart Figure 9: APS population of the UK by year of latest arrival, total non-EU born population, 2008 to 2018
Image .csv .xlsWhat do other data sources tell us?
We can see that adjusting for definitional differences closes the gap partially, however, we have looked at other sources of data to help us understand why there is a remaining gap.
In July 2018, we published research comparing IPS and visa data for non-EU migrants (also referred to as “Home Office administrative data”).
As our analysis throughout that report showed, we can compare results from individual sources, however, these data sources are not capturing the same information in the same way and are not used for the same purpose. The IPS is an intentions-based survey, capturing the intentions of a sample of people arriving and departing the UK. In comparison, the Home Office administrative data included within this report are based on actual travel patterns of migrants in the UK on visas, and different definitions are possible.
For example, visa length as used in our report in August 2017, or first assumed arrival and last assumed departure, to determine whether they are long- or short-term migrants. Intentions do not necessarily reflect actual behaviour and may not neatly fit into our definitions of a long-term or short-term migrant either.
Figure 10 illustrates the differences between the measures of migration derived from Home Office administrative data and the IPS figures. These differences may be due to the type of data collected (intentions compared with travel details used for operational purposes), the way it is collected (a face-to-face sample survey versus an operational system with data supplied by air, rail and sea carriers), the quality of the two data sources, and in the assumptions made to process these data.
Figure 10: Preliminary Home Office administrative data results compared with IPS data – long-term migration, UK, 2016 to 2017
Source: Office for National Statistics analysis of Home Office administrative data and International Passenger Survey (IPS) data
Notes:
- ONS analysis using methodology detailed within the Report on international migration data sources: July 2018 (first arrival and last departure date where available, otherwise visa length for work, study, family and other types of visa or permission to stay in the UK).
- Comparisons of the Home Office administrative data and IPS estimates illustrate that there are differences between the measures of migration available from the two sources; for example, in the: data being collected (intentions vs operational travel details); way it is collected (face-to-face survey vs operational systems); quality (both sources will include unit and item non-response or recording errors, IPS estimates will include sampling error whilst administrative data is affected by the processes from which the data is obtained); and assumptions made to process the data. Neither source directly measures whether an individual is usually resident whilst in the UK or elsewhere.
- All numbers are rounded to the nearest thousand. Totals may not sum due to rounding.
Download this chart Figure 10: Preliminary Home Office administrative data results compared with IPS data – long-term migration, UK, 2016 to 2017
Image .csv .xlsThis analysis also gives confidence in the overall inflow numbers collected by the IPS but highlighted that the IPS may be missing some departures by non-EU migrants. The work we undertook in August 2017 on international students studying in the UK demonstrated that many people do not simply immigrate for study and leave afterwards; their lives are more complex. For example, some people may arrive on a study visa and then switch to a work visa route. We also saw that people are often travelling back to their home countries during breaks and holidays, and so may not accurately recall their original timing or reason for coming to the UK or fail to be picked up as a long-term migrant.
Our Survey of Graduating International Students (SoGIS) (PDF, 1.3MB) showed that for many students, they have a high degree of uncertainty about what they will do after completing their studies. This makes measuring the intentions for this group more challenging. Our comparison of Home Office administrative data with intentions reported in the SoGIS by non-EU graduating students departing the UK, confirmed that a lower proportion of departing students in the Home Office administrative data returned within 12 months (6%) compared with the proportion (28%) who reported such an intention1 on departing the UK.
Adjusting migration estimates using Home Office administrative data
To help us understand the remaining non-EU gap we have used administrative data from the Home Office to compare the results from the IPS and APS. For non-EU citizens we have focused only on the student series as this is where our previous work highlighted the largest discrepancy, and we have evidence of uncertain intentions being a potential contributing factor.
As can be seen previously, adjusting for the definitional differences does not fully explain the gap. Along with this and the previous research on students where we highlighted that the IPS may be missing some departures by non-EU migrants we have used Home Office administrative data (Exit Checks – see Annex B for further details) to create a preliminary non-EU adjustment for students.
To more closely align the IPS former student outflow estimate we applied the following preliminary adjustment. Taking the IPS student inflow estimate and given we know that many students will not emigrate that same year, we have used Higher Education Statistics Agency (HESA) data to calculate preliminary proportions of first-year students who expect to leave the UK after a year and those who expect to leave after more than one year. Exit Checks data were then used to identify the proportion of students who departed the UK long-term after completing their studies. For each relevant year both proportions were applied in turn to the IPS inflow estimate to derive an adjusted estimate of IPS former student outflow.
Given the data we have available, the preliminary adjustment has been calculated from year-ending December 2012 to year-ending December 2018. Full details of this method can be found in Annex B. There are limitations to this method, which will be explored further as we refine this non-EU preliminary adjustment as part of the transformation programme in conjunction with our colleagues across the Government Statistical Service (GSS).
Section 6 sets out the impact of making this preliminary adjustment for non-EU students on the migration estimates.
Conclusion
In summary the analysis shows that the definitional differences – deaths and students in halls of residence – account for some, but not all of the difference we can see between the IPS and the APS. A comparison of the inflow data from both the IPS and APS does not suggest a clear issue with the inflow from either source. A further comparison of the inflow between the IPS and Home Office administrative data supports this. Analysis of how the year of arrival cohorts behave in the APS are also as expected.
However, comparison of the IPS outflow data with Home Office administrative data suggests that the IPS may be undercounting students emigrating from the UK, which evidence from SoGIS suggests may be because students are a group that are very uncertain about their migration intentions post-graduation.
In July 2018, we made an illustrative adjustment to student inflow data for 2016 where we identified that the IPS had appeared to miss some non-EU students arriving in the UK when compared with student visa data for the same period. After further work we made an official adjustment to the LTIM series to apply this as a correction.
Our research has shown that no single data source can give a full reflection of international migration, and we need to therefore draw upon all available sources to make our best assessment. We therefore believe that it is appropriate to publish a preliminary adjustment to the non-EU student outflow series to improve the way we correct for uncertain intentions and have set out an initial method for this which will be developed as we take forward the transformation programme. Section 6 shows how this impacts through into LTIM and what the comparisons with the APS look like after applying the adjustments for differences in definitions and the preliminary adjustment to account for uncertain intentions of departing non-EU students.
Notes for: Explaining the differences in what the IPS and APS tell us about non-EU migration
- Proportion in the Survey of Graduating International Students (SoGIS) who stated that they were unsure how long they would be out of the UK or that they intended to return within 12 months.
5. Explaining the differences in what the IPS and APS tell us about EU migration
This section covers our latest research into EU migration, exploring comparisons between the International Passenger Survey (IPS) and Annual Population Survey (APS) and what may be causing the differences between what they tell us about international migration. This includes the impact of adjusting for previous coverage issues and definitional differences, alongside assessing what we know from our previous research into these sources and from administrative data collected by other government departments.
How does applying a census adjustment to the IPS impact on the differences between the surveys?
In 2012, we published a report, Quality of Long-Term International Migration estimates from 2001 to 2011 (PDF, 1MB), outlining the methods used to revise the national population estimates between mid-2002 and mid-2010. A reconciliation exercise carried out in light of the 2011 Census found a difference of 464,000 between the census population estimate and the rolled forward mid-year population estimates. It was found that the single largest cause of this is likely to be the underestimation of long-term immigration from central and eastern Europe (EU8 countries) in the middle part of the decade.
This was due to limitations in the coverage of the IPS at this time where it did not cover some regional airports such as Stansted and Luton. The 2012 report Methods used to revise the national population estimates for mid-2002 to mid-2010 (PDF, 171KB) estimated that this accounted for 250,000 of the difference and estimated the distribution of this difference over time. With this adjustment applied to the cumulative LTIM net migration for the EU8 country group, the gap between LTIM net migration and the change in the APS stocks slightly narrows (Figure 11). This shows that the cumulative gap in 2018 was around 435,000 after the 2011 Census adjustments compared with around 685,000 before adjustments.
Figure 11: Comparison of cumulative adjusted (for EU8 undercount up to 2011) LTIM net migration estimates and annual differences in APS estimates of the population, EU born population
2005 to 2018
Source: Office for National Statistics – International Passenger Survey, Annual Population Survey
Notes:
- For 2018 LTIM migration, nationality has been used instead of country of birth as a proxy, country of birth data are not due to be published until November 2019.
- 2018 data are provisional.
Download this chart Figure 11: Comparison of cumulative adjusted (for EU8 undercount up to 2011) LTIM net migration estimates and annual differences in APS estimates of the population, EU born population
Image .csv .xlsHow do definitional differences between the surveys impact on EU estimates?
The yearly change in the APS stocks do not account for the deaths of non-UK born migrants. In 2018, around 23,000 EU born people died, so to make the yearly change in the APS stocks comparable with IPS net migration, the APS estimates will need to be adjusted to account for these deaths (Table 3).
| Country of birth | Year | |||||||||||
|---|---|---|---|---|---|---|---|---|---|---|---|---|
| 2007 | 2008 | 2009 | 2010 | 2011 | 2012 | 2013 | 2014 | 2015 | 2016 | 2017 | 2018 | |
| EU | 20,233 | 20,708 | 20,029 | 20,275 | 19,975 | 20,847 | 20,971 | 21,041 | 22,371 | 22,356 | 22,500 | 22,707 |
Download this table Table 3: Deaths registered in England, Wales, Scotland and Northern Ireland, 2007 to 2018 by EU country of birth
.xls .csvFigure 12 shows a comparison between Long-Term International Migration (LTIM) and the net change in the APS after it has been adjusted for these deaths. This shows that the cumulative gap in 2018 was around 940,000 after adjustment compared with 685,000 before adjustment. The impact of deaths widens the gap for EU born.
However, in 2011 there were around 9,000 EU born over the age of 75 years living in medical and care-related communal establishments (for example, care homes) as shown in Annex C, therefore we would expect that some of the deaths would be attributed to the EU born communal population, and that this adjustment for the household population is slightly overestimated.
Figure 12: Comparison of cumulative LTIM net migration estimates and annual differences in APS estimates of the population with adjusted deaths, EU born population, 2005 to 2018
Source: Office for National Statistics – International Passenger Survey, Annual Population Survey
Notes:
- For 2018 LTIM migration, nationality has been used instead of country of birth as a proxy, country of birth data are not due to be published until November 2019.
- 2018 data are provisional.
- The APS annual differences have had deaths added.
Download this chart Figure 12: Comparison of cumulative LTIM net migration estimates and annual differences in APS estimates of the population with adjusted deaths, EU born population, 2005 to 2018
Image .csv .xlsEU students in the UK may live in halls of residence that are not covered by the APS. However, students are included in the estimate of net migration from LTIM. An increase in the number of students in halls of residence will impact on the cumulative net migration figure but will not impact on the APS net change. This means we need to make an adjustment to take this into account.
Table 4 shows how EU student numbers in halls of residence have changed since 2011. In 2017 to 2018, there were around 7,500 more EU students in halls of residence than in 2011 to 2012.
| 2011 to 2012 | 2012 to 2013 | 2013 to 2014 | 2014 to 2015 | 2015 to 2016 | 2016 to 2017 | 2017 to 2018 | Increase from 2011 to 2012 to 2017 to 2018 | |
|---|---|---|---|---|---|---|---|---|
| EU | 37,105 | 37,950 | 37,770 | 38,005 | 40,495 | 43,135 | 44,640 | 7,535 |
Download this table Table 4: Number of places in communal establishments by EU country of domicile, Higher Education Statistics Agency (HESA)
.xls .csvAdjusting the cumulative comparison between the IPS and APS for both deaths and students in halls of residence leaves a cumulative gap of around 950,000, which is unexplained.
Understanding EU migration data in the APS
To help understand how the APS picks up the EU born population it is helpful to do some further comparisons between the IPS and APS.
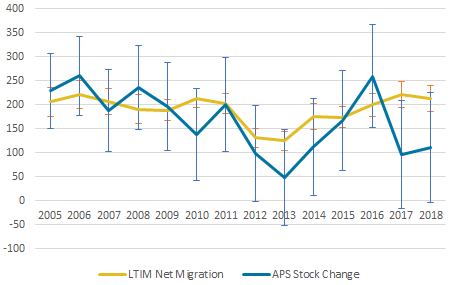
Comparing the IPS inflow estimates with those in the APS who said they arrived in the previous year shows that, for EU born migrants, the two series showed a similar pattern across the whole time series, with the IPS estimates showing higher levels than the APS estimates in some years and lower levels in others (Figure 13).
For EU8 born migrants, comparing the inflow from both surveys showed that for several years the pattern was similar although there were several years in which APS estimates were higher than the IPS inflow estimates (Figure 14).
Figure 13: IPS inflow and APS inflow for those who arrived in the previous year, EU-born population, 2007 to 2018
Source: Office for National Statistics – International Passenger Survey, Annual Population Survey
Notes:
- For 2018 LTIM migration, nationality has been used instead of country of birth as a proxy, country of birth data are not due to be published until November 2019.
- 2018 data are provisional.
- APS inflow estimates are based on previous year of arrival .
Download this chart Figure 13: IPS inflow and APS inflow for those who arrived in the previous year, EU-born population, 2007 to 2018
Image .csv .xls
Figure 14: IPS inflow and APS inflow for those who arrived in the previous year, EU8-born population, 2007 to 2018
Source: Office for National Statistics – International Passenger Survey, Annual Population Survey
Notes:
- For 2018 LTIM migration, nationality has been used instead of country of birth as a proxy, country of birth data are not due to be published until November 2019.
- 2018 data are provisional.
- APS inflow estimates are based on previous year of arrival.
Download this chart Figure 14: IPS inflow and APS inflow for those who arrived in the previous year, EU8-born population, 2007 to 2018
Image .csv .xlsThe inflow series follow a similar pattern over time, however, the APS is slightly higher for the EU8 born group. However, for some years the APS year-on-year change is larger than the APS inflow for EU8.
To explore this further we derived an outflow series based on the APS as the year-on-year change in the APS should be equal to the inflow minus the outflow (Figure 15). This showed that in some years the change in the APS for EU8 born was greater than the APS inflow for EU8 born. This would suggest that the APS estimate of EU8 born is growing not only due to new arrivals, but also for some other reason. In combination with the definitional differences outlined previously, this again shows that it is not appropriate to use the APS to imply a measurement of net migration.
Figure 15: APS inflow for those who arrived the previous year, household population change and implied outflow, EU8-born population, 2007 to 2017
Source: Office for National Statistics – Annual Population Survey
Notes:
- The implied outflow is calculated by: inflow for those who arrived in the previous year – year on year stock change.
Download this chart Figure 15: APS inflow for those who arrived the previous year, household population change and implied outflow, EU8-born population, 2007 to 2017
Image .csv .xlsThe APS asks respondents for their latest year of arrival. From this data we have created inflow cohorts over time, where in each survey year we identify how many migrants said they arrived in each particular year.
In theory, in each survey year, each year of inflow cohort should decrease as people subsequently leave. Looking at the EU born cohort, the pattern appears to remain stable rather than the cohort reducing in size each year (Figure 16). Between 2008 and 2016, the cohorts are fairly flat; from 2016 onwards, all intake cohorts have decreased; this is mirrored by the overall net migration flow pattern for EU migrants over the same period.
Figure 16: APS population of the UK by year of latest arrival, total EU born population, 2008 to 2018
Source: Office for National Statistics – Annual Population Survey
Download this chart Figure 16: APS population of the UK by year of latest arrival, total EU born population, 2008 to 2018
Image .csv .xlsLooking at the EU8 born cohort the pattern is very variable year-on-year (Figure 17). Within EU8, the patterns are driven by the largest and most variable inflow cohorts, those who said they arrived between 2005 and 2007 (immediately after the EU8 accession).
Figure 17: APS population of the UK by year of latest arrival, EU8-born population, 2008 to 2018
Source: Office for National Statistics – Annual Population Survey
Download this chart Figure 17: APS population of the UK by year of latest arrival, EU8-born population, 2008 to 2018
Image .csv .xlsThere are several possible explanations for this pattern, however, we do not have evidence to suggest which, if any, of these contributes most to this effect:
- some EU8 migrants may initially live in a communal establishment after arriving in the UK and then move into the household population in subsequent years
- EU8 migrants may be more likely to be picked up by the survey once they are settled
- the migratory patterns of EU8-born migrants may be complex, involving more circular patterns of movement between countries, and as such they find it more difficult to define a specific and consistent date of arrival
This again shows that it is not appropriate to use the APS to imply a measurement of net migration.
The IPS collects information about people’s intentions when they arrive in the UK (see Annex D for further details). Figure 18 shows the proportion of people arriving in the UK that indicated they intended to stay three months or longer but were uncertain about how long that would be by each country group. It shows that on average around 21% of individuals coming into the UK were uncertain about how long they would be staying over the period 2005 to 2018. This varied considerably by country of birth, lowest for non-EU (9% for Asia and 12% for rest of the world) and highest for EU2 (46%) and EU8 (43%). Over time there has been some variability, likely due to sampling, but there is no clear upward or downward trend.
Figure 18: IPS proportion with an uncertain intended length of stay, non-UK born, 2005 to 2018
Source: Office for National Statistics – International Passenger Survey
Download this chart Figure 18: IPS proportion with an uncertain intended length of stay, non-UK born, 2005 to 2018
Image .csv .xlsAdjusting migration estimates using DWP data
In this case we can see that adjusting for the definitional differences (deaths and students in halls of residence for APS) and 2011 Census adjustment (to LTIM) leaves a cumulative gap of around 700,000, which is unexplained. To help us understand the remaining gap we have used administrative data from Department for Work and Pensions (DWP) to compare with the results from the IPS and APS.
In Section 4 we concluded that it was appropriate to make an preliminary adjustment to non-EU former student outflows, given all the available evidence. Making such an adjustment requires us to consider what adjustment is required to the EU group and in particular for EU8 where we see the largest differences between the IPS and APS.
While the EU analysis is at a very early stage, we believe that it is appropriate to give an early indication of an preliminary adjustment for the inflow for EU8 migrants. In this way we are able to give a more accurate reflection of how both parts of the adjustment impact on overall migration trends together.
In May 2016, we published an article exploring the relationship between long- and short-term international migration and National Insurance number registrations (NINo) for non-UK nationals. As a part of this work we looked at DWP analysis of tax and benefit interactions using their Lifetime Labour Market Database, the L2. The L2 allowed analysis of those people who were shown to have had interactions with the tax and benefits system over a period of time that would suggest that they were a long-term migrant. Therefore, this source allows us to look at actual, rather than intended behaviour, and is also likely to cover the population in many communal establishments.
This preliminary EU8 adjustment is an initial method using the data we currently have available to us; as part of the migration transformation programme we will continue to research and refine this method and work across the Government Statistical Service (GSS).
This preliminary adjustment is just applied to EU8 migrants and uses L2 data to calculate what percentage of EU8 citizens registering for a NINo can be considered long-term migrants. A percentage difference between those considered long-term EU8 migrants from NINos and the EU8 IPS inflow excluding students is then calculated and averaged over the time periods available. This average percentage is then applied to the IPS EU8 inflow excluding students to increase the inflow for this group. Full details of this method can be found in Annex E.
There are limitations to this method, which will be explored further as we refine this EU preliminary adjustment as part of the transformation programme. We anticipate that we will have additional data sources, and more up-to-date information available as the work progresses, which will help us refine this EU adjustment. At this early stage in our understanding we have therefore taken a very cautious approach to the adjustment and applied it from year ending March 2011 to year ending March 2016 only.
From that point we begin to see that the decrease for the IPS and DWP data are falling at different rates (Figure 19) and also in the IPS and APS data suggesting that the impact of uncertain intentions on the IPS has potentially changed. Our latest published estimates of net migration also shows net migration from EU8 countries falling since 2016, whereas previously it had been increasing or stable. These different emerging patterns mean that without further data we do not have enough evidence on which to base an adjustment after that point.
Figure 19: National Insurance number registrations to adult overseas nationals, APS inflow and LTIM inflow, EU, year ending December 2008 to year ending December 2018
Source: Department for Work and Pensions – National Insurance number registrations to adult overseas nationals, Office for National Statistics – Long-Term International Migration, International Passenger Survey, Annual Population Survey
Notes:
- IPS and APS estimates are based on EU-born and NINos are based on nationality
- APS inflow estimates are based on previous year of arrival.
Download this chart Figure 19: National Insurance number registrations to adult overseas nationals, APS inflow and LTIM inflow, EU, year ending December 2008 to year ending December 2018
Image .csv .xlsConclusion
In summary the analysis shows that the definitional differences – deaths and students in halls of residence – increase the size of the difference we can see between the IPS and the APS. A comparison of the inflow data from both the IPS and APS shows similar results from both sources. However, analysis of the derived outflow from the APS, and arrival cohorts would suggest that the APS is more likely to pick up EU8 migrants who have been in the UK for some time, than those that arrived more recently. Further data are required to more fully understand this, and how it impacts on the comparisons between the different data sources.
For EU born migrants the picture is much more complex. While the IPS and APS inflow data suggest similar numbers of arrivals, there is a clear divergence in the number that they suggest are remaining in the UK. The APS-implied outflow is implausible, and we can see that the arrival cohorts remain stable over time. This suggests that data from both the IPS and APS have limitations that should be considered by users. Looking at the broader categories for length of stay, the IPS inflow data suggests that EU8 migrants tend to be more uncertain about their intended length of stay on arrival than other groups.
The IPS shows that EU8 migrants’ intentions are more uncertain than those from the EU14 and outside the EU when they arrive in the UK. We therefore looked at administrative sources of data that might help us understand the gap between the IPS and APS.
DWP analysis of tax and benefit interactions using their Lifetime Labour Market Database, the L2, showed that around 53% of NINo registrations indicated a long-term interaction series. When applied to the published NINo series this suggested a greater number of long-term arrivals for EU8 nationals than either the IPS or APS series showed. We are therefore proposing that we should apply an adjustment to the EU8 inflow series.
Our research has shown that no single data source can give a full reflection of international migration and we need to therefore draw upon all available sources to make our best assessment. We therefore believe that it is appropriate to publish an preliminary adjustment to the EU8 inflow series to improve the way we correct for uncertain intentions and have set out an initial method for this, which will be developed as we take forward the transformation programme.
Section 6 shows how this impacts through into LTIM and what the comparisons with the APS look like after applying the adjustments for differences in definitions, and the preliminary adjustment to account for uncertain intentions of EU8 migrants.
Back to table of contents6. Adjusting migration estimates to take account of uncertain intentions – what does this show?
Sections 4 and 5 showed that, despite there being definitional differences and differences in methodology between the two surveys, these do not fully explain the apparent differences in the estimates. Taking all of the evidence from the available sources of data we believe that it is appropriate at this stage to develop a preliminary adjustment that we can apply to our Long-Term International Migration (LTIM) estimates. We have therefore made preliminary adjustments for non-EU students and EU8 migrants.
The impact of the adjustments outlined in Sections 4 and 5 on our LTIM estimates, and on the comparisons between the International Passenger Survey (IPS) and Annual Population Survey (APS) are presented in this section.
Total Long-Term International Migration
Overall, the preliminary adjustments made only have a small impact on UK net migration and the trends we see over time are largely unchanged (Figure 20), giving us confidence in our previous headline estimates.
For example, in the year ending March 2016 – where we have adjusted data for both inflow and outflow – net migration is around 1% higher than our published estimate. This is because the adjustments to the EU and non-EU figures broadly cancel each other out in the overall adjusted net migration estimates. Following 2016, where we have applied a preliminary adjustment to non-EU only, our best assessment of net migration is that migration is still adding to the UK population but this may be slightly lower than our published estimates.
Figure 20: Long-Term International Migration, UK, with preliminary adjustment, year ending June 2009 to year ending December 2018
Source: Office for National Statistics – Long-Term International Migration
Notes:
- The dotted lines are preliminary estimates to adjust for uncertain intentions for EU8 citizens immigrating and non-EU former students emigrating. Preliminary adjustments for EU8 citizens have been applied from year ending June 2009 to year ending March 2016; for non-EU students have been applied from year ending December 2012 to year ending December 2018; and for net migration year ending March 2012 to year ending December 2018.
- The 2011 Census adjustments have always been applied to net migration.
Download this chart Figure 20: Long-Term International Migration, UK, with preliminary adjustment, year ending June 2009 to year ending December 2018
Image .csv .xlsNon-EU
For non-EU migration, we have applied a preliminary adjustment from year ending December 2012 to 2018, drawing on the strengths of what Home Office data tell us about emigration of non-EU students.
Our adjusted non-EU net migration estimates also show a very similar trend but are consistently lower than unadjusted estimates (Figure 21), indicating that we may have been overestimating net migration from outside the EU. In the year ending March 2016, net migration is around 13% lower than our published estimate. In the year ending December 2018, this is around 8% lower.
Figure 21 shows a comparison of the current inflow, outflow and net migration trend, along with the preliminary adjusted outflow and net migration trend for non-EU citizens.
Figure 21: Non-EU Long-Term International Migration, UK, with preliminary adjustment, year ending June 2009 to year ending December 2018
Source: Office for National Statistics – Long-Term International Migration
Notes:
- The dotted lines are preliminary estimates to adjust for uncertain intentions for non-EU former students emigrating. These preliminary adjustments have been applied from year ending December 2012 to year ending December 2018.
Download this chart Figure 21: Non-EU Long-Term International Migration, UK, with preliminary adjustment, year ending June 2009 to year ending December 2018
Image .csv .xlsFigure 22 shows a comparison between the preliminary non-EU net migration and the year-on-year change in the APS after non-EU deaths and students in halls of residence have been adjusted for.
Figure 22: Comparison of adjusted LTIM net migration estimates and the adjusted annual change in the APS estimates of the population, non-EU born population, 2005 to 2018
Source: Office for National Statistics – International Passenger Survey, Annual Population Survey
Notes:
- LTIM and APS are adjusted for deaths and students in halls of residence. LTIM net migration also includes the preliminary student adjustment.
- For 2018 LTIM migration, nationality has been used instead of country of birth as a proxy, country of birth data are not due to be published until November 2019.
- 2018 data are provisional.
Download this image Figure 22: Comparison of adjusted LTIM net migration estimates and the adjusted annual change in the APS estimates of the population, non-EU born population, 2005 to 2018
.png (16.6 kB) .xls (48.1 kB)
Figure 23 shows the cumulative impact of all the adjustments – for deaths, students in halls of residence and the new adjustment for uncertain intentions. This shows that the cumulative gap in 2018 was around 330,000 after adjustments, compared with around 870,000 before adjustments. As we progress the research on adjustments this gap may close further.
Figure 23: Comparison of cumulative adjusted LTIM net migration estimates and adjusted annual differences in APS estimates of the population, non-EU born population, 2005 to 2018
Source: Office for National Statistics – International Passenger Survey, Annual Population Survey
Notes:
- LTIM and APS are adjusted for deaths and students in halls of residence. LTIM net migration also includes the preliminary student adjustment.
- For 2018 LTIM migration, nationality has been used instead of country of birth as a proxy, country of birth data are not due to be published until November 2019.
- 2018 data are provisional.
Download this chart Figure 23: Comparison of cumulative adjusted LTIM net migration estimates and adjusted annual differences in APS estimates of the population, non-EU born population, 2005 to 2018
Image .csv .xlsEU migration
For EU migration, we have made a preliminary adjustment up to March 2016, which draws on the strengths of what the Department for Work and Pensions data tell us about immigration from EU8 countries.
At this early stage in our understanding, our research indicated that we should apply an adjustment to immigration estimates before 2016, to reflect migrants’ uncertain intentions on their likely length of stay in the UK. From 2016, we begin to see different relationships across our available sources, including the IPS and APS, suggesting that the impact of uncertain intentions on the IPS has potentially changed and may now be influencing both immigration and emigration. We also see from that point the trend in net migration from EU8 countries falling, whereas previously it had been increasing or stable.
These different emerging patterns mean that without further data, particularly for emigration, we do not have enough evidence on which to base an adjustment after that point. Therefore, our best assessment of EU net migration since 2016 is that it is still adding to the population, although other sources suggest that the IPS may be a slight overestimate.
Our adjusted EU net migration estimates show a very similar trend over time but are consistently higher than the unadjusted estimates (Figure 24), indicating that we may have been underestimating net migration from the EU. In the year ending March 2016 – the latest point at which we have adjusted data available, net migration is around 16% higher than our published estimate.
Figure 24 shows a comparison of the current inflow, outflow and net migration trend, along with the preliminary adjusted inflow and net migration trend for EU citizens.
Figure 24: EU Long-Term International Migration, UK, with preliminary adjustment, year ending June 2009 to year ending December 2018
Source: Office for National Statistics – Long-Term International Migration
Notes:
- The dotted lines are preliminary estimates to adjust for uncertain intentions for EU8 citizens immigrating. These preliminary adjustments have been applied from year ending June 2009 to year ending March 2016.
- The 2011 Census adjustments have always been applied to net migration.
Download this chart Figure 24: EU Long-Term International Migration, UK, with preliminary adjustment, year ending June 2009 to year ending December 2018
Image .csv .xlsFigure 25 shows a comparison between the preliminary EU net migration and the year-on-year change in the APS after EU born deaths and students in halls of residence have been adjusted for.
Figure 25: Comparison of adjusted LTIM net migration estimates and the adjusted annual change in the APS estimates of the population, EU born population, 2005 to 2018
Source: Office for National Statistics – International Passenger Survey, Annual Population Survey
Notes:
- LTIM and APS are adjusted for deaths and students in halls of residence. LTIM net migration also includes the 2011 Census and preliminary EU8 adjustment.
- For 2018 LTIM migration, nationality has been used instead of country of birth as a proxy, country of birth data are not due to be published until November 2019.
- 2018 data are provisional.
Download this image Figure 25: Comparison of adjusted LTIM net migration estimates and the adjusted annual change in the APS estimates of the population, EU born population, 2005 to 2018
.png (16.0 kB)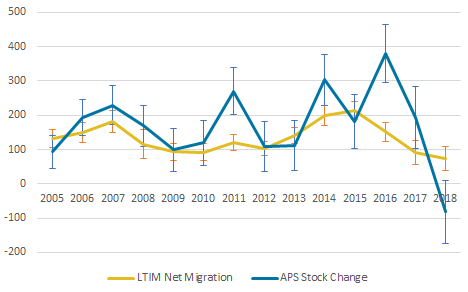
Figure 26 shows the cumulative impact of all the adjustments – for 2011 Census, deaths, students in halls of residence and the new adjustment for uncertain intentions. This shows that the cumulative gap in 2018 was around 510,000 after adjustments, compared with around 685,000 before adjustments. As we progress the research on adjustments this gap may close further.
Figure 26: Comparison of cumulative adjusted LTIM net migration estimates and adjusted annual differences in APS estimates of the population, EU born population, 2005 to 2018
Source: Office for National Statistics – International Passenger Survey, Annual Population Survey
Notes:
- LTIM and APS are adjusted for deaths and students in halls of residence. LTIM net migration also includes the 2011 Census and preliminary EU8 adjustment.
- For 2018 LTIM migration, nationality has been used instead of country of birth as a proxy, country of birth data are not due to be published until November 2019.
- 2018 data are provisional.
Download this chart Figure 26: Comparison of cumulative adjusted LTIM net migration estimates and adjusted annual differences in APS estimates of the population, EU born population, 2005 to 2018
Image .csv .xls7. Next steps
This work has shown the importance of our transformation programme in providing the best possible assessment of international migration based on all available sources.
As new data sources become available, we will build on our research so far and continue to develop our approach for adjusting the International Passenger Survey (IPS) estimates to take account of uncertain intentions. This includes strengthening our understanding of changes to patterns since 2016. Working across the Government Statistical Service (GSS), we will investigate whether there are other available administrative data sources that provide further evidence to refine our preliminary adjustments.
As set out in our transformation overview, we will continue to publish the findings from our research on an iterative basis and look to embed these in our regular Migration Statistics Quarterly Report (MSQR) to provide the best possible assessment of the latest trends in migration.
Whilst we go through this transformation journey, we have sought to re-classify our migration statistics as “Experimental Statistics” in line with Office for Statistics Regulation guidance. Re-classifying to Experimental Statistics supports this period of development and innovation and will be reflected in the latest MSQR published tomorrow (22 August 2019).
We expect our current work programme to be complete by this time next year when we will seek re-designation to National Statistics status.
Back to table of contents8. Annex A – Impact of survey biases, weighting and changes in occupancy
As part of our work to investigate the divergence between the Long-Term International Migration (LTIM) flows produced using the International Passenger Survey (IPS) and the change in the estimates of the non-UK born population measured by the Annual Population Survey (APS), we explored the impact of survey biases, weighting and changes in occupancy in the two surveys. This includes understanding the impact of any methodological changes in each survey, the size of the weights in each survey and in particular how outliers may have impacted on the survey estimates, assessing the impact of attrition and investigate how falling response rates affects the weighting (particularly for outliers) and how these impact on the estimates.
Weighting
The June 2019 progress report progress report showed that over the past 10 years the APS average weight had increased, the size of the large weights had increased, and the number of contacts allocated a large weight has also increased. We investigated this further to see if a particular country or age group was driving the increases but found that the increases in weights equally affected all country groups and age groups. Over this time period the response rates to the Labour Force Survey (LFS) and APS have declined and as expected this will be contributing to the increase in the size of the weights that we have seen.
To assess the outlier weights in the APS we looked at those contacts who were allocated a weight of over 700 or over 900. Looking at these outlier weights by country group, less than 1% of the sample by each country group had a weight of over 700 and this has been similar over time. Again, no particular country group has driven the increase in the number and size of outliers.
We looked at the outliers by age group and those aged 16 to 24 years and over 75 years have a higher number of outlier weights, between 2% and 5% compared with 1% for the other age groups. This is mainly due to the 16- to 24-year-olds being underrepresented in the LFS sample and those aged 75 years and over only being sampled in wave 1.
We looked at the LA response rates for those contacts with an outlier weight and found that those LAs with lower response rates had more outlier weights but this still only accounted for around 1% to 2% of the sample with low response rates. Therefore, the impact of the increasing outlier weights on the estimates is minimal, given the relatively small number of contacts with these weights in comparison with the total and that no particular group shows a different pattern.
As such, the weights will impact survey accuracy and the decreasing response rates will affect the weights, but this is not directly causing the divergence between the APS and IPS.
Attrition
To assess the impact of attrition we compared estimates from a dataset containing cases from wave 1 of the LFS and boost cases, and the other dataset containing wave 5 cases of the LFS and wave 2 of the boost, so that the samples were drawn a year apart.
The comparison of the estimates showed no evidence that attrition leads to a systematic difference in the levels of EU stocks between the wave 1 and wave 5/2 estimates. Attrition for non-EU stocks shows a minimal impact on the estimates as the wave 5/2 estimates are mostly lower than the wave 1 estimates.
Looking at the annual change in stocks attrition has little effect for both EU and non-EU countries of birth. Both figures show a cyclical pattern where the peak change in wave 5/2 is a year after the wave 1 peak. This is because the wave 5/2 sample was drawn a year earlier and hence correlated with the wave 1 sample from the previous year.
Therefore, this analysis of attrition between wave 1 and wave 5 shows there was minimal impact of attrition bias for either EU or non-EU country of birth groups.
Non-response
In 2011, a Census Non-Response Link Study (PDF, 169KB) (CNRLS) was conducted to assess non-response within the LFS. We have used this to help us investigate the impact of non-response on the survey estimates for the APS.
The CNRLS produced non-response factors, which we applied to the 2011 APS estimates to assess the impact on the estimates. We used the non-response factors for the LFS created from the 2011 CNRLS; these factors are given by region, age groups, household structure (one adult or other) and country of birth (UK or other). We looked at non-response at the total level, EU and non-EU country group and at local authority level.
The non-response factors were applied to only wave 1 cases – cases in Scotland and Northern Ireland were assigned a non-response factor of 1 as these were not available from the CNRLS. These cases were then re-weighted to the population estimates and then these weights were aggregated for country of birth group.
When comparing the estimates without the non-response factors applied to the estimates where the non-response factors had been applied, both EU and non-EU country groups increased by 2%. The percentage difference is similar for EU and non-EU as the non-response factors did not differentiate between EU and non-EU country of birth. However, this analysis is limited as we do not have any data to show how the non-response may have changed since 2011.
Therefore, applying these non-response factors to the country of birth estimates from the APS had a minimal impact and is hence unlikely to help to explain the gap between the IPS and APS.
Houses in Multiple Occupation
As part of our analysis into the methodological differences between the two sources we investigated the impact of Houses in Multiple Occupation1 (HMO) on the estimates of the non-UK born population from the APS. This showed that the proportion of households classed as a HMO was around 5% in 2017. Looking at this by region shows that London and the West Midlands have the highest proportion of properties classed as a HMO.
When considering the country of birth of those who live in a HMO, a greater proportion of the non-UK born population live in a HMO compared with the UK born population. The proportion is even higher for the EU8 and EU2 born population. However, as the total proportion of properties classed as a HMO is low, and changes over time do not mirror those seen in the APS non-UK born population estimates, it suggests that HMOs do not explain the gap between the IPS and APS estimates.
However, further research would be required to fully understand how HMOs might be related to the APS estimates such as, any impact of individual response rates within a HMO, the weight sizes of those living in a HMO and to understand further the characteristics of those living in a HMO.
Notes for: Annex A – Impact of survey biases, weighting and changes in occupancy
- A HMO is defined as a home where at least three tenants live, forming more than one household, where they share a toilet, bathroom or kitchen facilities with other tenants. A household is defined as either a single person or members of the same family who live together. A family includes people who are: married or living together (including those in a same-sex relationship), relatives or half-relatives, step-parents and step-children.
9. Annex B – Preliminary adjustment: non-EU migrants
The aim of the preliminary adjustment for non-EU students is to more closely align International Passenger Survey (IPS) estimates of non-EU former students emigrating with evidence on their actual behaviour from Home Office Exit Checks data (PDF, 611KB).
As set out in Section 4, our comparison of IPS student outflow data with Home Office administrative data suggests that the IPS may be undercounting students emigrating from the UK. To more closely align the IPS former student outflow estimate we applied the following preliminary adjustment.
Taking the IPS student inflow estimate and given we know that many students will not emigrate that same year, we have used Higher Education Statistics Agency (HESA) data to calculate preliminary proportions of first-year students who expect to leave the UK after a year and those who expect to leave after more than one year. Exit Checks data were then used to identify the proportion of students who departed the UK long-term after completing their studies. For each relevant year both proportions were applied in turn to the IPS inflow estimate to derive an adjusted estimate of IPS former student outflow.
Given the data we have available, the preliminary adjustment has been calculated from year ending December 2012 to year ending December 2018. There are limitations to this method, which will be explored further as we refine this non-EU preliminary adjustment as part of the transformation programme in conjunction with our colleagues across the Government Statistical Service (GSS).
Worked example
Note: Numbers in this example are not based on real data.
For a single year (2010) the inflow of South East Asian students is 10,000. Of these 10,000 students, some will be on short, one-year courses, whilst others with be on longer three-year courses. First, we take the HESA expected length of stay data for 2010 and calculate the proportions of “one-year” and “more than one year” course attendees for non-EU students.
We find that the proportion of non-EU students expecting to stay one year is 20%, and that 75% of non-EU students expect to stay for more than one year and up to three years. The remaining 5% are those students who will expect to stay for an extended period of time (up to 20 years), so we remove these from the calculation for this crude adjustment. We apply these proportions to our 2010 inflow of 10,000 students so we know that 7,500 students arriving in 2010 are expected to leave in 2013, and that 2,000 students arriving in 2010 are expected to leave in 2011.
For the South East Asian students expected to leave in 2013, we will also need to add in the one-year students from 2012. The inflow of South East Asian students in 2012 was 5,000 with 30% expecting to stay one year, and 60% for three years. We therefore apportion 1,500 students to 2013, and 3,000 to 2016.
We now have an expected outflow for 2011 (2,000), although we know that not all of these students will actually leave as some will choose to extend and stay to possibly work or continue to study on a new visa. Using Exit Checks data, we can see that for 2015 to 2016, 78% of South East Asian students emigrated after completing their studies and in 2016 to 2017, 80%. Taking the average (79%) we apply this to this group. This means that for our expected outflow of 2,000 in 2011, 79% of this number will leave long-term (1,580). This is our new adjusted student outflow for South East Asia for 2011.
Finally, for 2013, we take the expected three-year outflow from 2010 (7,500) and the expected one-year outflow from 2012 (1,500). This is a total expected student outflow of 9,000, of which we expect 79% to leave, so the total South East Asian adjusted outflow for 2013 is 7,110.
This is repeated for all years in the series, to ensure that the cohort for each inflow in each year is correctly apportioned as outflows for later years.
IPS estimates
Former student outflow estimates are only available from 2012 as this is when emigrants were asked their original reason for immigration for the first time in the IPS.
Home Office administrative data
The Exit Checks data were used to create a proportion of students who departed the UK long-term after completing their studies for 2015 to 2016 and 2016 to 2017. This follows on from the publications in July 2018 when we published a report on How we are using Home Office administrative data to further our understanding of international migration and uses the same method.
We calculated the proportion by country group and then averaged this over the two years data we have available for each country group. As Exit Checks data within the Office for National Statistics (ONS) was only readily available for these two years, the average proportion calculated and applied to the IPS estimate.
Limitations:
- data readily available within the ONS
- we are continuing to work with the Home Office to understand Exit Checks data further and as we do this, improvements can be fed into future adjustments – for example, looking at cohorts of students
Higher Education Statistics Agency – first year student records
As we know many students will not emigrate that same year; we have used HESA data to calculate a preliminary proportion of first year students who leave after a year, or more than one year based on their length of study.
Using HESA data for each academic year we calculated the number of students expected to stay for “one year” or “more than one year” (totalled one to two years, two to three years and three to four years). Those students expecting to stay for longer are removed for this simple calculation, as for each additional year of expected stay, those students would have to be allocated to a later year, including those years that have not yet occurred.
This then provides us with proportions of non-EU students on one-year courses, or multiple year courses for each year that can be applied to IPS estimates.
Limitations:
- based on domicile, whereas Exit Checks data are based on nationality, the limitations of this needs to be researched further
- based only on students at higher education institutions in England and Wales, as these were the data readily available; we can look to using UK in the future
- only the non-EU proportion was calculated, we could look at breaking the proportions by country group
- doesn’t take into account those students who may have dropped out of their studies
10. Annex C – The impact of communal establishments on how we account for deaths in this analysis
The number of deaths registered in the UK will include those who were living in a communal establishment at the time of their death. Using 2011 Census data the second-largest type of communal establishment was medical and care. We looked at this type of establishment by age to understand the age split and what impact this could have on deaths (Figure 27).
The non-EU population living in medical and care establishments is much smaller than the EU population and is spread between all ages, with those aged 25 to 34 years and 35 to 44 years making up the largest age groups. Looking at the EU population in medical and care establishments the total population is much larger at over 14,000 and of this over half are aged 75 years and over.
Figure 27: All usual residents born outside the UK living in medical and care communal establishments by type of establishment, passport held and age, 2011 Census
Source: Office for National Statistics – 2011 Census
Notes:
- Excludes people who said they did not hold a passport.
Download this chart Figure 27: All usual residents born outside the UK living in medical and care communal establishments by type of establishment, passport held and age, 2011 Census
Image .csv .xls11. Annex D – International Passenger Survey: length of stay
On the International Passenger Survey, foreign residents arriving in the UK and UK residents departing are asked how long they intend to be in or out of the UK. The following categories are collected:
- 6 to 12 months
- don’t know, maybe 6 months or more
- up to two years
- up to four years
- four years or more
- don’t know, maybe 12 months or more
- don’t know how many years
- already living in the UK/abroad
Figure 18 is based on the three don’t know categories.
Back to table of contents12. Annex E – Preliminary adjustment: EU migrants
This preliminary adjustment is an initial method using the data we currently have available to us. As we continue with the migration statistics transformation programme we will continue to research and refine this method in conjunction with our colleagues across the Government Statistical Service (GSS).
To produce an preliminary adjustment for EU migrants we looked at Department for Work and Pensions (DWP) analysis of tax and benefit interactions using their Lifetime Labour Market Database, the L2 (which is a 1% sample). The L2 allowed analysis of non-UK national adults who registered for a National Insurance number (NINo) in the UK and had interactions with National Insurance, Pay As You Earn, DWP benefit and local authority benefit systems. Interactions of more than 52 weeks across the registration year and the subsequent year could suggest that they were a long-term migrant.
This preliminary adjustment is just applied to EU8 migrants with the aim to more closely align the LTIM inflow with evidence on actual behaviour seen in DWP data. At this early stage in our understanding we have taken a very cautious approach to the preliminary adjustment and applied it through to March 2016 only.
Analysis of L2 data from DWP showed that the long-term (more than 52 weeks) interactions average percentage between the tax years ending 2014 and ending 2017 was 53%. From this we could assume that just over half of NINo registrations to non-UK arrivals were long-term migrants. So, we produced a NINo time-series for long-term migrants by applying this long-term L2 proportion to the published numbers of NINo registrations to adult overseas nationals entering the UK from year ending March 2011 to year ending March 2016.
Figure 28 shows a comparison of the EU8 long-term NINo estimates with both the International Passenger Survey (IPS) and Annual Population Survey (APS) inflow series. The adjustment has been applied to Long-Term International Migration (LTIM) minus students inflow. We recognise that some students may be included in to the L2 long-term interactions group and we need to further understand this group before adding as part of an adjustment.
This shows that the long-term NINo series is consistently higher than all of the other series. However, it should be noted that all three of these are based on samples of the population, are derived in different ways and use different definitions.
Figure 28: Comparison of adjusted long-term NINo estimates, APS inflow and LTIM inflow excluding study reasons, EU8 citizens, year ending March 2011 to year ending March 2016
Source: Department for Work and Pensions – National Insurance number registrations to adult overseas nationals, Office for National Statistics – Long-Term International Migration, International Passenger Survey, Annual Population Survey
Notes:
- NINo registrations are for all National Insurance number registrations to adult overseas nationals entering the UK, adjusted to assume they were a long-term migrant based on the DWP L2 analysis
- LTIM inflow excludes the IPS study-related inflow
- APS inflow are in calendar years and are based on previous year of arrival
- L2 analysis is based on the date of registration for a NINo, whereas IPS and APS are based on arrival dates. People may take time to register for National Insurance purposes and therefore registration data may capture arrivals from a number of years.
Download this chart Figure 28: Comparison of adjusted long-term NINo estimates, APS inflow and LTIM inflow excluding study reasons, EU8 citizens, year ending March 2011 to year ending March 2016
Image .csv .xlsWe then calculated the NINo registrations long-term adjusted figure as a percentage of the LTIM inflow excluding students and averaged these percentages across 2011 to 2016, which was 148%. We then adjusted the EU8 LTIM excluding study inflow series by the average percentage difference (148%). This was then used as the new EU8 inflow estimate and fed through to the headline migration estimates.
Limitations
There are limitations to this method, which will be explored further as we refine this EU preliminary adjustment as part of the transformation programme.
L2 data are only available up to 2017 to 2018. Only complete data up to 2016 to 2017 is used in this analysis.
L2 data does not include all activities that a migrant may have, so the long-term proportions are based on the data available.
L2 uses a 1% sample of those with a NINo.
In L2, migrants are recorded in the tax year that they registered for a NINo and includes arrivals from previous years. Whereas, LTIM is based on arrivals. There can be a lag between actual arrival and registration which could impact the preliminary adjustment.
L2 analysis also categorises an “inferred long-term group”, which includes those who state that they had been in the UK for more than 52 weeks before registration. While this self-reported duration could technically make them long-term migrants, the L2 data does not contain any supporting evidence of residency. Comparisons of the non-EU “inferred long-term” group with the IPS and APS suggest an overlap with student migrants. This group needs further understanding and analysis before using it in an adjustment. Therefore, this is a minimum preliminary adjustment and is the first step as part of our transformation work.
The adjustment has only been applied to EU8 migrants. We plan to analyse the other EU groups further to see if they should be adjusted.
The adjustment has been applied to LTIM minus students inflow. We recognise that some students may be included into the L2 long-term interactions group and we need to further understand this group before adding as part of an adjustment.
Research of EU emigration is also required to assess if an adjustment is required.
All data are based on sample surveys.
Back to table of contents