1. Main points
In July 2012 to June 2014:
aggregate total wealth of all private households in Great Britain was £11.1 trillion
the wealthiest 10% of households owned 45% of total aggregate household wealth
the least wealthy half of households owned 9% of total aggregate household wealth
median household total wealth was £225,100
Changes in wealth between July 2010 to June 2012 and July 2012 to June 2014:
aggregate total wealth increased by 18% (aggregate total wealth excluding pension wealth increased by 13%)
for the wealthiest 10% of households, aggregate total wealth increased by 21%
for the least wealthy 50% of households, aggregate total wealth increased by 7%
median total wealth increased by 4% from £216,500 to £225,100
2. Introduction
Wealth is an important component of the economic well-being of households, as a household's resources and economic behaviour can be influenced by its stock of wealth. However, data on wealth is sparse and consequently measures of household income are often used as the sole gauge of economic well-being. To understand the economic well-being of households it is increasingly necessary to look further than a simple measure of household income.
The Wealth and Assets Survey (WAS) is a longitudinal household survey, which aims to address gaps identified in data about the economic well-being of households by gathering information on, among other things, level of savings and debt, saving for retirement, how wealth is distributed across households and factors that affect financial planning.
Wealth in Great Britain: 2012 to 2014 is the main report covering the fourth wave of the Wealth and Assets Survey, the fieldwork period for which was July 2012 to June 2014. The results highlighted in this article are just a small selection of the main conclusions drawn to date – and are supported by the more comprehensive statistical bulletin accompanying this article.
Back to table of contents3. Household total wealth
In July 2012 to June 2014 aggregate total household wealth (including private pension wealth) of all private households in Great Britain was £11.1 trillion.
The distribution of wealth is highly skewed towards the top - the wealth held by the richest 10% of households combined was just under £5 trillion and represented a 45% share of aggregate total wealth. Conversely the combined wealth of the bottom half of households in the distribution was less than £1.0 trillion; a value which accounted for just 9% of aggregate total wealth (Figure 1). The wealth of the least wealthy 10% of households accounted for less than half of 1% of aggregate total wealth.
Figure 1: Distribution of total household wealth
Great Britain, July 2012 to June 2014

Source: Wealth and Assets Survey - Office for National Statistics
Download this image Figure 1: Distribution of total household wealth
.png (27.7 kB) .xls (18.9 kB)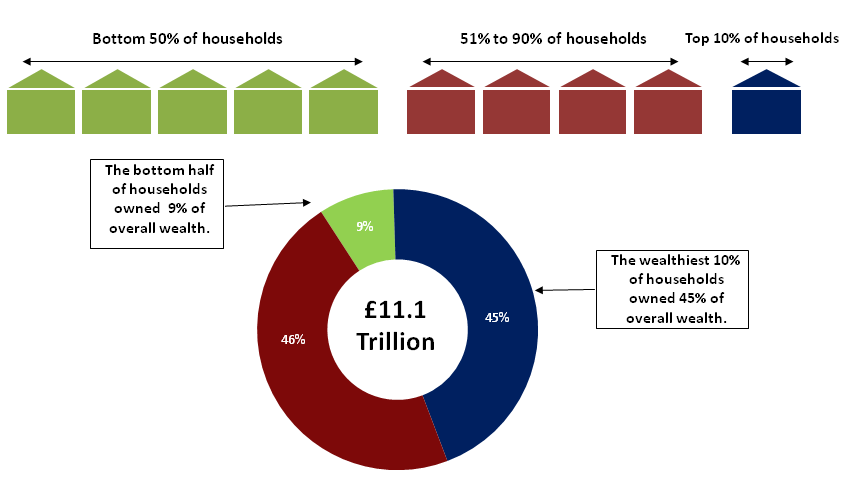
The wealth held by the top 10% of households was around 5 times greater than the wealth of the bottom half of all households combined and, over 875 times greater than that of the least wealthy 10% of households.
Figure 2 shows the percentile points for total household wealth (these are the boundary values for total household wealth if the population is split into 100 groups). The median value for household total wealth was £225,100 i.e. half of all households had total wealth less than this and half of all households had total wealth more than this. Belonging to the wealthiest 10% of households required total wealth greater than £1,048,500. To be in the bottom 10% of the distribution, a household’s value of total wealth needed to be less than £12,600.
Figure 2: Distribution of total household wealth, percentile points
Great Britain, July 2012 to June 2014
Source: Wealth and Assets Survey - Office for National Statistics
Notes:
- Bottom 10% of households have total wealth of £12,600 or less.
- Median total household wealth is £225,100.
- Top 10% of households have total wealth of £1,048,500 or more.
- Top 1% of households have total wealth of £2,872,600 or more.
Download this chart Figure 2: Distribution of total household wealth, percentile points
Image .csv .xlsThere are many ways to consider wealth inequality, comparisons made here are just examples – further measures – Gini coefficients, Lorenz Curves, 80/20 ratios, comparison of all wealth deciles are all explored in the statistical bulletin accompanying this article.
Change in total wealth
In July 2012 to June 2014 aggregate total household wealth (including private pension wealth) of all private households in Great Britain was £11.1 trillion – an 18% increase from the previous period of July 2010 to June 2012. Much of this increase is due to the increase seen in private pension wealth1. Aggregate total household wealth (excluding private pension wealth) increased by 13%.
Table 1: Household total wealth: Summary statistics
| Great Britain, July 2010 to June 2014 | ||
| July 2012 to June 2014 | July 2010 to June 2012 | |
| £ billion | ||
| Least wealthy: 1% to 50% | 969 | 904 |
| Middle wealth: 51% -90% | 5,177 | 4,425 |
| Wealthiest 10% | 4,990 | 4,115 |
| All Households | 11,134 | 9,444 |
| £ | ||
| Median total wealth | 225,090 | 216,542 |
| Source: Wealth and Assets Survey, Office for National Statistics | ||
Download this table Table 1: Household total wealth: Summary statistics
.xls (25.6 kB)Whilst total wealth was seen to increase for each of the wealth bands shown, the disparity in the change was large. For the wealthiest 10% of households, aggregate total wealth increased by 21%; for households in the middle wealth band (51% to 90%) aggregate total wealth increased by 17%; whilst for the least wealthy 50% of households, aggregate total wealth increased by 7%. (Figure 3). Put another way the increase seen in the least wealthy 10% of households accounted for less than 1% of the 18% overall increase; the increase in the middle wealth band accounted for 8% of the 18% increase; and the increase seen in the top 10% of households accounted for over half of the 18% increase.
Figure 3: Household total wealth: Summary statistics
Great Britain: July 2010 to June 2014
Source: Wealth and Assets Survey - Office for National Statistics
Download this chart Figure 3: Household total wealth: Summary statistics
Image .csv .xlsAggregate wealth by region
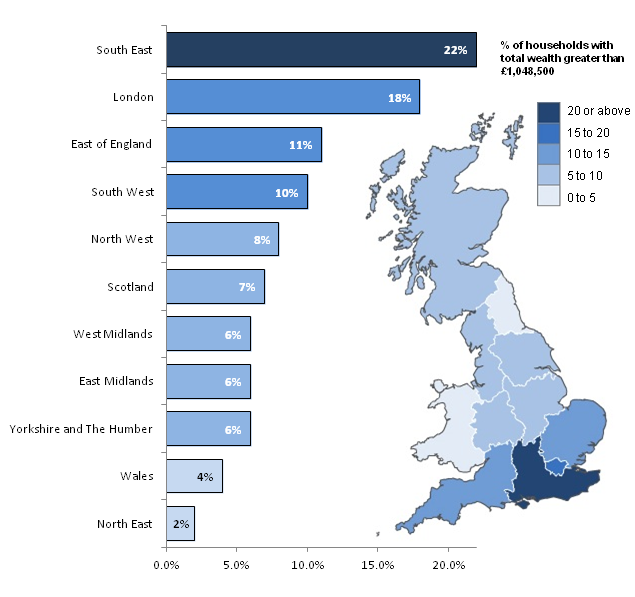
Considering the 9 regions of England and the countries of Wales and Scotland, the South East had the highest percentage of ‘wealthy’ households. Of all the households in this particular region, 22% had a value of total wealth greater than £1,048,500; enough to belong to the wealthiest 10% of households in Great Britain. In comparison, only 2% of households in the North East and 4% of households in Wales held sufficient wealth to fall into the top wealth decile.
The regional distribution of wealth (in particular by wealth component and how it has changed over time) is considered in further detail in the statistical bulletin accompanying this article.
Figure 4: Percentage of wealthy households by region
Great Britain, July 2012 to June 2014
Source: Wealth and Assets Survey - Office for National Statistics
Notes:
- Contains OS data © Crown copyright 2015.
Download this image Figure 4: Percentage of wealthy households by region
.png (123.6 kB) .xls (27.1 kB)
The components of total wealth
In July 2012 to June 2014 private pension wealth and net property wealth together account for over three quarters of aggregate total wealth of all private households in Great Britain (40% and 35% respectively) with financial wealth accounting for just 14% and physical wealth just 10%. These proportions have changed over time with private pension wealth accounting for a higher proportion of aggregate total wealth (34%) in July 2006 to June 2008 (the earliest period for which data are available) and property wealth a smaller proportion (42%) in July 2006 to June 2008. Physical and financial wealth have shown much less change.
It should be noted however, the methods used for valuing some forms of private pension wealth (defined benefit (DB) type pensions) use external market factors applicable at the time of interview (annuity rates and discount factors), which themselves vary over time. This alone causes some of the large movements in the value of private pensions – and is discussed in detail in Chapter 6: Private pension wealth of the statistical bulletin accompanying this article.
Table 2: Breakdown of aggregate total wealth, by components
| Great Britain, July 2006 to June 2014 | ||||
| % | ||||
| July 2012 to June 2014 | July 2010 to June 2012 | July 2008 to June 2010 | July 2006 to June 20081 | |
| Property Wealth (net) | 35 | 37 | 38 | 42 |
| Financial Wealth (net) | 14 | 14 | 12 | 12 |
| Physical Wealth1 | 10 | 11 | 11 | 11 |
| Private Pension Wealth | 40 | 37 | 39 | 34 |
| Total Wealth (including Private Pension Wealth)1 | 100 | 100 | 100 | 100 |
| Property Wealth (net) | 59 | 60 | 62 | 64 |
| Financial Wealth (net) | 24 | 22 | 20 | 19 |
| Physical Wealth1 | 17 | 18 | 19 | 17 |
| Total Wealth (excluding Private Pension Wealth)1 | 100 | 100 | 100 | 100 |
| Source: Wealth and Assets Survey, Office for National Statistics | ||||
| Notes: | ||||
| 1. July 2006 to June 2008 estimates for physical and total wealth are based on half sample. | ||||
Download this table Table 2: Breakdown of aggregate total wealth, by components
.xls (26.1 kB)Distribution of wealth by wealth components
Of the total wealth held by those households in the top decile, over half (43%) comprised private pension wealth. Nearly all households in this top wealth decile had private pension wealth (98%) and the median value of private pension wealth for these households was £749,000. Private pension wealth contributed only 29% to the wealth held by the least wealthy half of households. More than 2 out of 5 households (43%) in the least wealthy half of the distribution had no private pension wealth at all and the median value of private pension wealth held by this group was £2,800.
The contribution of property wealth (net) to the combined total wealth of the top 10% of households was 31% with a median value of £420,000. Property wealth made the largest contribution to total wealth for the least wealthy half of households (34%) even though only 40% of households in this group owned any property.
Net financial wealth contributed 21% of overall wealth held by the wealthiest tenth of households; the median value of this wealth was £153,900. For the least wealthy half of households, net financial wealth accounted for 4% of the overall wealth held by this group with a median value of £400. Physical wealth (the value of a household’s possessions, valuables etc.) made a far greater contribution to the combined wealth holdings of the least wealthy half of households (33%) than to the most wealthy tenth of households (5%). Nevertheless, the median value of physical wealth was lower for those households in the bottom half of the distribution (£18,150) than those in the top tenth (£74,300).
Figure 5a: Breakdown of household total wealth by components
Wealthiest 10% - Great Britain, July 2012 to June 2014
Source: Wealth and Assets Survey - Office for National Statistics
Download this chart Figure 5a: Breakdown of household total wealth by components
Image .csv .xls
Figure 5b: Breakdown of household total wealth by components
Least Wealthy 10% - Great Britain, July 2012 to June 2014
Source: Wealth and Assets Survey - Office for National Statistics
Download this chart Figure 5b: Breakdown of household total wealth by components
Image .csv .xlsTable 3 shows how the relative distributions have changed over time. The changes in private pension wealth1 mask some of the other changes, but net property wealth has accounted for a smaller proportion of aggregate total wealth for the least wealthy 50% of households each two year survey period from 41% in July 2006 to June 2008 to 34% in July 2012 to June 2014.
Table 3: Comparison of the wealthiest 10% of households with the least wealthy 50% of households: aggregate total wealth by component, Great Britain,
| July 2006 to June 2014 | ||||||||
| % | ||||||||
| July 2012 to June 2014 | July 2010 to June 2012 | July 2008 to June 2010 | July 2006 to June 2008 | |||||
| Top 10% | Bottom 50% | Top 10% | Bottom 50% | Top 10% | Bottom 50% | Top 10% | Bottom 50% | |
| Private Pension Wealth | 43 | 29 | 42 | 30 | 47 | 25 | 42 | 21 |
| Net Property Wealth | 31 | 34 | 32 | 37 | 31 | 38 | 36 | 41 |
| Net Financial Wealth | 21 | 4 | 20 | 4 | 15 | 4 | 16 | 4 |
| Physical Wealth | 5 | 33 | 6 | 29 | 6 | 33 | 6 | 34 |
| Total Wealth | 100 | 100 | 100 | 100 | 100 | 100 | 100 | 100 |
| Source: Wealth and Assets Survey, Office for National Statistics | ||||||||
| Notes: | ||||||||
| 1. July 2006 to June 2008 estimates are based on half sample. | ||||||||
Download this table Table 3: Comparison of the wealthiest 10% of households with the least wealthy 50% of households: aggregate total wealth by component, Great Britain,
.xls (25.6 kB)Some further comparisons of the wealthiest 10% of households and the least wealthy 50% of households
In July 2012 to June 2014 (see Table 7.6 (3.31 Mb Excel sheet) in Chapter 7):
median household private pension wealth was £749,000 for households in wealthiest 10% compared to £2,800 for households in the least wealthy 50%
median net property wealth was £420,000 for households in wealthiest 10% compared to £0 for households in the least wealthy 50%
median net financial wealth was £154,000 for households in wealthiest 10% compared to £400 for households in the least wealthy 50%
96% of households in the wealthiest 10% owned at least one car compared to 58% for households in the least wealthy 50%
Notes for household total wealth
- The methodology used for calculating current and retained DB pension wealth and pensions in payment uses some external the financial assumptions which can have a large effect on the values obtained. See “About the data in this report” at the end of this article.
4. Private pension wealth
The percentage of adults aged 16 and over who contributed to a private pension was 35% (little change from the 34% seen in the previous survey period of July 2010 to June 2012). (Table 6.1 In the bulletin)
A much higher proportion of employees in the public sector (84% with median pension wealth of £61,600) belonged to a current occupational pension scheme than their counterparts in the private sector (42% with median pension wealth of £24,000). (Table 6.6 In the bulletin)
Table 4 shows the proportion of households with one or more people with each type of pension1 and the median value of each type of pension (for households with those pensions).
Table 4: Proportion of households with wealth in private pensions and amount of wealth (£) held in such pensions, by type
| Great Britain | ||||
| £ | ||||
| July 2012 to June 2014 | July 2010 to June 2012 | |||
| % with | Median | % with | Median | |
| Current occupational DB pensions1 | 28 | 85,500 | 30 | 58,200 |
| Current occupational DC pensions1 | 16 | 11,000 | 14 | 12,100 |
| Personal pensions1 | 15 | 21,000 | 15 | 18,000 |
| AVCs1 | 1 | 8,900 | 2 | 11,000 |
| Retained rights in DB pensions1 | 14 | 46,700 | 18 | 26,300 |
| Retained rights in DC pensions1 | 15 | 10,300 | 16 | 12,100 |
| Rights retained in pensions for drawdown1 | 0 | 120,000 | 0 | 50,000 |
| Pensions expected from former spouse/partner1 | 2 | 14,200 | 1 | 36,700 |
| Pensions in receipt1 | 30 | 146,900 | 30 | 118,100 |
| Total pension wealth1 | N/A | 97,300 | N/A | 80,500 |
| Total pension wealth (whole population)2 | 76 | 47,100 | 76 | 39,700 |
| Source: Wealth and Assets Survey, Office for National Statistics | ||||
| Notes: | ||||
| 1. Calculations for wealth estimates exclude those with zero pension wealth (i.e. only cover those with pensions). | ||||
| 2. The rows highlighted in bold and labelled ‘Total pension wealth (whole population)’ include those with zero pension wealth. | ||||
| 3. Although the methodology for calculating DB pension wealth has remained the same in all three waves, there have been changes in the financial assumptions. | ||||
| 4. Households can have wealth in more than one type of pension. | ||||
| 5. Figures in italics are based on 30 or more unweighted cases but less than 50 - such data should be treated with some caution. | ||||
| 6. N/A - Not Applicable. | ||||
Download this table Table 4: Proportion of households with wealth in private pensions and amount of wealth (£) held in such pensions, by type
.xls (28.2 kB)About a quarter of households in Great Britain had no private pension wealth in July 2012 to June 2014 and in the earlier two periods, highlighting an unequal distribution of private pension wealth.
In July 2012 to June 2014, 28% of households in Great Britain had wealth in current occupational DB pensions (median wealth £85,500) with a similar proportion (30%) having pensions in payment (median wealth £146,900).
Aggregate household private pension wealth
Table 5 presents a breakdown of aggregate private pension wealth of households in Great Britain by the overall pension wealth components.
Table 5: Breakdown of aggregate household private pension wealth, by components
| Great Britain, July 2006 to June 2014 | ||||
| £ Billion | ||||
| Current pension wealth | Retained pension wealth | Pension in payment wealth | Aggregate private pension wealth1 | |
| July 2012 to June 2014 | 1,727 | 555 | 2,177 | 4,459 |
| July 2010 to June 2012 | 1,414 | 460 | 1,655 | 3,530 |
| July 2008 to June 2010 | 1,296 | 491 | 1,672 | 3,459 |
| July 2006 to June 2008 | : | : | : | 2,886 |
| Source: Wealth and Assets Survey, Office for National Statistics | ||||
| Notes: | ||||
| 1. Current pension wealth comprises current occupational DB and DC pensions, and current personal pensions (including group personal/stakeholder pensions). | ||||
| 2. Retained pension wealth comprises retained occupational DB pensions, retained DC (both occupational and personal) pensions and retained pensions for drawdown. | ||||
| 3. Pension in payment wealth comprises private pensions from which individuals were receiving an income (including spouse pensions). | ||||
| 4. Although the methodology for calculating current and retained DB pension wealth and pensions in payment has remained the same between the two waves, there have been changes in the financial assumptions. These are detailed in the pension wealth methodology annex. | ||||
| 5. July 2006 to June 2008 data excluded as aggregate private pension wealth during this period does not equal the sum of current, retained and pension in payment wealth due to the presence of imputed values in the Wave 1 dataset for aggregate private pension wealth only. | ||||
| 6. : data is not available. | ||||
Download this table Table 5: Breakdown of aggregate household private pension wealth, by components
.xls (27.1 kB)Table 5 shows that aggregate private pension wealth in Great Britain increased from £2.9 trillion in July 2006 to June 2008 to £4.5 trillion in July 2012 to June 2014. The increase is mainly explained by the increases in Pension in payment wealth and current pension wealth. In July 2012 to June 2014, 12% of the aggregate private pension wealth related to retained pension wealth with 49% due to pension in payment wealth and 39% due to current pension wealth.
Notes for private pension wealth
- The methodology used for calculating current and retained DB pension wealth and pensions in payment uses some external the financial assumptions which can have a large effect on the values obtained. See “About the data in this report” at the end of this article.
5. Property wealth
Gross property wealth is made up of the self reported value of a households’ main residence if owned by any individuals in the household, plus the value of any other land or property any individuals in the household own either in the UK or overseas. Mortgage debt comprises any mortgages or loans secured on any properties owned by any individuals in a household. Net property wealth is gross property wealth minus mortgage debt.
Table 6: Household property wealth: Summary statistics, Great Britain
| July 2006 to June 2014 | ||||
| July 2012 to June 2014 | July 2010 to June 2012 | July 2008 to June 2010 | July 2006 to June 2008 | |
| £ Billion | ||||
| Aggregate household gross property wealth | 4,984 | 4,541 | 4,359 | 4,492 |
| Aggregate mortgage debt | 1,057 | 1,012 | 980 | 960 |
| Aggregate household net property wealth | 3,927 | 3,528 | 3,379 | 3,532 |
| £ | ||||
| Median household net property wealth (property owners) | 153,000 | 150,000 | 148,000 | 150,000 |
| Median net property wealth all households | 85,000 | 90,000 | 90,000 | 95,000 |
| Source: Wealth and Assets Survey, Office for National Statistics | ||||
Download this table Table 6: Household property wealth: Summary statistics, Great Britain
.xls (25.6 kB)Aggregate net property wealth in Great Britain increased by 11% between July 2010 to June 2012 and July 2012 to June 2014. This was made up of:
aggregate gross property wealth of all private households was £4,984 billion (an increase of 10% compared with July 2010 to June 2012)
aggregate mortgage debt was £1,057 billion (an increase of 4% compared with July 2010 to June 2012)
Half of all households who owned property had net property wealth of £153,000 or more (compared to £150,000 in July 2010 to June 2012). Including households who rent their main residence (and did not own any other land or property – 32% of all households), reduces the median value to £85,000.
Back to table of contents6. Financial wealth
Aggregate net financial wealth for all private households in Great Britain was £1.6 trillion - a 22% increase over the same figure for July 2010 to June 2012. This was driven mainly by an increase in the value of financial assets as opposed to a decrease in financial liabilities.
Table 7: Total household financial wealth, summary statistics
| Great Britain, July 2006 to June 2014 | ||||
| July 2012 to June 2014 | July 2010 to June 2012 | July 2008 to June 2010 | July 2006 to June 2008 | |
| £ Billion | ||||
| Aggregate household gross financial wealth | 1,698 | 1,409 | 1,186 | 1,131 |
| Aggregate household financial liabilities | 101 | 105 | 95 | 88 |
| Aggregate household net financial wealth | 1,596 | 1,305 | 1,091 | 1,043 |
| £ | ||||
| Median household net financial wealth | 5,900 | 5,800 | 6,400 | 5,700 |
| Source: Wealth and Assets Survey, Office for National Statistics | ||||
Download this table Table 7: Total household financial wealth, summary statistics
.xls (25.1 kB)Any one of these statistics, taken on its own, could not be said to show an improvement in household debt. However, when combined they do provide some support for this conclusion. Figure 6 below also indicates an improvement. Whilst there was no change in the percentage of individuals reporting their debt a heavy burden between July 2010 to June 2012 and July 2012 to June 2014, there was a slight decrease in the percentage reporting their debt somewhat of a burden and a slight increase in the percentage reporting their debt as not a problem at all (Table 7.6 (3.31 Mb Excel sheet) in Chapter 7).
Debt burden
A number of indicators suggest that household non-mortgage debt had improved a little between July 2010 to June 2012 and July 2012 to June 2014:
aggregate household financial liabilities for all private households in Great Britain was estimated to be £101 billion – slightly lower than the £105 billion figure of July 2010 to June 2012. (Table 7)
the percentage of households with financial liabilities fell from 51% in July 2010 to June 2012 to 48% in July 2012 to June 2014 (Table 5.13)
the percentage of individuals with financial liabilities fell from 31% in July 2010 to June 2012 to 29% in July 2012 to June 2014
the median value of household financial liabilities fell from £3,500 in July 2010 to June 2012 to £3,400 in July 2012 to June 2014 (Table 5.13)
Whilst no one of these statistics could be said to show an improvement in household debt, Figure 6 below also indicates an improvement. Whilst there was no change in the percentage of individuals reporting their debt a heavy burden between July 2010 to June 2012 and July 2012 to June 2014, there was a slight decrease in the percentage reporting their debt somewhat of a burden and a slight increase in the percentage reporting their debt as not a problem at all.
Figure 6: Self reported burden of financial debt
Great Britain, July 2010 to June 2014
Source: Wealth and Assets Survey - Office for National Statistics
Download this chart Figure 6: Self reported burden of financial debt
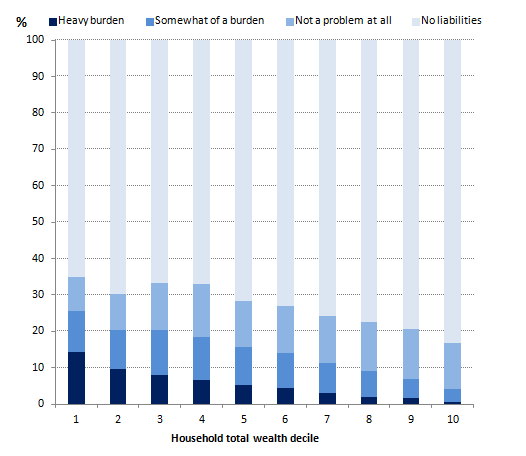
Image .csv .xlsFigure 7 below demonstrates the disparity between those individuals living in households in the highest wealth decile and the lower wealth deciles when asked whether they have any financial liabilities and, if so, when asked if their financial debts were a burden.
In July 2012 to June 2014, 65% of individuals living in households in the lowest total wealth decile had no financial liabilities. This generally increased as the wealth deciles increased – with 83% of individuals living in households in the top wealth decile reporting no financial liabilities. For those with financial debts, those in the higher wealth deciles were a lot less likely to report debt a burden compared to those in the lower wealth deciles: for individuals living in the bottom wealth decile 14% reported they were in financial debt and that they felt the debt “a heavy burden” - this compares to just 1% of individuals living in top wealth decile households. This is explored further in Chapter 7: Extended Analyses of the statistical bulletin accompanying this report.
Figure 7: Financial debt burden by household total wealth decile
Great Britain, July 2012 to June 2014
Source: Wealth and Assets Survey - Office for National Statistics
Download this image Figure 7: Financial debt burden by household total wealth decile
.png (16.6 kB) .xls (21.5 kB)
Table 8: Individuals by age, by household net financial wealth
| Great Britain, July 2014 | |||||||||
| % | |||||||||
| Less than £0 | £0 but < £500 | £500 but < £5,000 | £5,000 but < £12,500 | £12,500 but < £25,000 | £25,000 but < £50,000 | £50,000 but < £100,000 | £100,000 or more | All Households | |
| Under 16 | 34 | 8 | 21 | 10 | 8 | 7 | 5 | 7 | 100 |
| 16-24 | 34 | 9 | 15 | 9 | 8 | 9 | 7 | 9 | 100 |
| 25-34 | 37 | 6 | 19 | 11 | 8 | 7 | 5 | 6 | 100 |
| 35-44 | 31 | 7 | 17 | 12 | 9 | 9 | 7 | 8 | 100 |
| 45-54 | 26 | 7 | 14 | 10 | 9 | 11 | 10 | 13 | 100 |
| 55-64 | 17 | 6 | 11 | 9 | 10 | 12 | 13 | 22 | 100 |
| 65+ | 6 | 6 | 15 | 12 | 11 | 13 | 14 | 23 | 100 |
| All Persons | 26 | 7 | 16 | 11 | 9 | 9 | 8 | 13 | 100 |
| Source: Wealth and Assets Survey, Office for National Statistics | |||||||||
Download this table Table 8: Individuals by age, by household net financial wealth
.xls (27.1 kB)Table 8 shows the distribution of individuals by the net financial wealth of the household in which they live. Over a quarter (26%) of individuals live in households with negative net financial wealth (i.e. their financial debts – e.g. credit cards, overdrafts, loans etc. - are greater than their financial assets – e.g. money in the bank, savings, investments.)
Younger people are more likely to live in households with negative net financial wealth, with over a third of children under the age of 16, and young people aged between 16 of 34 living in such households. Like other forms of wealth, financial assets appear to be accumulated as people get older (with the largest percentage of those aged 65 and over living in households with net financial wealth of £100,000 or more). For young people, in particular children, it is the wealth of their parents that is being reported here rather than their personal financial wealth. For young adults this will be a mixture of those still living with their parents and those starting out in life with few financial assets.
Back to table of contents7. Physical wealth
Table 9: Total household physical wealth, summary statistics
| Great Britain | ||||
| July 2012 to June 2014 | July 2010 to June 2012 | July 2008 to June 2010 | July 2006 to June 20081 | |
| £ Billion | ||||
| Aggregate household physical wealth | 1,150 | 1,080 | 1,016 | 961 |
| £ | ||||
| Mean household physical wealth | 45,000 | 44,600 | 41,100 | 39,100 |
| Source: Wealth and Assets Survey, Office for National Statistics | ||||
| Notes: | ||||
| 1. July 2006 to June 2008 estimates are based on a half sample and multiplied by a factor of 1.76845. | ||||
| 2. Only mean values are given. This is due to the way in which the data is collected. | ||||
Download this table Table 9: Total household physical wealth, summary statistics
.xls (25.1 kB)aggregate physical wealth for all households in Great Britain rose by £70 billion to £1,150 billion in current prices between July 2010 to June 2012 and July 2012 to June 2014, an increase of 7%
mean household physical wealth stood at £45,000, similar to the level in July 2010 to June 2012 (£44,600)
more than three-quarters of aggregate physical wealth (78%) comprised household goods and contents in a household’s main residences
personalised number plates were owned by 7% of households and had a total value of £2 billion. (Table 4.9 in the bulletin reference tables)
Figure 8: Breakdown of aggregate household physical wealth
Great Britain, July 2012 to June 2014
Source: Wealth and Assets Survey - Office for National Statistics
Download this chart Figure 8: Breakdown of aggregate household physical wealth
Image .csv .xls8. About the data in this report
The definition of wealth used in this survey is an economic one: total wealth (gross) is the value of accumulated assets, and total wealth (net) is the value of accumulated assets minus the value of accumulated liabilities.
Total net wealth is defined as the sum of four components1: property wealth (net), physical wealth, financial wealth (net) and private pension wealth. It does not include business assets owned by household members, for instance if they run a business; nor does it include rights to state pensions, which people accrue during their working lives and draw on in retirement.
Net wealth is a ‘stock’ concept rather than a ‘flow’ concept. In other words, it refers to the balance at a point in time. In contrast, income refers to the flow of resources over time. Income allows the wealth to be accumulated, but equally, wealth is capable of producing flows of income either in the present or – as in the case of pension wealth – in the future.
The data presented in this article are cross-sectional estimates. The majority of wealth components are calculated directly from the information given by respondents to the survey, however, private pension wealth is not – some elements of this are modelled (for example the value of the pension pot required for a specific income to be paid in the future – defined benefit type pension scheme). This modelling was developed by the Institute for Fiscal Studies2 and uses external market factors – discount rates and annuity factors – which vary over time and can have large impacts on the estimates of the size of the pension pots required. This is explored further in Chapter 6: Private pension wealth and Chapter 8: Technical details (335.5 Kb Pdf) of the accompanying statistical bulletin.
All estimates are presented as current values (i.e. the value at time of interview) and have not been adjusted for inflation. The reasoning behind this is discussed in Chapter 1: Introduction and Demographics of the accompanying statistical bulletin. Due to the complexity of the data, for example, the use of imputed values and complex weighting, only a very limited amount of high level significance testing has been undertaken, which is presented in the Chapter 8: Technical details (335.5 Kb Pdf) of this report. None of the estimates commented on in this article have been tested for significance.
The survey sampled private individuals and households in Great Britain. This means that people in residential institutions, such as retirement homes, nursing homes, prisons, barracks or university halls of residence, and also homeless people, are excluded from the scope of the analysis presented in this chapter.
As wealth is highly skewed towards the top – the survey was designed to pick up the very wealthy. However, this does mean that the sample now contains some very wealthy outliers. All such cases are thoroughly checked – but they are included in the survey results. Given the skewed nature of wealth data, and the impact that outliers can have on parametric estimates, Wealth in Great Britain 2012 to 2014 does not generally report mean values, instead using the median values to report central tendency (with the exception of physical wealth estimates for which the median valued is meaningless). This is explained further in Chapter 1: Introduction and Demographics of the statistical bulletin accompanying this article.
A small number of figures quoted in the text are not in the tables in this report but are available in the statistical bulletin accompanying this article – and are cross referenced as such.
Notes for about the data in this report
As highlighted in the ONS Wealth in Britain Wave 2 report.