1. Introduction
This chapter looks in a little more detail at a few specific areas previously analysed on separate occasions for earlier periods of the survey: Wealth and income; Wealth of the wealthiest; Debt burden including personal well-being.
The aim of producing this chapter is to put into the public domain, data which we are regularly asked to produce, as well as highlighting some of the main results from the survey. Therefore the reference tables published alongside this chapter contain much more detail than has been included in the main chapter.
All estimates are presented as current values (i.e. the value at time of interview) and have not been adjusted for inflation.
Due to the complexity of the data, for example, the use of imputed values and complex weighting, only a very limited amount of high level significance testing has been undertaken, which is presented in the Technical chapter of this report (335.5 Kb Pdf). None of the estimates commented on in this chapter have been tested for significance.
Back to table of contents2. Wealth and income
Table 7.1 illustrates summary statistics for both total household wealth and household total net equivalised income.
Comparing estimates for total household wealth with income allows us to understand more about their relative size. Estimates for total household wealth were notably larger than income at the 25th percentile, median and 75th percentile points. Focusing on the median value, half of all households had total wealth estimated at £225,100 or more in July 2012 to June 2014. In comparison, half of all households received net equivalised annual income of £24,900 or more. Median total household wealth was therefore about 9 times larger than median total household net equivalised income.
Figure 7.1: Total household wealth ans total net equivalised income, summary statistics
| Great Britain | |||
| £ | |||
| 1st Quartile | Median | 3rd Quartile | |
| Total Household Wealth | 85,700 | 225,100 | 541,400 |
| Total Household Net Equivalised Income | 17,400 | 24,900 | 35,900 |
| Source: Wealth and Assets Survey, Office for National Statistics | |||
Download this table Figure 7.1: Total household wealth ans total net equivalised income, summary statistics
.xls (54.8 kB)Figure 7.2 looks in more detail at the distribution of total household wealth and income, broken down by selected percentile points.
Apart from the lowest percentile point shown, where total household wealth and total household net equivalised annual income were almost identical (£12,600 and £12,100 respectively), the value of total household wealth was larger than the value of household net equivalised annual income. In July 2012 to June 2014, the value of the 20th percentile for total household wealth was just over twice the value of the 20th percentile point for total household net equivalised annual income (£34,600 compared with £15,700). Moving up the distribution, the gap between the percentile values shown for total household wealth and income widens. The 90th percentile value for total household wealth was £1,048,500; nearly 21 times larger than the 90th percentile value for total household net equivalised annual income which stood at £50,400.
Figure 7.2: Distribution of total household wealth and equivalised income, by percentile points
Great Britain, July 2012 to June 2014
Source: Wealth and Assets Survey - Office for National Statistics
Notes:
- Bottom 10% of households have total wealth of £12,600 of less.
- Median total household wealth is £225,100.
- Top 10 % of households have total wealth of £1,048,500 or more.
- Top 1% of households have total wealth of £2,872,600 or more.
Download this chart Figure 7.2: Distribution of total household wealth and equivalised income, by percentile points
Image .csv .xlsHousehold wealth more unequally distributed than income
One way of comparing inequality in the distributions of household wealth and income is to see what proportion of total wealth is held by the wealthiest fifth (20%) of households, and compare this with the proportion of income received by the income richest fifth of households. In July 2012 to June 2014, the wealthiest fifth of households owned 62% of all private household wealth in Great Britain. The richest fifth of households according to their income, received 48% of total household net equivalised annual income. This indicates that there is a higher degree of inequality in household wealth than total household net equivalised income.
Another widely used measure of inequality is the Gini coefficient. The Gini coefficient takes a value between 0 and 1, with 0 representing a perfectly equal distribution and 1 representing maximal inequality. The Gini coefficient for total household wealth is 0.63 compared with 0.33 for total household net equivalised annual income , which again shows that the distribution of household wealth is less equal than the distribution of total household net equivalised income.
Differences in inequality between the distributions of total household wealth and income can also be illustrated using Lorenz curves. Lorenz curves provide a graphical representation of the inequality of a distribution; with the diagonal 45 degree line representing a perfectly equal distribution. Figure 7.3 shows the distribution of total household wealth was more unequal than total household net equivalised income, with the Lorenz curve for wealth a further distance away from the line of perfect equality than for income.
Figure 7.3: Distribution of total household wealth and total household net equivalised income
Great Britain, July 2012 to June 2014

Source: Wealth and Assets Survey - Office for National Statistics
Download this image Figure 7.3: Distribution of total household wealth and total household net equivalised income
.png (17.4 kB) .xls (2.2 MB)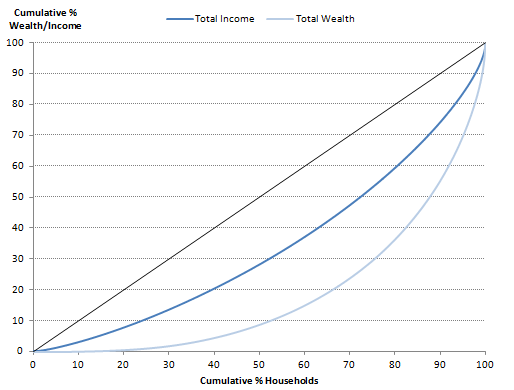
Households with higher levels of income tend also to have higher wealth
Households with high levels of income often have high levels of wealth. Nevertheless, there are exceptions to this rule. For instance, some young individuals might be on high levels of income but have yet to accumulate comparably high levels of wealth, and conversely some retired people may have relatively low incomes but high levels of wealth.
Figure 7.4 is a box plot which graphically presents the distribution of total household wealth, by total household net equivalised income quintiles. Quintiles here split households into five equally sized groups based upon their total household net equivalised income. The first quintile represents the fifth of households with the lowest income and the fifth quintile represents the fifth of households with the highest income. The boxes in the graph represent the wealth of the middle 50% of households in each income group; the area covered by the lighter coloured area on the right side of the boxes represents the third quartile and the darker coloured area on the left side of the boxes represents the second quartile for each of the quintiles. The median value for each quintile lies where the lighter and darker shaded areas meet. The horizontal lines on either side of the boxes are known as whiskers, with the end of the whisker to the right representing the 90th percentile and the end of the whisker to the left the 10th percentile.
Figure 7.4: Total household wealth, by total household equivalised income quintile
Great Britain, July 2012 to June 2014
Source: Wealth and Assets Survey - Office for National Statistics
Notes:
- Quintile 1 = Lowest income; Quintile 5 = Highest income.
Download this chart Figure 7.4: Total household wealth, by total household equivalised income quintile
Image .csv .xlsThe median value of total household wealth rises as we move through the income groups from lowest to highest. Households in the bottom income group (with total household net equivalised annual income less than £15,700) had median total wealth of £56,500. Households in the highest income group (with total household net equivalised annual income of £39,400 or more) had median total wealth of £656,700. However, there were households with low levels of income but high wealth, and there were also households with high levels of wealth but low income. The whisker (the 90th percentile) on the far right for the first income group represents a value of total household wealth which is higher than the median total wealth value (£372,000) for all but the top income group. Conversely, the whisker (10th percentile) on the far left in the highest income group was £116,000, which is lower than the median total household wealth value for all but the lowest income quintile. Households with low income and high wealth, and those with high income and low wealth are explored further in Figure 7.5.
Box plots also tell us something about the distribution of total household wealth within the income groups. The box plot for the lowest quintile of total household income is not as long as the other quintiles, indicating that the values of total household wealth in this quintile were less widely distributed than for other quintiles. The box plot for the fifth quintile of total household income is the longest, which suggests that the distribution of total household wealth in this quintile is more varied than it is for households in the lower groups of total household income. Additionally, the whisker stretches a lot further to the right of the median value for the highest income group, indicating that there are more extreme values of total household wealth and bunching in the lower end of the distribution.
Some households with higher levels of income do not also have higher wealth
Figure 7.5 explores the relationship between the income and wealth quintiles that a household belongs to. A higher percentage of households in the top income quintile also found themselves in the top wealth quintile than any other income group (50%). Similarly, a higher percentage of households in the lowest quintile of total household income found themselves in the lowest quintile of total household wealth than any other income group (42%). The distribution of households across the different wealth quintiles was most even for the middle income group.
Figure 7.5: Distribution of total household wealth, by total household net equivalised income quintile
Great Britain, July 2012 to June 2014
Source: Wealth and Assets Survey - Office for National Statistics
Download this chart Figure 7.5: Distribution of total household wealth, by total household net equivalised income quintile
Image .csv .xls3. Wealth of the wealthiest
Chapter 2 – Total Wealth - presented figures for aggregate total wealth; the combined net wealth of all private households within Great Britain, estimated as £11.1 trillion in July 2012 to June 2014. The wealth held by the richest 10% of households combined was just under £5 trillion and represented a 45% share of aggregate total wealth.
This section looks in a little more detail at the wealthiest 10% of households and makes comparisons with households with lower wealth.
Figure 7.6 shows how the wealth of the top 10% of households compares to the bottom half of all households. The combined wealth of the bottom half of households in the distribution was less than £1.0 trillion; a value which accounted for just 9% of aggregate total wealth.
Figure 7.6: Distribution of total household wealth
Great Britain, July 2012 to June 2014

Source: Wealth and Assets Survey - Office for National Statistics
Download this image Figure 7.6: Distribution of total household wealth
.png (27.7 kB) .xls (18.9 kB)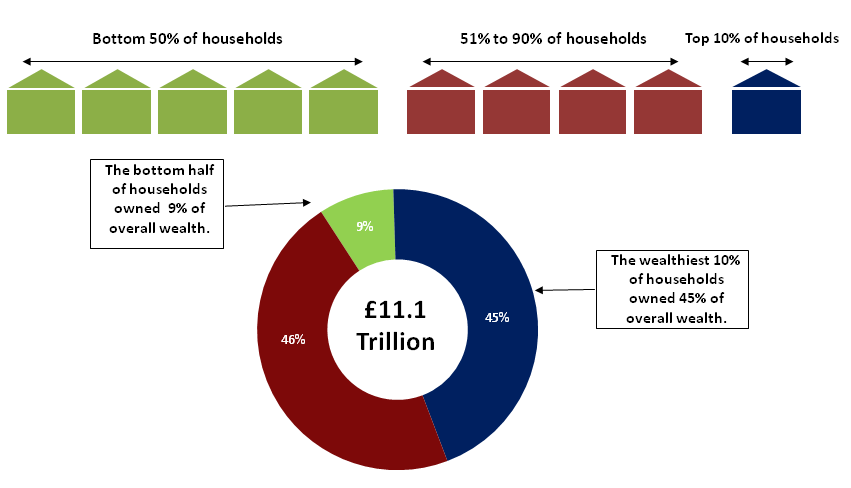
The wealth held by the top 10% of households was around 5 times greater than the wealth of the bottom half of all households combined and, over 875 times greater than that of the least wealthy 10% of households.
Figure 7.7 shows the percentile points for total household wealth (these are the boundary values for total household wealth if the population is split into 100 groups). The median value for household total wealth was £225,100 i.e. half of all households had total wealth less than this and half of all households had total wealth more than this. Belonging to the wealthiest 10% of households required total wealth greater than £1,048,500. To be in the bottom 10% of the distribution, a household’s value of total wealth needed to be less than £13,000.
Figure 7.7: Distribution of total household wealth, percentile points
Great Britain, July 2012 to June 2014
Source: Wealth and Assets Survey - Office for National Statistics
Notes:
- Bottom 10 % of households have total wealth of £12,600 or less.
- Median total household wealth is £225,100.
- Top 10% of households have total wealth of £1,048,500 or more.
- Top 1% of households have total wealth of £2,872,600 of more.
Download this chart Figure 7.7: Distribution of total household wealth, percentile points
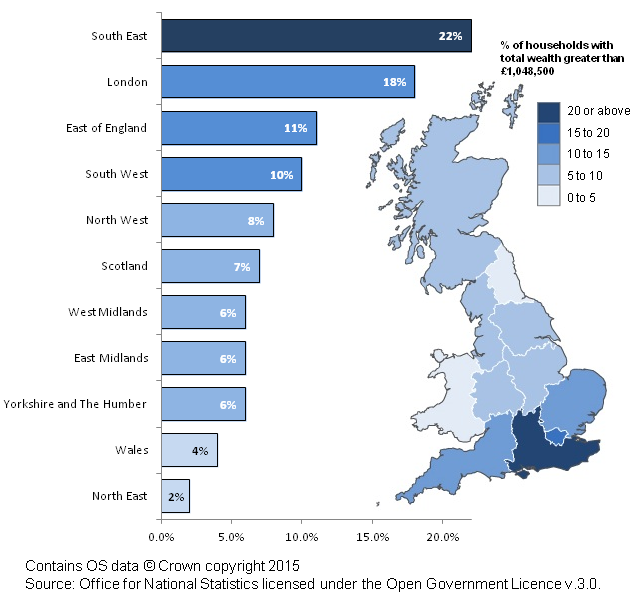
Image .csv .xlsWealth by region
Considering the nine regions of England and the countries of Wales and Scotland, the South East had the highest percentage of ‘wealthy’ households. Of all the households in this particular region, 21.1% had a value of total wealth greater than £1,048,500; enough to belong to the wealthiest tenth of households in Great Britain. In comparison, only 2.5% of households in the North East held wealth greater than £1,048,500.
Figure 7.8: Percentage of wealthy households by region
Great Britain, July 2012 to June 2014
Source: Wealth and Assets Survey - Office for National Statistics
Download this image Figure 7.8: Percentage of wealthy households by region
.png (117.0 kB) .xls (27.1 kB)
The components of wealth
Of the total wealth held by those households in the top decile, over half (43%) comprised private pension wealth. Nearly all households in this top wealth decile had private pension wealth (98%) and the median value of private pension wealth for these households was £749,000. Private pension wealth contributed only 29% to the wealth held by the least wealthy half of households. More than two out of five households (43%) in the least wealthy half of the distribution had no private pension wealth at all and the median value of private pension wealth held by this group was £2,800.
The contribution of property wealth (net) to the combined total wealth of the top 10% of households was 31% with a median value of £420,000. Property wealth made the largest contribution to total wealth for the least wealthy half of households (34%) even though only 40% of households in this group had any value of property wealth.
Net financial wealth contributed 21% of overall wealth held by the wealthiest tenth of households; the median value of this wealth was £153,900. For the least wealthy half of households, net financial wealth accounted for 4% of the overall wealth held by this group with a median value of £400.
Figure 7.9a: Breakdown of household total wealth by components
Wealthiest 10% - Great Britain, July 2012 to June 2014
Source: Wealth and Assets Survey - Office for National Statistics
Download this chart Figure 7.9a: Breakdown of household total wealth by components
Image .csv .xls
Figure 7.9b: Breakdown of household total wealth by components
Least Wealthy 50% - Great Britain, July 2012 to June 2014
Source: Wealth and Assets Survey - Office for National Statistics
Download this chart Figure 7.9b: Breakdown of household total wealth by components
Image .csv .xlsPhysical wealth (the value of a household’s possessions, valuables etc.) made a far greater contribution to the combined wealth holdings of the least wealthy half of households (33%) than to the most wealthy tenth of households (5%). Nevertheless, the median value of physical wealth was lower for those households in the bottom half of the distribution (£18,150) than those in the top tenth (£74,300).
Some main comparisons
In July 2012 to June 2014
median household private pension wealth was £749,000 for households in wealthiest 10% compared to £2,800 for households in the least wealthy 50%
median net property wealth was £420,000 for households in wealthiest 10% compared to £0 for households in the least wealthy 50%
median net financial wealth was £154,000 for households in wealthiest 10% compared to £400 for households in the least wealthy 50%
96% of households in the wealthiest 10% owned at least one car compared to 58% for households in the least wealthy 50%
14% of households in the wealthiest 10% owned a personalised number plate compared to 2% for households in the least wealthy 50%
4. Debt burden
There are two components of wealth which are presented as a “net” measure (i.e. assets minus liabilities) – net financial wealth and net property wealth. In addition to asking about the value of any personal and household liabilities, respondents who are responding in person are asked how much of a burden they feel these debts are. This section considers self reported debt burden for financial liabilities. Some additional tables looking at property debt are included in the reference tables.
Financial debt burden
Chapter 5 – Financial Wealth - presented figures for both financial assets and financial liabilities held by households. Financial assets include savings, shares, insurance products and bonds. Financial liabilities include non-mortgage borrowing such as credit cards, loans and overdrafts. As reported in chapter 5, in July 2012 to June 2014 aggregate household financial liabilities for all private households in Great Britain was estimated to be £101 billion – slightly lower than the £105 billion figure of July 2010 to June 2012. Additionally, the percentage of households with financial liabilities fell from 51% in July 2010 to June 2012 to 48% in July 2012 to June 2014, as did the median value of household financial liabilities from £3,500 to £3,400 over the same period. Whilst no one of these statistics could be said to show an improvement in household debt, Figure 7.10 below also indicates an improvement. Whilst there was no change in the percentage of individuals reporting their debt a heavy burden between July 2010 to June 2012 and July 2012 to June 2014, there was a slight decrease in the percentage reporting their debt somewhat of a burden and a slight increase in the percentage reporting their debt as not a problem at all.
Figure 7.10: Self- reported burden of financial debt
Great Britain, July 2006 to June 2014
Source: Wealth and Assets Survey - Office for National Statistics
Download this chart Figure 7.10: Self- reported burden of financial debt
Image .csv .xlsTable 7.11 shows the median household financial debt by household total wealth decile. For those with financial debt, with the exception of the lowest wealth decile, financial debt levels increase as total wealth decile increases. Median financial debt is lowest for households in the second total wealth decile.
Table 7.11: Median financial debt by household total wealth decile
| Great Britain | ||
| £ | ||
| Median Household Financial Debt1 | ||
| July 2012 to June 2014 | July 2010 to June 2012 | |
| 1st decile (lowest) | 1,900 | 2,600 |
| 2nd decile | 1,600 | 1,700 |
| 3rd decile | 3,300 | 3,500 |
| 4th decile | 4,500 | 4,500 |
| 5th decile | 4,100 | 4,200 |
| 6th decile | 4,100 | 3,900 |
| 7th decile | 3,500 | 4,100 |
| 8th decile | 4,100 | 3,800 |
| 9th decile | 4,800 | 4,500 |
| 10th decile (highest) | 4,900 | 4,800 |
| All households | 3,400 | 3,500 |
| Source: Wealth and Assets Survey - Office for National Statistics | ||
| Notes: | ||
| 1. Includes only households with financial liabilities. | ||
Download this table Table 7.11: Median financial debt by household total wealth decile
.xls (55.8 kB)Figure 7.12 below demonstrates the disparity between those individuals living in households in the highest wealth decile and the lower wealth deciles when asked whether they have any financial liabilities and, if so, when asked if their financial debts were a burden.
In July 2012 to June 2014, 65% of individuals living in households in the lowest total wealth decile had no financial liabilities. This generally increased as the wealth deciles increased – with 83% of individuals living in households in the top wealth decile reporting no financial liabilities. For those with financial debts, those in the higher wealth deciles were a lot less likely to report debt a burden compared to those in the lower wealth deciles. For individuals living in the bottom wealth decile 14% reported they were in financial debt and that they felt the debt “a heavy burden” - this compares to just 1% of individuals living in top wealth decile households.
Figure 7.12: Median financial debt by household total wealth decile
Great Britain, July 2010 to June 2014
Source: Wealth and Assets Survey - Office for National Statistics
Download this chart Figure 7.12: Median financial debt by household total wealth decile
Image .csv .xlsThe remainder of this section addresses only those households and individuals who have financial liabilities.
Table 7.13 shows the median household financial debt by household total net equivalised income decile. For those with financial debt the median value increases as total income decile increases. For those with financial debt, the median value for those in the highest income decile is around 5 times the value for those in the lowest income decile.
Figure 7.13: Median financial debt by household total net equivalised annual income decile
| Great Britain | ||
| £ | ||
| Median Household Financial Debt1 | ||
| July 2012 to June 2014 | July 2010 to June 2012 | |
| 1st decile (lowest) | 1,300 | 1,500 |
| 2nd decile | 1,500 | 1,700 |
| 3rd decile | 1,600 | 1,800 |
| 4th decile | 2,500 | 2,800 |
| 5th decile | 3,600 | 3,200 |
| 6th decile | 3,700 | 3,700 |
| 7th decile | 4,400 | 5,100 |
| 8th decile | 5,700 | 5,800 |
| 9th decile | 6,200 | 6,500 |
| 10th decile (highest) | 6,500 | 6,900 |
| All households | 3,442 | 3,500 |
| Source: Wealth and Assets Survey - Office for National Statistics | ||
| Notes: | ||
| 1. Includes only households with financial liabilities. | ||
Download this table Figure 7.13: Median financial debt by household total net equivalised annual income decile
.xls (56.3 kB)Figure 7.14 illustrates that individuals in the tenth (highest) net equivalised income decile are least likely to find their financial debt a heavy burden, at 5%. Whereas individuals in the first (lowest) net income decile were more likely to find their financial debt a heavy burden, at 43% and somewhat of a burden, at 33%.
Fewer Individuals report having a heavy burden as the net income decile gets higher. In the third decile, 30% of individuals reported a heavy burden; 20% of individuals in the fifth decile reported a heavy burden and 8% in the eighth income decile.
Figure 7.14: Individual financial debt burden by household net equivalised income decile
Great Britain, July 2012 to June 2014
Source: Wealth and Assets Survey - Office for National Statistics
Download this chart Figure 7.14: Individual financial debt burden by household net equivalised income decile
Image .csv .xlsThe South East had largest amount of financial debt in July 2012 to June 2014, estimated at £4,000. This is followed by the East of England accumulating up to £3,900 in median financial debt. Overall, individuals in England are estimated to have a median of £3,500 in July 2012 to June 2014, which is a small decrease from £3,600 in July 2010 to June 2012. Wales is shown to have had the lowest financial debts with of a median of £2,800 – though this has increased from previous levels of £2,000. Scotland had a median value of financial debts of £3,500 in July 2012 to June 2014, the same as the level in July 2010 to June 2012.
Figure 7.15: Median financial debt by region
| Great Britain | ||
| £ | ||
| Median Household Financial Debt1 | ||
| July 2012 to June 2014 | July 2010 to June 2012 | |
| North East | 3,180 | 3,650 |
| North West | 3,100 | 3,100 |
| Yorkshire & the Humber | 3,750 | 3,800 |
| East Midlands | 3,350 | 3,000 |
| West Midlands | 2,900 | 2,829 |
| East of England | 3,870 | 4,081 |
| London | 3,430 | 3,746 |
| South East | 4,000 | 4,591 |
| South West | 3,730 | 3,796 |
| All England Regions | 3,473 | 3,636 |
| Wales | 2,830 | 2,000 |
| Scotland | 3,480 | 3,500 |
| Great Britain | 3,442 | 3,500 |
| Source: Wealth and Assets Survey - Office for National Statistics | ||
| Notes: | ||
| 1. Includes only households with financial liabilities. | ||
Download this table Figure 7.15: Median financial debt by region
.xls (55.8 kB)Figure 7.16 illustrates that 27% of individuals in London reported their financial debt was a heavy burden, closely followed by the North West with 24%. London was least likely to find their debt not a problem at all, at 40%; overall indicating the highest levels of burden debt among individuals living in London.
The South East reported the highest amount of individuals finding their financial debt not a problem at all. The South East, along with Scotland and the North East were the least likely to report financial debt a heavy burden (17%).
Overall, 20% of England found their financial debt a heavy burden, compared to 34% reporting somewhat of a burden and 46% defining their burden as not a problem at all.
Figure 7.16: Financial debt burden by region
Great Britain, July 2012 to June 2014
Source: Wealth and Assets Survey - Office for National Statistics
Download this chart Figure 7.16: Financial debt burden by region
Image .csv .xlsFigure 7.17 illustrates individuals by age by the median financial debt of the household in which they live. This shows that those in the age band 25 to 34 tend to live in households with a higher level of debt than individuals in other age groups. Individuals aged 65 and over tend to live in households with the lowest value of financial debt.
Figure 7.17: Median financial debt by age
| Great Britain | ||
| £ | ||
| July 2012 to June 2014 | July 2010 to June 2012 | |
| 16 to 24 | 2,552 | 3,000 |
| 25 to 34 | 2,820 | 2,978 |
| 35 to 44 | 2,343 | 2,575 |
| 45 to 54 | 2,000 | 2,400 |
| 55 to 64 | 1,950 | 1,638 |
| 65 and over | 1,134 | 924 |
| Source: Wealth and Assets Survey - Office for National Statistics | ||
| Notes: | ||
| 1. Includes only households with financial liabilities. | ||
Download this table Figure 7.17: Median financial debt by age
.xls (55.3 kB)Around a quarter of individuals aged “35 to 44” or “45 to 54” indicating that they have the heaviest debt burden (24% and 25% respectively) and those aged “35 to 44” report the highest levels of debt considered to be “somewhat of a burden” (38%). The age group “65 and over” are least likely to have debt burden, with Figure 7.18 illustrating that 12% have a heavy debt burden and 28% stated somewhat of a burden. They are also more likely to report their financial debt not a problem at all (60%).
Figure 7.18: Financial debt burden by age
Great Britain, July 2012 to June 2014
Source: Wealth and Assets Survey, Office for National Statistics
Download this chart Figure 7.18: Financial debt burden by age
Image .csv .xlsDebt burden and personal well-being
The following analysis explores the relationship between self-reported debt burden and personal well-being, providing insights into the possible impact such debts may have on people's thoughts and feelings about their own quality of life.
Personal well-being questions form part of the wider National Well-being programme which aims to produce accepted and trusted measures of the well-being of the nation. Four measures of the personal well-being of individuals were developed as part of this programme and are now being used across a large number of surveys including the Annual Population Survey (APS) and WAS.
Life satisfaction, sense that things done in life are worthwhile and happiness all higher, and anxiety lower, for individuals not burdened by financial debt
The average ratings for each measure of personal well-being against the perceived burden of financial debt are shown in Figure 7.19. Those who considered their financial liabilities not to be a burden reported the highest average ratings of life satisfaction, sense that things they do in life are worthwhile and happiness compared with those who reported their financial debt a burden. Additionally, average ratings of anxiety were lowest for those individuals not considering their financial debt a burden.
Figure 7.19a: Average personal well-being ratings, by self reported financial debt burden
Life Satisfaction - Great Britain, July 2012 to June 2014
Source: Wealth and Assets Survey - Office for National Statistics
Download this chart Figure 7.19a: Average personal well-being ratings, by self reported financial debt burden
Image .csv .xls
Figure 7.19b: Average personal well-being ratings, by self reported financial debt burden
Worthwhile - Great Britain, July 2012 to June 2014
Source: Wealth and Assets Survey - Office for National Statistics
Download this chart Figure 7.19b: Average personal well-being ratings, by self reported financial debt burden
Image .csv .xls
Figure 7.19c: Average personal well-being ratings, by self reported financial debt burden
Happiness - Great Britain, July 2012 to June 2014
Source: Wealth and Assets Survey - Office for National Statistics
Download this chart Figure 7.19c: Average personal well-being ratings, by self reported financial debt burden
Image .csv .xls
Figure 7.19d: Average personal well-being ratings, by self reported financial debt burden
Anxiety - Great Britain, July 2012 to June 2014
Source: Wealth and Assets Survey - Office for National Statistics
Download this chart Figure 7.19d: Average personal well-being ratings, by self reported financial debt burden
Image .csv .xlsOut of the four personal well-being questions, life satisfaction displayed the largest difference in average ratings across the debt burden groups. Those considering their financial debt not to be a burden reported an average life satisfaction rating of 7.7. This was 0.6 points higher compared with those considering their debts somewhat of a burden (7.1), and 1.8 points higher compared with those who considered their debts a heavy burden (6.0).
Considering the other 3 personal well-being questions:
average worthwhile ratings were highest for those appraising their financial debts not a burden (7.8), compared with those reporting them as somewhat of a burden (7.5), or a heavy burden (6.8)
reporting of ‘happiness yesterday’ was also highest amongst those considering their financial debts not a problem at all (7.6), compared with those considering them somewhat of a burden (7.1), or a heavy burden (6.2)
average ‘anxiety yesterday’ ratings were lowest for the group perceiving their financial debt as not a problem at all (2.6), compared with those considering them somewhat of a burden (3.1), or a heavy burden (4.1)
There are notable limitations to this analysis. The results are not the outcome of regression analysis, trying to hold all other characteristics (e.g. age) equal. Results therefore do not they tell us how important self-reported debt burden matters to well-being ratings compared against other factors. Nevertheless, the results provide some evidence that feelings of being on top of financial liabilities have a positive effect on an individual’s personal well-being ratings. Further analysis of the relationship between debt and personal well-being is recommended.
Notes for debt burden
- Adults aged 16 and over were asked: "Overall, how satisfied are you with your life nowadays?" "Overall, to what extent do you feel the things you do in your life are worthwhile?" "Overall, how happy did you feel yesterday?" "Overall, how anxious did you feel yesterday?" Where 0 is "not at all" and 10 is "completely".